Abstract
In order to provide a prediction tool for sulfide/oxide/oxysulfide inclusion evolution in Mn–Al steel with a Ca addition/CaO-based flux, a comprehensive thermodynamic database for the inclusion system composed of CaO–MnO–Al2O3–CaS–MnS–Al2S3 was developed in the present study. Activity of MnS in a CaS–MnS sulfide solid solution was experimentally determined by employing a chemical equilibrium technique at 1400°C and 1500°C. The measured activity exhibits a positive deviation from an ideal behavior, which is in consistent with the known two-phase separation of the sulfide solid solution at lower temperature (Tcr = ~ 1200°C). Based on the activity and the phase diagram data available in literature, a thermodynamic modeling of the CaS–MnS system was carried out. The following excess Gibbs free energy of the CaS–MnS sulfide solid solution was obtained:
Furthermore, using available thermodynamic modeling results for other constituent sub-systems, a larger thermodynamic database of the CaO–MnO–Al2O3–CaS–MnS–Al2S3 system was developed. A Modified Quasichemical Model in the quadruplet approximation was used to model the Gibbs free energy of the oxysulfide liquid solution. Comparisons between the model calculation and available experimental data show good agreement. The developed thermodynamic model and the database were used to predict unexplored phase diagrams with various nMn/(nCa + nMn) ratio, and sulfide capacity of the CaO–MnO–Al2O3 oxide liquid phase. The database can be used along with software for Gibbs free energy minimization in order to calculate any phase diagram section or thermodynamic property.
1. Introduction
Non-metallic inclusions are practically important for steel processing and products. Those are responsible for low quality of the products because it may cause surface defect, crack initiation, wire breakage, etc. Also, a tundish nozzle clogging has been one of main detrimental aspects of the non-metallic inclusions in the processing point of view.1) On the other hand, utilization of the non-metallic inclusions has been also attempted in order to increase physical property of the steel products through decrease of grain size.2) Non-metallic inclusions observed typically during the steelmaking process are oxide and/or sulfide. Control of the inclusions evolution during the steelmaking process and subsequent processes such as casting/reheating/soaking is very important in the production of clean and high quality steel. In this regard, phase stability of the inclusions is indispensable information, and recent advances of thermodynamic modeling and thermodynamic database for those inclusion systems are attractive not only for scientific but also for practical point of view.
So far, thermodynamic modeling of oxide systems has been carried out extensively3,4,5,6) and its application has been shown to be useful in the prediction of the evolution of oxide inclusions in steel.7,8,9) However, similar investigations about sulfide and oxysulfide inclusions have been very limited, mainly due to lack of experimental information, and also due to lack of available thermodynamic models which can describe complicated nature of the oxysulfide. Therefore, it is desirable to have a thermodynamic model and a thermodynamic database of the sulfide and the oxysulfide systems which can be used to predict the evolution of sulfide/oxysulfide inclusions in the steel. This is important particularly for the high S containing steel such as resulfurized free-cutting steel.10)
In the present authors’ laboratory, a thermodynamic model and a database of potential sulfide/oxysulfide inclusion systems have been developed through a combination of experimental investigation and thermodynamic modeling for manganese aluminosilicate containing S11,12,13) and calcium aluminate and calcium silicate containing S.14) Both Mn and Ca are known to form sulfide easily, and the MnS and the CaS are typical sulfide inclusions often found in several grades of steels. In order to develop the thermodynamic database for those systems and to better understand solution behavior of the liquid oxysulfide systems, phase diagrams and activity have been measured, and a CALPHAD type thermodynamic modeling has been carried out.
In the present study, sulfide and oxysulfide systems simultaneously containing Ca and Mn were investigated. A CaO–MnO–Al2O3 system containing S would be observed in Mn–Al steel with a possible Ca addition/CaO-based flux. It is considered to form a (Ca,Mn)S sulfide solid solution and an oxysulfide liquid solution composed of CaO–MnO–Al2O3–CaS–MnS–Al2S3 in the steel. In order to develop the thermodynamic database for these systems, activity of MnS in the (Ca,Mn)S sulfide solid solution was measured, and a thermodynamic modeling of the CaS–MnS system was first carried out. Then, a thermodynamic database for the CaO–MnO–Al2O3–CaS–MnS–Al2S3 system was developed by merging the previous thermodynamic modeling results which were carried out by the present authors and by other investigators.3,5,14,15,16,17) All thermodynamic calculations were carried out using FactSage thermochemical computing system.18,19) The obtained thermodynamic model and the database are then used to calculate compositions of liquid and solid phases in the system as well as the activity, and those are compared with available data in the literature. Predicted phase diagram and sulfide capacity are also shown in Sec. 4.
2. CaS–MnS System
2.1. Literature Data
Reports on experimental investigations of the CaS–MnS system are only in the form of the phase diagram. It has been known that both CaS and MnS are iso-structural (NaCl-type rock salt structure). They form a continuous sulfide solid solution (Ca,Mn)S at high temperature, but split into two phases (Ca,Mn)S and (Mn,Ca)S at low temperature. Salter and Pickering20) first proposed a miscibility gap between the CaS and the MnS in their solid state. Kiessling and Westman,21) and Skinner and Luce22) determined solubility limit of the MnS in the CaS (and vice versa) by a lattice parameter measurement in the equilibrated samples. Results of Skinner and Luce22) showed wider and asymmetric gap than those of Kiessling and Westman.21) Later, Leung and van Vlack23) extended the phase diagram study to higher temperature in order to determine liquidus and solidus, using the lattice parameter analysis, metallography and electron probe analysis. All these data are shown in Fig. 1.
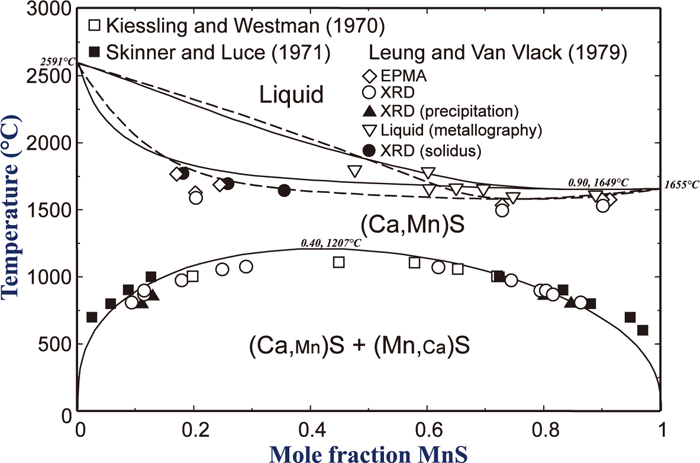
Gatellier et al.24) reported a Henrian activity coefficient of CaS in the solid (Ca,Mn)S solution at 1470°C (γ °CaS = 2.3). However, the value was obtained by extrapolating to pure MnS from the CaS–MnS–FeS (XFeS = 0.07–0.28) ternary sulfide solution, thus it can only be regarded as an estimation. Lu et al.25) assumed a regular solution behavior of the (Ca,Mn)S solid solution from the reported immiscibility,21,22,23) and then derived a regular solution parameter (αCaS–MnS = 2RTcr = 23332 J/mol) to calculate activities of CaS and MnS in the solution. However, no experimentally determined activity data has been available up to date. Also, asymmetric character of the miscibility gap is also necessary to be taken into account in thermodynamic modeling of the (Ca,Mn)S sulfide solution.
2.2. Experimental Procedure
In order to provide a thermodynamic property in the thermodynamic modeling of the CaS–MnS system, the activity of MnS in the solid (Ca,Mn)S solution was measured by the chemical equilibration technique. Both 1) sulfide/Pt/gas equilibrium and 2) flux/sulfide/Pt/gas equilibrium were attempted. In general, preliminary solution-treated synthesized (Ca,Mn)S sulfide solid pellets were equilibrated with Pt foils (with or without flux) under controlled O2/S2-bearing gas at 1400°C and 1500°C. The activity of MnS was calculated from the Mn content dissolved in the Pt foil and the partial pressures of S2 in the gas:
|
Mn(bcc)+
1/2S
2
(g)=MnS(
s
)
; Δ
g
(
1
)
°
| (1) |
|
K
(
1
)
=exp(
-Δ
g
(
1
)
°
/RT
)
=
a
MnS
/(
a
Mn
p
S
2
1/2
)
=
a
MnS
/(
γ
Mn
X
Mn
p
S
2
1/2
)
| (2) |
|
a
MnS
= exp(
-Δ
g
(
1
)
°
/RT
)
×(
γ
Mn
X
Mn
p
S
2
1/2
)
| (3) |
where R,
T,
ai,
γi,
Xi, and
pi are gas constant, absolute temperature, activity of
i, activity coefficient of
i, mole fraction of
i, and partial pressure of
i, respectively.
All experiments were carried out in a tightly sealed recrystallized alumina tube in a resistance furnace equipped with the heating elements of MoSi2. A number of small alumina crucibles (17 OD × 15 ID × 15 H (mm)) containing different samples (sulfide/Pt/with or without a flux as described later) were put in an alumina holder (or graphite holder), and the whole assembly was equilibrated in the alumina tube in the furnace. Atmosphere inside the tube was controlled by a flowing gas mixture composed of CO–SO2–Ar, by which pO2 and pS2 were fixed. Gases flown in the tube was purified by a silica gel for moisture, by a Mg chip heated at 450°C for trace of oxygen, and by an Ascarite® for trace of CO2, respectively. The flow rate of each gas (shown in Table 1) was accurately controlled by a mass flow controller, preliminarily calibrated by a soap-bubble-column technique.26) These gases were mixed in a mixing chamber before flown into the reaction tube. The equilibrium partial pressure of O2 and S2 in the gas were calculated using the FactSage thermochemical computing system18,19) along with the Gibbs energies of gases composed of C, O, S, and Ar from the JANAF thermochemical data compilation.27) The temperature of the furnace was controlled by a Proportional-Integral-Differential (PID) controller, which is connected to a thermocouple (Pt-6pct Rh/Pt-30 pct Rh). In addition, the temperature of the samples was continuously monitored during the whole experiment by using another thermocouple of Pt-6 pct Rh/Pt-30 pct Rh, which was placed near the reaction crucibles assembly.
Table 1. Experimental conditions and results of the activity measurement in the CaS–MnS solid solution
a).
| No. | T (°C) | Flow rate (ml/min) | Partial pressureb) | (Pt,Mn) | (Ca,Mn)S |
|---|
| Ar | CO | SO2 | O2 | S2 | XMn | γMnc) | XMnS | aMnSd) |
|---|
| 1 | 1400 | 0 | 30 | 30 | 5.32×10⁻¹⁷ | 2.25×10⁻² | 0.173 | 1.31×10⁻⁴ | 0.389 | 0.671 |
| 2 | 1400 | 120 | 30 | 30 | 1.16×10⁻¹⁷ | 1.05×10⁻² | 0.189 | 1.74×10⁻⁴ | 0.339 | 0.666 |
| 3 | 1400 | 120 | 30 | 30 | 1.16×10⁻¹⁷ | 1.05×10⁻² | 0.190 | 1.77×10⁻⁴ | 0.504 | 0.682 |
| 4 | 1400 | 240 | 30 | 30 | 1.60×10–08 | 1.72×10⁻² | 0.163 | 1.09×10⁻⁴ | 0.152 | 0.461 |
| 5 | 1400 | 240 | 30 | 30 | 1.60×10–08 | 1.72×10⁻² | 0.166 | 1.15×10⁻⁴ | 0.162 | 0.496 |
| 6 | 1400 | 240 | 30 | 30 | 1.60×10–08 | 1.72×10⁻² | 0.176 | 1.38×10⁻⁴ | 0.298 | 0.630 |
| 7 | 1400 | 240 | 30 | 30 | 1.60×10–08 | 1.72×10⁻² | 0.174 | 1.33×10⁻⁴ | 0.297 | 0.601 |
| 8 | 1500 | 120 | 30 | 30 | 3.00×10⁻¹⁷ | 1.08×10⁻² | 0.225 | 3.24×10⁻⁴ | 0.135 | 0.472 |
| 9 | 1500 | 120 | 30 | 30 | 3.00×10⁻¹⁷ | 1.08×10⁻² | 0.229 | 3.47×10⁻⁴ | 0.173 | 0.514 |
a) Graphite holder was used for samples 1, 2, 3, 8, and 9, and alumina holder was used for the others.
b) Calculated using FactSage.
18,19)c) Calculated using the
Eq. (4) with reference to pure bcc Mn.
29)d) With reference to pure solid MnS.
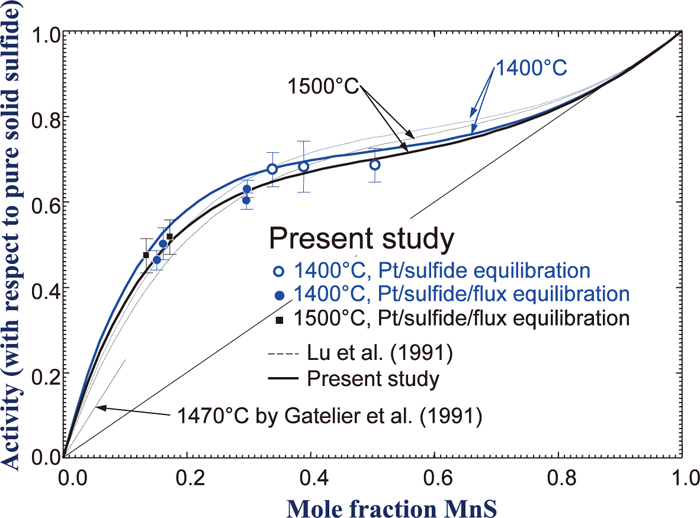
Sulfide solid solutions of various compositions were preliminary synthesized from reagent grade sulfide powder of MnS (99.9 mass pct; Kojundo, Japan) and CaS (99.99 mass pct, Kojundo, Japan). Those mixtures were pelletized (10 D × 12 H (mm)) and heated in an alumina crucible at 1300°C for 3 hours under a gas composed of Ar–SO2–CO. Then, those sulfide pellets were ground into fine powder (10 to 50 μm) and pelletized again along with two Pt foils (2 W × 7 L × 0.1 T (mm)), as shown in Fig. 2(a). The mixture was put in an alumina crucible, and the crucible was again put in an alumina or graphite holder. In preliminary tests, it was attempted to determine the equilibrium time in the sulfide/Pt/gas using a sample (initial XMnS in (Ca,Mn)S was 0.2). The equilibrium could not be obtained even after 60 hours. According to the microscopic analysis for the sample, there appeared a Mn-depleted zone in the (Ca,Mn)S near the Pt (Fig. 2(b)). This resulted in a difficulty in the measurement of equilibrium concentration of Mn in the (Ca,Mn)S. When initial XMnS in (Ca,Mn)S was increased (XMnS > 0.35), the Mn-depleted zone was not observed while the Pt foil was almost saturated by Mn. Therefore, for samples with low initial XMnS in the (Ca,Mn)S, a new experimental approach was introduced.

The preliminarily synthesized and ground (Ca,Mn)S sulfide solid solution was mixed with oxide powders of MnO (99.9 mass pct; Kojundo, Japan), CaO calcined from CaCO3 (99.5 mass pct; Kanto chemical, Japan), and Al2O3 (99 mass pct; Kanto, Japan). The sulfide/oxide mixture was put in an alumina crucible with the same dimension used previously along with two Pt foils (Fig. 2(c)). This was intended to accelerate the reaction between the (Ca,Mn)S of smaller size and the Pt foil via liquid oxysulfide flux composed of CaO–MnO–Al2O3–S, inspired by the work of Fukaya and Miki.28) In this approach, equilibrium of the system was obtained in a shorter time compared to the previous sulfide/Pt/gas equilibrium, and 12 hours was found to be enough to approach to the equilibrium. In order to assure of attaining the equilibrium, the reaction time was chosen to be 15 hours for this flux/sulfide/Pt/gas experiment.
After the equilibration, the lower end cap of the reaction tube was opened and the crucible assembly was directly dropped into ice water in order to quench the samples. Mn in the Pt foil was analyzed by Inductively Coupled Plasma (ICP) spectrometer. Concentrations of Mn, Ca, and S in the (Ca,Mn)S were measured by Electron Probe Micro Analysis (EPMA) on a JEOL 8100-JXA (Japan Electron Optics Ltd., Tokyo, Japan) in the Wavelength Dispersive Spectrometer (WDS) mode. Operating conditions were 15 kV accelerating voltage and 30 nA probe current. For standards, a CaSiO3 crystal for Ca and a MnS crystal for Mn and S were used, respectively. Data were refined using the ZAF correction routine. At least 5 to 10 analyses were made of each sample and averaged. When the CaO–MnO–Al2O3–S oxysulfide medium was used, it was also attempted to measure the composition of the oxysulfide liquid phase. However, it was extremely difficult to obtain the liquid phase frozen as is, and thus the quantitative analysis of the liquid phase was not successful.
2.3. Results
Figures 2(d) and 2(e) show micrographs of the sample of flux/sulfide/Pt/gas experiment, one near the alumina crucible and the other near the Pt foil. It is seen in Fig. 2(d) that a calcium aluminate (CaAl2O4) formed between the alumina crucible and the oxysulfide liquid phase, and this agrees with the result by Fukaya and Miki.28) Figure 2(e) shows a mixture of the sulfide solid, the oxysulfide liquid, and the Pt foil. Size of the (Ca,Mn)S sulfide solid phase was smaller (a few tens of μm) compared to the previous (Ca,Mn)S pellet (Fig. 2(b)), and it helped to obtain homogeneous concentration inside in a shorter time. Figure 2(f) shows a Mn concentration profile in the Pt foil along the thickness of the foil. Although perfect homogeneity could not be obtained even after 12 hours, the average concentration of Mn over the whole Pt foil appeared to be saturated, and this was also confirmed by the ICP analysis. As mentioned in Sec. 2.2, the equilibration time was set to be 15 hours, and the ICP result was taken as Mn concentration in the Pt foil for the activity calculation.
Activity of MnS in the (Ca,Mn)S solid solution was obtained using the Eq. (3) where
Δ
g
(
1
)
°
is obtained from FactSage18,19) FACT PS database (–169633 J/mol at 1400°C and –162747 J/mol at 1500°C), γ Mn in the Pt–Mn alloy from an equation by Kang et al.:29)
|
ln
γ
Mn(
bcc
)
=
-151 463
(
1-
X
Mn
)
2
-(
-18 476.5+1.33716T
)
8.314T
| (4) |
The obtained
aMnS is listed in the
Table 1, and is shown in
Fig. 3. It clearly shows a positive deviation from the ideality, and the deviation shows more positive than that of Gaterlier
et al.
24) It is reminded that the results of Gaterlier
et al. were obtained by estimation as mentioned in Sec. 2.1.
2.4. Thermodynamic Models and Calculation
The molar Gibbs free energy of the solid (Ca,Mn)S phase was modeled by assuming a random distribution of Ca2+ and Mn2+ in a cationic sublattice, although a finite interaction energy was assumed:
|
g=
X
CaS
g
CaS
°,s
+
X
MnS
g
MnS
°,s
+RT(
X
CaS
ln
X
CaS
+
X
MnS
ln
X
MnS
)
+
g
ex
| (5) |
where the molar excess Gibbs free energy is given as:
|
g
ex
=
L
Ca
2+
,
Mn
2+
:
S
2-
X
CaS
X
MnS
| (6) |
where
g°
,si is the standard molar Gibbs free energy of component
i,
gEx is the molar excess Gibbs energy, and
L
Ca
2+
,
Mn
2+
:
S
2-
is the interaction energy between Ca
2+ and Mn
2+ in the solid sulfide. The
g°
,sCaS was taken from JANAF thermochemical table
27) with a slight modification by the present authors,
14) and the
g°
,sMnS was taken from Mills,
30) respectively.
L
Ca
2+
,
Mn
2+
:
S
2-
is a model parameter representing the interaction between the Ca
2+ and the Mn
2+ in the (Ca,Mn)S phase. In order to best reproduce the miscibility gap data available in the literature
21,22,23) and the activity of MnS measured in the present study, the parameter was optimized in the form of Redlich-Kister type polynomial as:
|
L
Ca
2+
,
Mn
2+
:
S
2-
=24 476.4-0.4184T
+2 928.8(
X
CaS
-
X
MnS
)
[J/mol]
| (7) |
In order to take into account the asymmetry of the miscibility gap, a composition dependent term was introduced in the
L
Ca
2+
,
Mn
2+
:
S
2-
. Calculated activities of MnS using the optimized
L
Ca
2+
,
Mn
2+
:
S
2-
parameter at 1400°C and 1500°C are compared with the experimental data in
Fig. 3. Agreement between the calculation and the experimental data is generally good. Dashed lines represent calculated activity of MnS from the work of Lu
et al.,
25) who assumed a symmetrical miscibility gap.
The liquid phase in the CaS–MnS system was first assumed to be an ideal solution as a first approximation. Along with the Gibbs free energy of the (Ca,Mn)S solid phase, the phase diagram of the CaS–MnS system was calculated and is shown in Fig. 1 as dashed lines. The calculation agrees with the experimental data including liquidus, solidus, and miscibility gap. However, as will be discussed in Sec. 3.3, the ideal interaction between CaS and MnS in the liquid solution results in disagreement to a rather large extent between experimental data and the model calculation in the higher order system including Al2O3. Although details of a thermodynamic model and the parameter will be discussed in the Sec. 3.3, a positive interaction between CaS and MnS was introduced in order to obtain better agreement in the higher order system while the model calculation for the CaS–MnS binary system is kept not to deteriorate considerably. With the introduction of a positive interaction parameter in the liquid phase, the calculated phase diagram is shown in the Fig. 1 as solid lines. Agreement with the experimental data becomes slightly worse. However, this is a result of compromise to accommodate both the binary system and the higher order system in the same model. Previous model investigation by the one of the present authors for the calculation of sulfide capacities in CaO–MnO containing liquid slags assumed that interaction between Ca2+ and Mn2+ in the CaS–MnS binary liquid was zero.17,31) Introducing the positive interaction in the CaS–MnS binary liquid in the present study did not cause any significant change on the sulfide capacity calculations.
The calculated critical point of the miscibility gap is at XMnS = 0.40, Tcr = 1207°C, and the minimum of the liquidus is at XMnS = 0.90, Tmin = 1649°C. The present model calculation reflects the asymmetry in the (Ca,Mn)S solid solution. The asymmetry was reported to be common in several (Ca,Mn) chalcogenides (sulfide, selenide, and telluride).23)
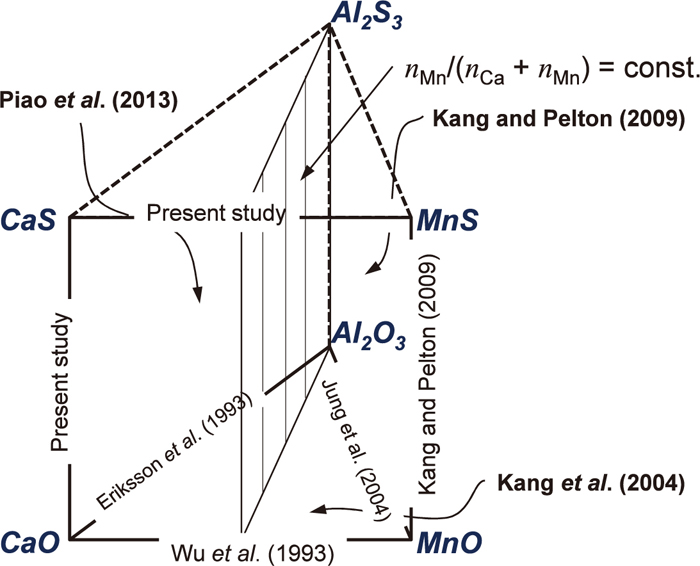
3. CaO–MnO–Al2O3–CaS–MnS–Al2S3 System
Neither phase diagram nor thermodynamic investigation has been reported in the CaO–MnO–Al2O3–CaS–MnS–Al2S3 system to the best knowledge of the present authors, except for the very recent investigation by Fukaya and Miki.28) Without Al in the system (CaO–MnO–CaS–MnS), no (experimental or theoretical) research results were found. Only a few thermodynamic modeling results are available in sub-binary and sub-ternary systems.
In the present study, it was attempted to develop a thermodynamic database in the CaO–MnO–Al2O3–CaS–MnS–Al2S3 system utilizing those available thermodynamic modeling results and a few of experimental data available in the literature. Figure 4 shows a schematic representation of the CaO–MnO–Al2O3–CaS–MnS–Al2S3 system in a prism, and also shows up-to-date available thermodynamic modeling results for sub-systems.
3.1. Thermodynamic Model Used for the Liquid Phase and Solid Phases
When dissolution of S in a liquid oxide is considered, the liquid phase becomes an oxysulfide. Pelton et al.32) developed a Modified Quasichemical Model (MQM) in the quadruplet approximation in order to model the Gibbs free energy of molten salt phase. Kang and Pelton17) used the MQM in the quadruplet approximation first to predict sulfide capacities of multicomponent slag systems, and obtained a successful result. In the model, very limited numbers of model parameters regarding S dissolution have been used. Detailed mechanism of S dissolution in the liquid oxide was discussed in the aid of the model by Kang and Park.31) The same model also has been successfully applied to the calculation of activity coefficient of sulfide,13,33) phase diagram,14,17) and two-phase liquid separation between oxide-rich and sulfide-rich liquids.34)
In the model, it is assumed that the oxysulfide consists of two distinctive sublattices; for example, for the CaO–MnO–Al2O3–CaS–MnS–Al2S3 system, (Ca2+, Mn2+, Al3+)x(O2–, S2–)y. Cations reside exclusively on the cationic sublattice, whereas anions reside exclusively on the anionic sublattice. Two important chemical reactions are considered in the model. The first is the reciprocal exchange reaction among the pure liquid components, such as:
|
CaO(
l
)
+
1/3Al
2
S
3
(
l
)
=CaS(
l
)
+
1/3Al
2
O
3
(
l
)
Δ
g
CaAl/OS
°,exchange
| (8) |
|
MnO(
l
)
+
1/3Al
2
S
3
(
l
)
=MnS(
l
)
+
1/3Al
2
O
3
(
l
)
Δ
g
MnAl/OS
°,exchange
| (9) |
|
MnS(
l
)
+CaO(
l
)
=MnO(
l
)
+CaS(
l
)
Δ
g
CaMn/OS
°,exchange
| (10) |
For those reactions, the Gibbs energy changes are considerably negative (at 1500°C, –173 kJ/mol for Reaction (8), –155 kJ/mol for Reaction (9), and –18.2 kJ/mol for Reaction (10), respectively), that strong First-Nearest-Neighbor (FNN) cation–anion Short-Range Ordering (SRO) in the liquid solution is expected. The other reaction that should be taken into account is the well-known strong Second-Nearest-Neighbor (SNN) SRO between cations over anions. This is taken into account by the following SNN pair exchange reactions:
|
(
Ca-O-Ca
)
+(
Al-O-Al
)
=2(
Ca-O-Al
)
Δ
g
CaAl/OO
| (11) |
|
(
Mn-O-Mn
)
+(
Al-O-Al
)
=2(
Mn-O-Al
)
Δ
g
MnAl/OO
| (12) |
|
(
Ca-O-Ca
)
+(
Mn-O-Mn
)
=2(
Ca-O-Mn
)
Δ
g
CaMn/OO
| (13) |
Similar SNN pair exchange reactions may also be considered for liquid sulfides for which O in the Reactions (11) to (13) are replaced by S:
|
(
Ca-S-Ca
)
+(
Al-S-Al
)
=2(
Ca-S-Al
)
Δ
g
CaAl/SS
| (14) |
|
(
Mn-S-Mn
)
+(
Al-S-Al
)
=2(
Mn-S-Al
)
Δ
g
MnAl/SS
| (15) |
|
(
Ca-S-Ca
)
+(
Mn-S-Mn
)
=2(
Ca-S-Mn
)
Δ
g
CaMn/SS
| (16) |
and common-cation systems such as:
|
(
O-Ca-O
)
+ (
S-Ca-S
)
=2(
O-Ca-S
)
Δ
g
CaCa/OS
| (17) |
However, as will be shown later, except for the Reactions (11) to (13) relevant to oxide systems, and for one additional Reaction (16) regarding the CaS–MnS binary system as mentioned in Sec. 2.4, all other possible SNN pair exchange reactions could be set to ideal (equivalent to set Δ
gij/kl = 0).
In order to treat both FNN and SNN SRO simultaneously, various quadruplet “clusters” that consist of two cations and two anions, such as CaCa/OO, CaAl/OO, CaAl/OS, AlAl/SS, etc. are considered as basic entities of the model. Therefore, there are total 18 different quadruplets in the CaO–MnO–Al2O3–CaS–MnS–Al2S3 system. These quadruplets are distributed randomly over “quadruplet” sites. A complete mathematical description of the model is given by Pelton et al.32) The Gibbs free energy of the solution is given by:
|
G=∑
i,j =
Ca
2+
,
Mn
2+
,
Al
3+
k, l =
O
2-
,
S
2-
n
ij/kl
g
ij/kl
-TΔ
S
config
| (18) |
where
nij/kl and
gij/kl are the number of moles and the molar Gibbs free energy of the
ij/
kl quadruplets, and Δ
Sconfig is the configurational entropy of mixing which is given by randomly distributing the quadruplets over the sublattices, taking into account the fact that anion-cation pairs are shared among quadruplets. Since the exact mathematical expression for such a distribution is not known, the configurational entropy is approximated by a cluster-variational equation as given elsewhere.
32) Taking into account SRO in modeling of solution is important in order to obtain better prediction in multicomponent solutions.
35) It should be noted that the model is reduced to the MQM in the pair approximation when one of the two sub lattices contains the same species.
The Gibbs free energies of all the quadruplets composed of Ca, Mn, Al, O and S can be evaluated from the Gibbs free energies of pure liquid components (CaO, MnO, Al2O3, CaS, MnS, and Al2S3), which constitute the Gibbs free energies of reciprocal exchange reactions such as shown in Reactions (8) to (10), and the Gibbs free energies of the SNN pair exchange reactions such as Reactions (11) to (17). Gibbs free energies of pure oxides and sulfides are available in previous articles.13,14,15,16,17) The Gibbs free energies of the SNN pair exchange reactions and coordination numbers of cations and anions are given in Table 2. Further details of the thermodynamic model were described in previous articles,17) thus will not be repeated here.
Table 2. Thermodynamic models and parameters used in the present study (J/mol).
| Monoxide s.s.: (Ca2+,Mn2+)(O2–) |
| Random mixing model | |
|
L
Ca
2+
,
Mn
2+
:
O
2-
=15 770
|
16) |
| Sulfide s.s.: (Ca2+,Mn2+)(S2–) |
| Random mixing model | |
|
L
Ca
2+
,
Mn
2+
:
S
2-
=24 476.4-0.4184T+2 928.8(
X
CaS
-
X
MnS
)
|
O |
| Liquid: (Ca2+,Mn2+,Al3+)x(O2–,S2–)y |
| Modified Quasichemical Model in the quadruplet approximation | |
|
Δ
g
Ca
2+
Mn
2+
/
O
2-
O
2-
=27 006
|
16) |
|
Δ
g
Ca
2+
Al
3+
/
O
2-
O
2-
=-121 164+27.196T
-(
353 674-115.060T
)
(
3
n
Al
3+
2
n
Ca
2+
+3
n
Al
3+
)
4
|
15) |
|
Δ
g
Mn
2+
Al
3+
/
O
2-
O
2-
=-6 426.79-35 761.1(
3
n
Al
3+
2
n
Mn
2+
+3
n
Al
3+
)
+62 222.3
(
3
n
Al
3+
2
n
Mn
2+
+3
n
Al
3+
)
6
|
3) |
|
Δ
g
Ca
2+
Mn
2+
Al
3+
/
O
2-
O
2-
=0
|
4) |
| (Toop-like interpolation, Al3+ is an asymmetric component) | |
|
Δ
g
Ca
2+
Mn
2+
/
S
2-
S
2-
=89 968-41.84T
|
O |
|
Δ
g
Ca
2+
Al
3+
/
S
2-
S
2-
=0
|
E, 14,17) |
|
Δ
g
Mn
2+
Al
3+
/
S
2-
S
2-
=0
|
E, 17) |
|
Δ
g
Ca
2+
Mn
2+
Al
3+
/
S
2-
S
2-
=0
|
|
| (Toop-like interpolation, Al3+ is an asymmetric component) | E |
|
Δ
g
Ca
2+
Ca
2+
/
O
2-
S
2-
=0
|
O |
|
Δ
g
Mn
2+
Mn
2+
/
O
2-
S
2-
=0
|
17) |
|
Δ
g
Al
3+
Al
3+
/
O
2-
S
2-
=0
|
E,14, 17) |
|
Δ
g
ij/kl
=0
(i, j = Ca2+, Mn2+, Al3+; k, l = O2–, S2–; i ≠ j, k ≠ l) |
E,14, 17) |
|
Z
Ca
2+
=
Z
Ca
2+
=1.3774,
Z
Al
3+
=2.0661,
Z
O
2-
=
Z
S
2-
=1.3774, ζ=1
|
17 |
O: optimized in the present study, E: estimated in the present study.
The thermodynamic model for the solid (Ca,Mn)S phase was already described in Sec. 2.4. A monoxide solid solution (Ca,Mn)O was modeled by a regular solution model by Wu et al.16) All other solid phases were described as stoichiometric compounds whose Gibbs free energies are only functions of temperature. Those compounds were only known in binary oxide systems (CaO–Al2O3 and MnO–Al2O3), and details of their Gibbs free energies can be found in elsewhere.3,15)
3.2. CaO–MnO–CaS–MnS System
In this sub-system, the liquid phase may be described with the formula (Ca2+,Mn2+)(O2–,S2–) in the framework of the MQM in the quadruplet approximation. The already calculated CaS–MnS binary phase diagram as described in Sec. 2.4. is shown in Fig. 5(a).
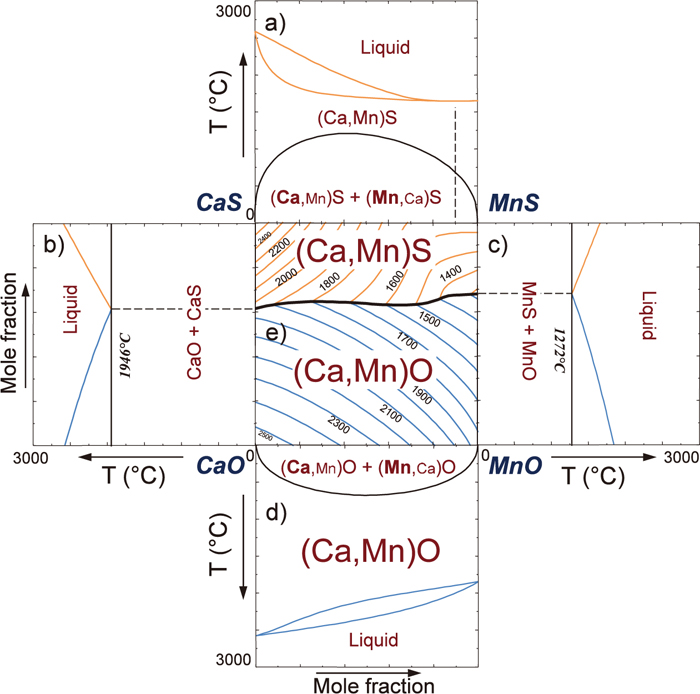
Figure 5(b) shows a calculated phase diagram of the CaO–CaS binary system. For this system, only very limited experimental information has been known. According to Koch et al.,36) a eutectic reaction L → CaS + CaO occurs at 1950°C. Also it was reported that solid CaO and solid CaS show almost negligible mutual solubilities.37,38) Thus, the CaO–CaS system is represented as a simple eutectic system. In the present study, the solid CaO and the solid CaS were assumed to be stoichiometric compounds, and the liquid phase was assumed to be an ideal solution (equivalent to set ΔgCaCa/OS = 0). The Gibbs free energy of solid CaO (g°,sCaO) is taken from Wu et al.16) Under the assumption of the ideal mixing between O2– and S2– in the anionic sublattice in the CaO–CaS binary liquid, the predicted eutectic temperature is 1946°C, which is very close to the reported eutectic temperature (1950°C). This is also consistent with the thermodynamic description used for calculations of sulfide capacities in CaO-containing liquid slags, where the interaction between O2– and S2– in the CaO–CaS binary liquid was zero.14,17,31) Therefore, in the present study, it was decided that the CaO–CaS liquid oxysulfide solution behaves an ideal solution.
Figures 5(c) and 5(d) show calculated phase diagrams of MnO–MnS and CaO–MnO binary systems reported by Kang and Pelton,17) and Wu et al.,16) respectively. The MnO–MnS phase diagram looks very similar to that of the CaO–CaS phase diagram, and the CaO–MnO phase diagram looks also very similar to that of the CaS–MnS system. It can be seen that miscibility gap in the CaO–MnO system (critical point at XMnO = 0.5, Tcr = 675°C) is smaller than that in the CaS–MnS system. According to Wu et al.,15) the CaO–MnO solid solution was modeled using the regular solution model. The binary CaO–MnO liquid exhibits slight positive deviation (ΔgCaMn/OO = 27006 J/mol). Similar but more positive deviation from ideality is seen in the CaS–MnS binary system as shown in Fig. 5(a) and Sec. 2.
By combining the Gibbs free energy descriptions of all sub-binary systems in the framework of the MQM in the quadruplet approximation, the Gibbs free energy of the (Ca2+,Mn2+)(O2–,S2–) reciprocal ternary liquid solution is obtained. Along with the Gibbs free energy of the (Ca,Mn)S solid phase obtained in the present study and that of the (Ca,Mn)O solid phase reported by Wu et al.,16) a complete liquidus projection of the CaO–MnO–CaS–MnS system was calculated and is shown in Fig. 5(e). The liquidus projection is governed by the primary phase fields of the two solid solutions, the (Ca,Mn)O and the (Ca,Mn)S.
3.3. CaO–MnO–Al2O3–CaS–MnS–Al2S3 System
3.3.1. Previous Thermodynamic Modeling of Sub Systems Including Al2O3/Al2S3
Thermodynamic modeling of sub-binary oxide systems (CaO–Al2O3, MnO–Al2O3, and CaO–MnO) were reported by Eriksson et al.,15) Jung et al.,3) and Wu et al.,16) respectively. All of them used the MQM in the pair approximation for liquid phase. Relevant literature data were critically evaluated in the articles. The Gibbs free energies of several calcium aluminate (Ca3Al2O6, CaAl2O4, CaAl4O7, and CaAl12O19) can be found elsewhere.15)
By merging these thermodynamic descriptions, the CaO–MnO–Al2O3 ternary system was previously modeled by Kang et al.4) In this system, experimental data was very scarce, and only activity data was available in literature.39,40) Therefore, phase diagram of the ternary system was predicted by the thermodynamic model, justified on a good agreement between the reported activity data and the calculation.
Regarding S containing sub-systems, the CaO–Al2O3–CaS–Al2S3 system was modeled using the MQM in the quadruplet approximation for the liquid phase by the present authors.14) The MnO–Al2O3–MnS–Al2S3 system was also modeled using the same model for the liquid phase by the Kang and Pelton17) for which a liquidus projection (MnO–Al2O3–MnS part) calculated from the thermodynamic model is shown in Fig. 6.
3.3.2. Model Calculations
By combining the Gibbs free energy descriptions of all sub-binary systems described in the previous sections in the framework of the MQM in the quadruplet approximation, the Gibbs free energy of the (Ca2+,Mn2+,Al3+)x(O2–,S2–)y oxysulfide liquid solution is obtained. Along with the Gibbs free energy of the (Ca,Mn)S sulfide phase described in Sec. 2.4 as well as those of all other solid phases, distribution of Mn between the (Ca,Mn)S sulfide phase and the oxysulfide liquid solution saturated by CaAl2O4 phase was calculated at various temperatures. The calculated results are shown in Fig. 7 as solid lines. Here, concentrations both in the oxysulfide liquid phase and the sulfide phase are expressed as nMn/(nCa + nMn), thus it shows effect of replacement between Ca and Mn in the liquid oxysulfide phase. The calculations are compared with the experimental data by Fukaya and Miki.28) Although noticeable experimental scatters are seen, both experimental results and calculations show that increasing Mn concentration in the sulfide solid solution increases Mn concentration in the oxysulfide liquid solution, and such tendency becomes stronger as temperature decreases. However, it is not clear from the experiment whether the increase of Mn in the liquid oxysulfide phase is associated with O or with S. Therefore, the S concentration in the liquid oxysulfide solution (nS/(nCa + nMn)) is plotted as a function of Mn concentration in the liquid oxysulfide solution in Fig. 8. The S concentration is seen to increases as the Mn concentration increases. It is thought that Al in the liquid does not associated with S to a high extent when the liquid contains Mn or Ca.13,14) Therefore, if the S concentration at nMn/(nCa + nMn) = 0 is considered as the S associated with Ca almost exclusively, then excess S when nMn/(nCa + nMn) increases can be considered to that associated with Mn. According to Fukaya and Miki,28) the S concentration is not sensible to temperature, while the present thermodynamic calculation shows slight increase of the S concentration as temperature increases. It has been usually observed that sulfide capacity and solubility limit of solid sulfide in liquid oxysulfide phase increase as temperature increases.14,17) Therefore, the calculated temperature dependency of the S concentration seems not strange, though it still requires further investigation in order to resolve this discrepancy.
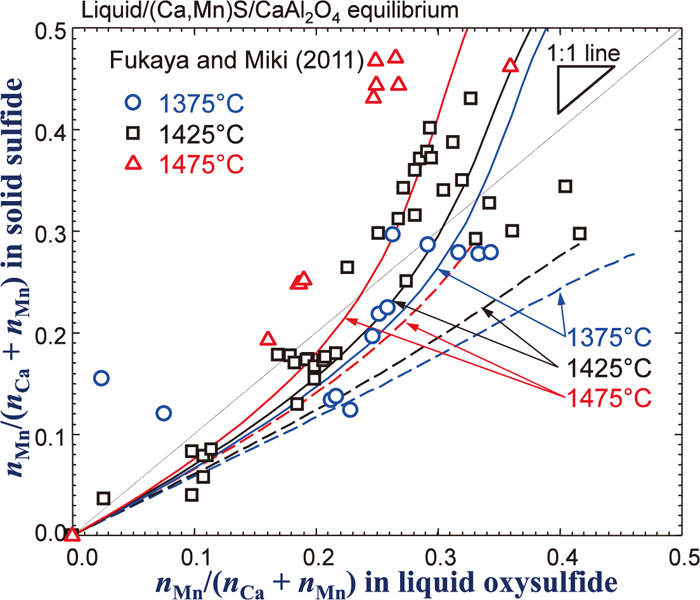
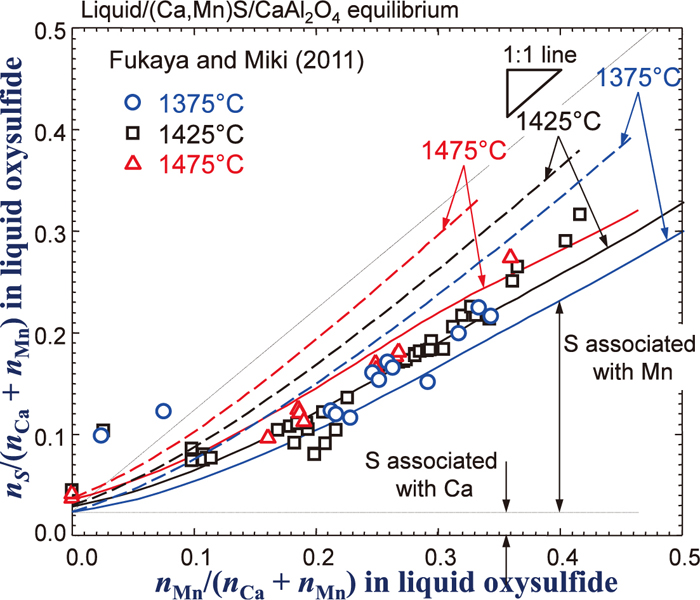
As mentioned in Sec. 2.4, a positive interaction between CaS and MnS in the liquid phase was introduced. Dashed lines shown in the Figs. 7 and 8 are corresponding calculations assuming the ideal mixing between CaS and MnS in the liquid phase. As can be seen in the figures, the calculations are not in good agreement with the experimental data. As Ca2+ and Mn2+ cations exhibit positive deviation from ideality which has been reported in (Ca,Mn)O solid, (Ca,Mn)S solid, several (Ca,Mn) solid chalcogenides (selenide, and telluride),23) and liquid CaO–MnO,16) it is likely to have a similar positive interaction between the Ca2+ and Mn2+ cations in the liquid sulfide solution. In fact, other available model parameters were also tested in order to check whether it could improve the agreement between the experimental data and the model calculation. However, all other possible attempts were not in success. Only introduction of the positive interaction between the CaS and MnS was successful. It results in better agreement in Figs. 7 and 8, although a worse agreement was obtained in the phase diagram calculation shown in Fig. 1. In the present study, more weight is given in the experimental data in Figs. 7 and 8.
4. Discussions
Behavior of activities of oxide components such as MnO and CaO in the liquid oxysulfide solution may draw some interest. Since the oxysulfide liquid solution was in equilibrium with the (Ca,Mn)S solid solution,28) the following reaction may be considered:
|
MnS(
s
)
+CaO(
l
)
=MnO(
l
)
+CaS(
s
)
; Δ
g
(
19
)
°
| (19) |
|
a
MnO(
l
)
a
CaS(
s
)
a
CaO(
l
)
a
MnS(
s
)
=
K
(
19
)
=exp(
-
Δ
g
(
19
)
°
RT
)
| (20) |
By
Eqs. (5) to
(7), it is possible to calculate activities of CaS and MnS (with respect to pure solid CaS and MnS):
|
a
CaS
=
exp(
X
MnS
2
(
24 476.4 - 0.4184T + 2 928.8(
X
CaS
-3
X
MnS
)
)
RT
)
X
CaS
| (21) |
|
a
MnS
=
exp(
X
CaS
2
(
24 476.4 - 0.4184T + 2 928.8(
3
X
CaS
-
X
MnS
)
)
RT
)
X
MnS
| (22) |
Using the above equations, the activities of CaS and MnS can be calculated at each (Ca,Mn)S solid concentration of Fukaya and Miki.
28) Also from
Fig. 7, concentration of liquid oxysulfide solution in equilibrium with the solid sulfide phase/CaAl
2O
4 can be obtained. Therefore, it is now possible to calculate the ratio of activities of MnO and CaO (with respect to pure liquid CaO and MnO) as:
|
a
MnO(
l
)
a
CaO(
l
)
=
K
(
19
)
a
MnS(
s
)
a
CaS(
s
)
| (23) |
as a function of composition of the liquid phase. The
Δ
g
(
19
)
°
is calculated from Gibbs free energies of the products and the reactants in the Reaction (19) taken from References,
14,16,30) and is shown in
Table 3. The calculated activity ratio of the oxide components estimated from the data of Fukaya and Miki
28) is shown in
Fig. 9. It is seen that even a small portion of Mn in the liquid oxysulfide results in higher
aMnO relative to
aCaO. The observed high
aMnO over
aCaO is attributed to the large negative Gibbs free energy of the Reaction (19), shifting the reaction to right hand side. Solid lines in the figure are predicted
aMnO/
aCaO from the present thermodynamic models for the same conditions, while dashed lines are calculated activity ratio of
aCaS/
aMnS in the sulfide solid solution at the same condition. A good agreement is obtained, and it suggests that the present thermodynamic modeling is made available to calculate any kinds of thermodynamic calculation including phase diagrams, activities, element distribution among phases,
etc.
Table 3. Gibbs energies of the Reactions (1) and (16) used in the present study.
14,16,19,30)| T (°C) | Δg° (J/mol) | K | Reaction |
|---|
| 1400 | –169618 | 1.98×10⁵ | Mn(bcc) + 1/2S2 (g) = MnS(s) |
| 1500 | –162733 | 6.23×10⁴ |
| 1375 | –31191 | 9.74 | MnS(s) + CaO(l) = MnO(l) + CaS(s) |
| 1425 | –30922 | 8.94 |
| 1475 | –30655 | 8.24 |
As an example, phase diagram of the present CaO–MnO–Al2O3–CaS–MnS–Al2S3 system, which is usually not available in literatures, can be calculated using the thermodynamic model developed in the present study. Figure 10 shows predicted isothermal-isoplethal sections of the CaO–MnO–Al2O3–CaS–MnS–Al2S3 system at 1500°C where the ratio nMn/(nCa + nMn) varies from 0 (CaO–Al2O3–CaS–Al2S3 system) to 1 (MnO–Al2O3–MnS–Al2S3 system) shown as shaded section in Fig. 4. Because the present system is a multicomponent reciprocal molten ionic system where various valences (2 for Ca2+ and Mn2+, 3 for Al3+, –2 for O2– and S2–) exist, such phase diagram can only be drawn when electrical neutrality condition is satisfied:
|
2
n
Ca
+2
n
Mn
+3
n
Al
=2
n
O
+2
n
S
| (24) |
where
ni is the number of moles of an ion
i. The horizontal axis showing replacement of Ca and Mn by Al is thus represented by 3
nAl / (2
nCa + 2
nMn + 3
nAl), while the other axis showing replacement of O by S is represented by the following relationship:
nS / (
nO +
nS) = 2
nS / (2
nO + 2
nS) = 2
nS / (2
nCa + 2
nMn + 3
nAl), having the same denominator in the calculation. This is a kind of equivalent fraction frequently used in molten salt chemistry.
41) As complete phase diagram information would make the figures too complicated, thus only liquidus lines at each section (each
nMn/(
nCa +
nMn)) along with saturated solid phases are shown. Conditions employed in the work of Fukaya and Miki
28) (liquid oxysulfide simultaneously saturated by sulfide solution and CaAl
2O
4) correspond to the dashed line shown in the figure. As
nMn/(
nCa +
nMn) increases, homogeneous liquid region expands, mainly due to decrease of melting temperature of (Ca,Mn)S and (Ca,Mn)O solid phases.
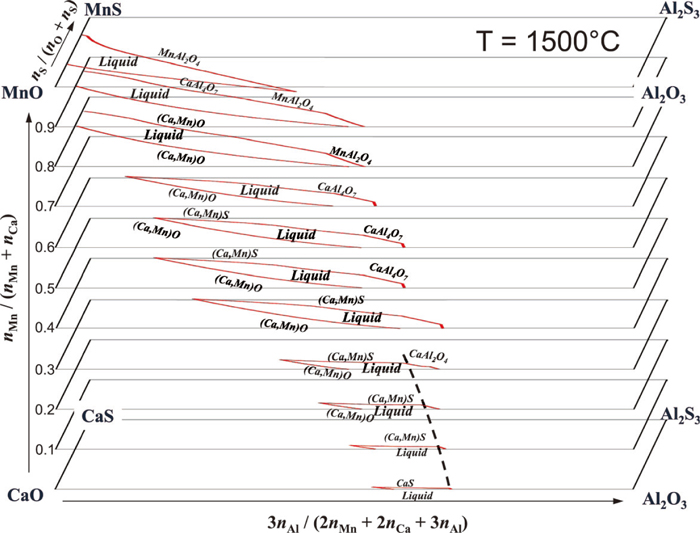
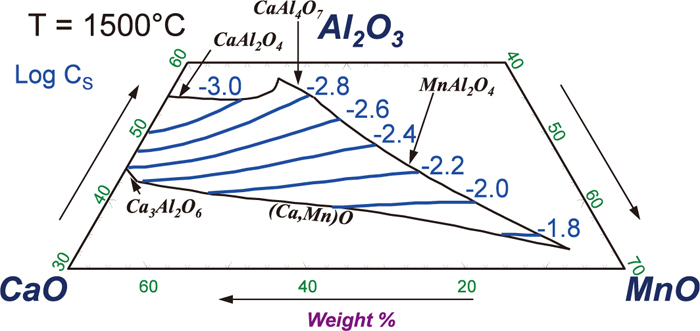
Finally, the present thermodynamic model was also applied to predict sulfide capacity (CS) of the CaO–MnO–Al2O3 ternary slag at low S concentration as shown in Fig. 11. To the best knowledge of the present authors, no experimental data has been reported. As the present thermodynamic model for the liquid oxysulfide has shown very good prediction ability in the calculation of sulfide capacity of multicomponent slags,17) it is believed that the predicted sulfide capacity in the Fig. 11 is the best estimate at present. The calculated iso-CS lines show a clock-wise rotation in such a way that at relatively high Al2O3 concentration (> ~ 40 mass pct.) replacing CaO by MnO increases the CS, while at relatively low Al2O3 concentration (< ~ 40 mass pct.), replacing CaO by MnO does not increase CS. Although no experimental work was carried out in this particular system, Park et al.42) observed similar a clock-wise rotation of sulfide capacity in the CaO–MnO–SiO2 slags by experiment, and the mechanism was reasonably well explained by one of the present authors using the MQM in the quadruplet approximation.31) As the similar modeling approach has been used in the present study for the S dissolution in CaO–MnO–Al2O3 slag, it is expected that the predicted clock-wise rotation of the iso-CS lines is likely to reflect the reality. Further experimental confirmation may be suggested.
5. Conclusions
In order to provide a tool for the prediction of sulfide/oxide/oxysulfide inclusions in steel, experiment and thermodynamic modeling for the inclusion systems were carried out. The CaO–MnO–Al2O3–CaS–MnS–Al2S3 oxysulfide system was considered as the inclusion system.
Activity of MnS in the (Ca,Mn)S solid solution system was measured using chemical equilibration technique. The (Ca,Mn)S solid solution exhibited a positive deviation from the ideality, which is consistent with phase diagram showing a miscibility gap. Using the activity data obtained in the present study and the phase diagram data available in the literature, a thermodynamic modeling and a database development for the CaS–MnS binary system were carried out. The following excess Gibbs free energy between CaS and MnS (or Ca2+ and Mn2+ in a sulfide rock salt structure) was obtained.
|
g
ex
=
X
CaS
X
MnS
(
24 476.4-0.4184T
+2 928.8(
X
CaS
-
X
MnS
)
) [J/mol]
| (24) |
The obtained parameter can be used to calculate not only the phase equilibria involving the (Ca,Mn)S solid sulfide solution, but also the activity of components. The latter would be useful to predict the sulfide inclusion composition in the steel.
The thermodynamic modeling was further extended to CaO–MnO–Al2O3–CaS–MnS–Al2S3 oxysulfide system in which the (Ca,Mn)S solid sulfide solution and liquid oxysulfide solution composed of CaO–MnO–Al2O3–CaS–MnS–Al2S3 can be regarded as the non-metallic inclusion in the steel.
By coupling the presently developed database with other evaluated databases for metallic solutions, gases, etc., complex metal/solid/gas equilibria can be computed, in particular for the inclusion evolution in steel.
References
- 1) Y. Sahai and T. Emi: Tundish Technology for Clean Steel Production, World Scientific Publishing Co., Singapore, (2008), 17.
- 2) J. Takamura and S. Mizoguchi: Proc. 6th Iron Steel Cong., ISIJ, Tokyo, (1990), 591.
- 3) I.-H. Jung, Y.-B. Kang, S. A. Decterov and A. D. Pelton: Metall. Mater. Trans. B, 35B (2004), 259.
- 4) Y.-B. Kang, I.-H. Jung, S. A. Decterov, A. D. Pelton and H.-G. Lee: ISIJ Int., 44 (2004), 965.
- 5) Y.-B. Kang, I.-H. Jung, S. A. Decterov, A. D. Pelton and H.-G. Lee: ISIJ Int., 44 (2004), 975.
- 6) I.-H. Jung, S. A. Decterov and A. D. Pelton: J. Phase Equil. Diff., 25 (2004), 329.
- 7) I.-H. Jung, S. A. Decterov and A. D. Pelton: ISIJ Int., 44 (2004), 527.
- 8) Y.-B. Kang and H.-G. Lee: ISIJ Int., 44 (2004), 1006.
- 9) Y.-B. Kang and H.-G. Lee: ISIJ Int., 50 (2010), 501.
- 10) D.-H. Woo: PhD Thesis, Pohang University of Science and Technology, Rep. of Korea, (2010), 63.
- 11) D.-H. Woo, Y.-B. Kang, H. Gaye and H.-G. Lee: ISIJ Int., 49 (2009), 1490.
- 12) D.-H. Woo and H.-G. Lee: J. Am. Ceram. Soc., 93 (2010), 2098.
- 13) Y.-J. Kim, D.-H. Woo, H. Gaye, H.-G. Lee and Y.-B. Kang: Metall. Mater. Trans. B, 42B (2011), 535.
- 14) R. Piao, H.-G. Lee and Y.-B. Kang: Acta Mater., 61 (2013), 683.
- 15) G. Eriksson and A. D. Pelton: Metall. Trans. B, 24B (1993), 807.
- 16) P. Wu, G. Eriksson and A. D. Pelton: J. Am. Ceram. Soc., 76 (1993), 2065.
- 17) Y.-B. Kang and A. D. Pelton: Metall. Mater. Trans. B, 40B (2009), 979.
- 18) C. W. Bale, P. Chartrand, S. A. Degterov, G. Eriksson, K. Hack, R. Ben Mahfoud, J. Melançon, A. D. Pelton and S. Petersen: Calphad, 26 (2002), 189.
- 19) C. W. Bale, E. Bélisle, P. Chartrand, S. A. Decterov, G. Eriksson, K. Hack, I.-H. Jung, Y.-B. Kang, J. Melançon, A. D. Pelton, C. Robelin and S. Petersen: Calphad, 33 (2009), 295.
- 20) W. J. M. Salter and F. R. Pickering: J. Iron Steel Inst., 207 (1969), 992.
- 21) R. Kiessling and C. Westman: J. Iron Steel Inst., 208 (1970), 699.
- 22) B. J. Skinner and F. D. Luce: Am. Mineral., 56 (1971), 1269.
- 23) C. H. Lueng and L. H. Van Vlack: J. Am. Ceram. Soc., 62 (1979), 613.
- 24) C. Gatellier, H. Gaye, J. Lehmann, J. N. Pontoire and F. Castro: Proc. of Steelmaking Conf., ISS, Warrendale, PA, (1991), 827.
- 25) D.-Z. Lu, G. A. Irons and W.-K. Lu: Ironmaking Steelmaking, 18 (1991), 342.
- 26) A. Levy: J. Sci. Instrum., 33 (1964), 449.
- 27) M. Chase: NIST-JANAF Thermochemical Tables – Part I, 4th ed., NIST, Gaithersburg, MD, (1998), 733.
- 28) H. Fukaya and T. Miki: ISIJ Int., 51 (2011), 2007.
- 29) Y.-B. Kang, I.-H. Jung and H.-G. Lee: Calphad, 30 (2006), 235.
- 30) K. C. Mills: Thermodynamic Data for Inorganic Sulphides, Selenides and Tellurides, Butterworths, London, (1974), 424.
- 31) Y.-B. Kang and J. H. Park: Metall. Mater. Trans. B, 42B (2011), 1211.
- 32) A. D. Pelton, P. Chartrand and G. Eriksson: Metall. Mater. Trans. A, 32A (2001), 1409.
- 33) S.-J. Kim, H. Shibata, J. Takekawa, S.-Y. Kitamura, K. Yamaguchi and Y.-B. Kang: Metall. Mater. Trans. B, 43B (2012), 1069.
- 34) Y. Jo, H.-G. Lee and Y.-B. Kang: ISIJ Int., 53 (2013), 751.
- 35) Y.-B. Kang and A. D. Pelton: Calphad, 34 (2010), 180.
- 36) K. Koch and G. Trömel: Arch. Eisenhüttenwes., 48 (1977), 133.
- 37) E. R. Turkdogan, B. B. Rice and J. V. Vinters: Metall. Trans., 5 (1974), 1527.
- 38) G. J. W. Kor and F. D. Richardson: Trans. Inst. Min. Metall. Sec. C, 79 (1970), C148.
- 39) S. R. Mehta and F. D. Richardson: J. Iron Steel Inst., 203 (1965), 524.
- 40) K. Morita, M. Miwa and M. Ohta: Proc. of 2nd Int. Cong. on the Sci. and Tech. of Steelmaking, Institute of Metals, London, (2001), 593.
- 41) M. Blander: Molten Salt Chemistry, John and Wiley and Sons, Inc., Easton, PA, (1964), 136.
- 42) G. H. Park, Y. B. Kang and J. H. Park: ISIJ Int., 51 (2011), 1375.