Regular Article
Effects of Diffusible Hydrogen on Fatigue Life of Spot Welds in High-tensile-strength Steel Sheets

2023 年 63 巻 5 号 p. 889-898
詳細
2023 年 63 巻 5 号 p. 889-898
Spot-welded advanced high-strength steel (AHSS) sheets are used to decrease car body weight and enhance crashworthiness simultaneously. Such welds are susceptible to hydrogen embrittlement, but research in this area is limited. We have evaluated the hydrogen embrittlement properties of spot welds fabricated with AHSS sheets and clarified the dependence of diffusible hydrogen content and tensile rate on tensile shear strength. However, the performance of spot welds must be evaluated not only by static testing such as tensile shear tests but also by dynamic fatigue testing. Herein, we investigated the effects of diffusible hydrogen on their fatigue life via tensile–shear fatigue tests under cathodic hydrogen charging. The number of cycles to failure and the endurance limit decreased with diffusible hydrogen content. The number of cycles to failure decreased as the constant amplitude-loading frequency declined. The intergranular cracking is more likely to occurs as the amount of diffusible hydrogen increases and as the frequency decreases. These results are explained by hydrogen accumulation and crack growth behavior caused by mechanism for hydrogen-enhanced local plasticity and hydrogen enhancement of the strain-induced generation of vacancies mechanism. Furthermore, the correlation between static testing and dynamic fatigue testing was investigated, and the relationship between fatigue strength and the amount of diffusible hydrogen was in good agreement with the diffusible hydrogen dependence of tensile shear strength obtained from slow rate tensile shear tests under hydrogen charging.
To make vehicles lighter, high-tensile-strength (>980 MPa) steel sheets and hot stamping material are being used for vehicle body parts.1) When the body is manufactured, each part must be joined; spot welding, which is inexpensive and highly productive, is widely used for this purpose. Therefore, the spot welding of high-tensile-strength steel sheets is likely to increase. Hardness increases at spot welds compared to the base metal.2) Because rapid solidification occurs during spot welding, quenched martensite structures are produced even in steel sheets with relatively low tensile strength. The hydrogen embrittlement susceptibility of steel generally increases with hardness;3) thus, hydrogen embrittlement is also a concern for spot welds.
Many material tests have been used to investigate the hydrogen embrittlement mechanism and assess hydrogen embrittlement and thus to promote the use of high-tensile-strength steel sheets.4,5,6,7,8,9,10,11,12,13,14,15) The U-bend test4,5,6,7) is an assessment method that considers the influence of process strain, which is commonly used, on sheet materials. The evaluation of the hydrogen embrittlement of materials, which is similar to the assessment of high-strength bolts,8) can be performed using the four-point bending test9,10) and three tensile tests: the slow strain rate technique,11,12) conventional strain rate technique,11,13) and constant load test.11,14,15) Each method has advantages and disadvantages. Though there is no consensus on the ideal test method for assessing steel sheets, the differences between the results of each method11) and the factors that dominate hydrogen embrittlement, such as the diffusible hydrogen content, dislocations, and accumulation of hydrogen,16) are becoming clearer. However, few studies have assessed the hydrogen embrittlement of spot welds in high-tensile-strength steel sheets and the mechanism of hydrogen embrittlement.17,18,19) In a previous study,19) we used the tensile shear test, which is used to evaluate the strength of spot welds, to assess the hydrogen embrittlement of spot welds in high-tensile-strength steel sheets and reported the results of introducing diffusible hydrogen under a cathodic charge. The results showed that as the diffusible hydrogen content of the test specimens increased, the tensile shear strength decreased. The fracture morphology showed that cracks began at the nugget edge, where stress was concentrated. Intergranular fracture surfaces and quasi-cleavage fracture surfaces were observed where cracks occurred. Furthermore, as in the assessment of steel sheets, the hydrogen embrittlement susceptibility was higher at low tensile speeds in a displacement-controlled test. Thus, the results revealed many similarities with the hydrogen embrittlement mechanism of steel sheets.
In the assessment of spot welds, in addition to static tests such as the tensile shear test, dynamic tests such as impact and fatigue tests are necessary. In a fatigue test, repeated loads cause dislocation motion, increasing the dislocation density and vacancy formation.20) During hydrogen embrittlement, the association between diffusible hydrogen and dislocation motion is strong; thus, the influence of diffusible hydrogen on the fatigue properties is clear.21,22,23) Furthermore, regarding the fatigue properties of welded parts, the effect of diffusible hydrogen on crack propagation in laser-welded stainless steel24,25) and friction-stir-welded pipe materials26) has been reported; it was found that diffusible hydrogen promotes crack propagation. The effect of diffusible hydrogen on the fatigue properties, which we consider in this study, is expected to be important; however, this subject has not been investigated.
Therefore, in this study we assessed the effect of the diffusible hydrogen content on the cycles to failure, fatigue limit, and fracture surface of spot welds in high-tensile-strength steel sheets using the tensile shear fatigue test (fatigue test hereafter). In addition, we used test specimens that are commonly used in a static test, the tensile shear test;19) we compare the results of these two tests and report on the differences.
Our samples were martensite steel sheets with a tensile strength class of 1500 MPa, which were also used in the previous study.19) Tables 1 and 2 show the mechanical properties and chemical compositions of these materials, respectively.
| Tensile strength | Young’s modulus | Fracture elongation |
|---|---|---|
| 1510 MPa | 199 GPa | 6.7% |
| C | Si | Mn | P | S | Cr | Al | Ti | V | Nb | Fe |
|---|---|---|---|---|---|---|---|---|---|---|
| 0.17 | 0.49 | 1.58 | 0.010 | 0.002 | 0.03 | 0.042 | 0.005 | 0.008 | 0.013 | Bal. |
Figure 1 shows the specimen shape. Steel sheets with a width of 30 mm, height of 60 mm, and thickness of 1.2 mm were overlapped to make this shape. Using a chrome–copper alloy electrode with a tip diameter of 6 mm, we joined them by resistance spot welding. Spot welding was performed at a pressing force of 3.5 kN and current of 5 kA for 60 ms. When we prepared the test specimens under these conditions, the nugget diameter became 3.1 mm. The metallographic structure of the nuggets and heat-affected areas was lath martensite.19) For the hydrogen charging discussed below, a lead wire was spot-welded to the chuck edge of the test specimens, and areas other than the welded part (gray region labeled “a” in Fig. 1) were masked to prevent hydrogen penetration and corrosion.

Schematic of the specimen. The gray-colored area of the specimen is hydrogen charged.
To assess the effect of diffusible hydrogen on the fatigue properties of spot welds on high-tensile-strength steel sheets, we performed a fatigue test under hydrogen charging using a cathodic charge. The details of the experimental conditions are provided below.
2.2.1. Hydrogen Charging ConditionsHydrogen charging was performed before and during the test. Before the test, hydrogen charging was performed without a load for 24 h. During the test, we performed hydrogen charging to avoid hydrogen desorption. The hydrogen charging conditions are shown in Table 3. Condition A was used for comparison with the hydrogen charging conditions; thus, the test was performed in atmosphere at room temperature (23 ± 2°C) without hydrogen charging. For conditions B to E, cathodic hydrogen charging was performed according to the previous report.19) We employed two methods. In one, the test specimens were immersed in a 0.1 M NaOH aqueous solution and potentiostatically polarized at 1 V vs. Ag/AgCl (condition B). In the other method, test specimens were immersed in a 3% NaCl aqueous solution with 0–3 g/L of ammonium thiocyanate (NH4SCN), which was added as a hydrogen recombination poison, and constant-current polarized at a current density of 1 mA/cm2 (conditions C, D, and E). For potentiostatic and constant-current polarization, we used a potentiostat (HA-151B, Hokuto Denko Corporation). As discussed below, we introduced diffusible hydrogen in a wide range of concentrations (0.001 mass ppm to 1 mass ppm) by varying the type of solution, NH4SCN concentration, and cathodic electrolysis method (potentiostatic or constant-current). We applied hydrogen charging to the unmasked part of the test specimens, that is, the spot welds and the steel sheet around the spot welds (with an area of 18 cm2). The amount of aqueous solution was 1 L.
| Condition | Base solution | Ammonium thiocyanate content (g/L) | Hydrogen charging method | |
|---|---|---|---|---|
| A | – | – | Air | |
| B | 0.1 M NaOH | 0 | Constant potential | 1 V vs. Ag/AgCl |
| C | 3% NaCl | 0 | Constant current | 1 mA/cm2 |
| D | 3% NaCl | 0.3 | Constant current | 1 mA/cm2 |
| E | 3% NaCl | 3 | Constant current | 1 mA/cm2 |
We used fatigue testing to assess the fatigue properties when hydrogen was absorbed via hydrogen charging. The test equipment was an electrohydraulic servo fatigue testing machine (EHF-ED520L, Shimadzu Corporation). Figure 2 shows a schematic illustration of the test equipment, which includes a water tank that allows hydrogen charging, a Pt counter electrode, and a jig that holds the Ag/AgCl reference electrode and test specimen. A test specimen (Fig. 1) was placed in the equipment. and diffusible hydrogen was introduced by hydrogen charging. At a load ratio (minimum load/maximum load) of 0.1, we applied mainly a sinusoidal load with a frequency of 20 Hz. Failure was defined as the point at which cracks from the nugget edge reached the steel sheet surface, where the observed crack length on the steel sheet surface was nearly 3 mm, or the upper limit load decreased rapidly. To confirm changes in the cycles to failure when the frequency was varied within a range of 2–20 Hz, we performed the test under hydrogen charging (condition D) with the load amplitude ΔL fixed at 0.675 kN. In the test with NH4SCN added to the aqueous solution, where it took three days or longer to fail, the test was performed using an aqueous solution with lower pH; consequently, corrosion occurred and discolored the test specimens. However, there was no morphological change that could have caused pits on the surface. Fatigue tests under hydrogen charging conditions were also performed at room temperature (23 ± 2°C). To prevent the desorption of diffusible hydrogen, test specimens were immediately cut when hydrogen charging stopped and were stored in liquid nitrogen.

Schematic of tensile–shear fatigue testing equipment.
We conducted a hydrogen analysis to quantify the diffusible hydrogen content of the test specimens stored in liquid nitrogen. Considering the detection limit of the hydrogen analysis apparatus, specimens including the spot weld were cut to dimension of 7 mm × 30 mm × 30 mm. A gas chromatography/hydrogen temperature-programmed desorption analyzer (SGHA-P2/NISSHA FIS) was used for hydrogen analysis. We heated specimens at 2°C/min in Ar atmosphere at a flow rate of 400 cc/min and obtained temperature-programmed desorption spectra. We integrated the peaks in this spectrum between room temperature (23 ± 2°C) and 150°C to obtain the diffusible hydrogen content.
2.2.4. Fracture Surface ObservationWe used scanning electron microscopy (SEM, S-3600N/Hitachi High‑Technologies Corporation) to observe the fracture surface. To observe the entire fracture surface of specimens and identify fracture surfaces that are typical of hydrogen embrittlement (grain boundary and quasi-cleavage fracture surfaces), we made observations at a magnification of 1000×. Before observing the fracture surfaces of the specimens, we washed the specimens in acetone using an ultrasonic cleaner.
Figure 3 shows the diffusible hydrogen content added to the specimens that were cut after the fatigue test. The figure also shows the diffusible hydrogen content of the specimens after the slow-speed tensile shear test, which was performed under the hydrogen charging conditions reported in the previous study19) [for consistency with the previous study,19) it is denoted as S-TST in the figure]. Under the hydrogen charging conditions used in this report, the diffusible hydrogen content changed by several orders of magnitude, from 0.001 mass ppm to 1 mass ppm. Furthermore, the diffusible hydrogen content of specimens after the fatigue test exhibited greater variation than that of specimens after S-TST under all hydrogen charging conditions. Despite this variation, the values under these conditions are similar. The reasons for greater variation in the diffusible hydrogen content of specimens after the fatigue test include changes in the solution used for the fatigue test over a long time and differences in the handling of specimens, such as the time taken to remove them.

Diffusible hydrogen content of spot welds after tensile–shear fatigue tests and slow rate tensile–shear tests (S-TST)19) under different hydrogen charging conditions.
Figure 4 shows the relationship between ΔL and the cycles to failure Nf obtained from the fatigue test under each hydrogen charging condition (the ΔL–Nf diagram). Figure 4(a) presents all the data obtained in the present tests. For clarity, we separated the results obtained in atmosphere and under charging condition B, where the ΔL–Nf diagrams were similar [Fig. 4(b)], and under charging conditions C, D, and E, where the ΔL–Nf diagram was different [Fig. 4(c)]. The curve representing the results obtained in atmosphere becomes horizontal at approximately Nf = 2 × 10⁶ cycles, where the fatigue limit was ΔL = 0.360 kN. In the tensile shear test conducted in the previous study,19) the tensile shear strength under charging condition B was equivalent to that in atmosphere, and little hydrogen embrittlement occurred. Thus, even in a test where dislocation motion and vacancy formation occurred during load cycles, diffusible hydrogen contents of less than 0.01 mass ppm did not affect the fatigue properties. Under charging condition C, the fatigue life did not vary greatly up to Nf = 2 × 10⁶ cycles [Fig. 4(a)]. However, when the ΔL–Nf diagram is separated into Figs. 4(b) and 4(c), the shape of the ΔL–Nf curve was different from those under charging conditions A and B. For example, under charging condition C, the curve bends at approximately 6 × 10⁵ cycles; however, it does not then become horizontal with increasing Nf, and ΔL gradually decreases. Under charging conditions D and E, the curve also bends, and then ΔL gradually decreases. A continuously decreasing S–N model is generally used for the nonlinear regression of the ΔL–Nf curve,27) and one curve is drawn. However, in this study, as discussed below, we selected a plot and drew two regression lines using a semi-log linear regression model. The intersection of these two lines was used as the inflection point. We found that the fracture surface changed around this inflection point; thus, we drew a regression line for discussion [Fig. 4(c)]. We selected the plot so as to obtain the maximum coefficient of determination R2 for both regression lines and then plotted the two regression lines. The R2 for the regression lines under charging conditions C, D, and E are 0.966, 0.995, and 0.977 before the inflection point and 0.926, 0.970, and 0.918 after the inflection point, respectively. Under charging conditions C to E, as the diffusible hydrogen content increased, the inflection point and ΔL–Nf curve shifted downward, indicating a shorter fatigue life. Figure 5 shows the relationship between the diffusible hydrogen content and the fatigue limit (strength after 107 cycles), ΔLlim, obtained from the ΔL–Nf diagrams obtained under conditions A to E. ΔLlim is lower at higher diffusible hydrogen contents.
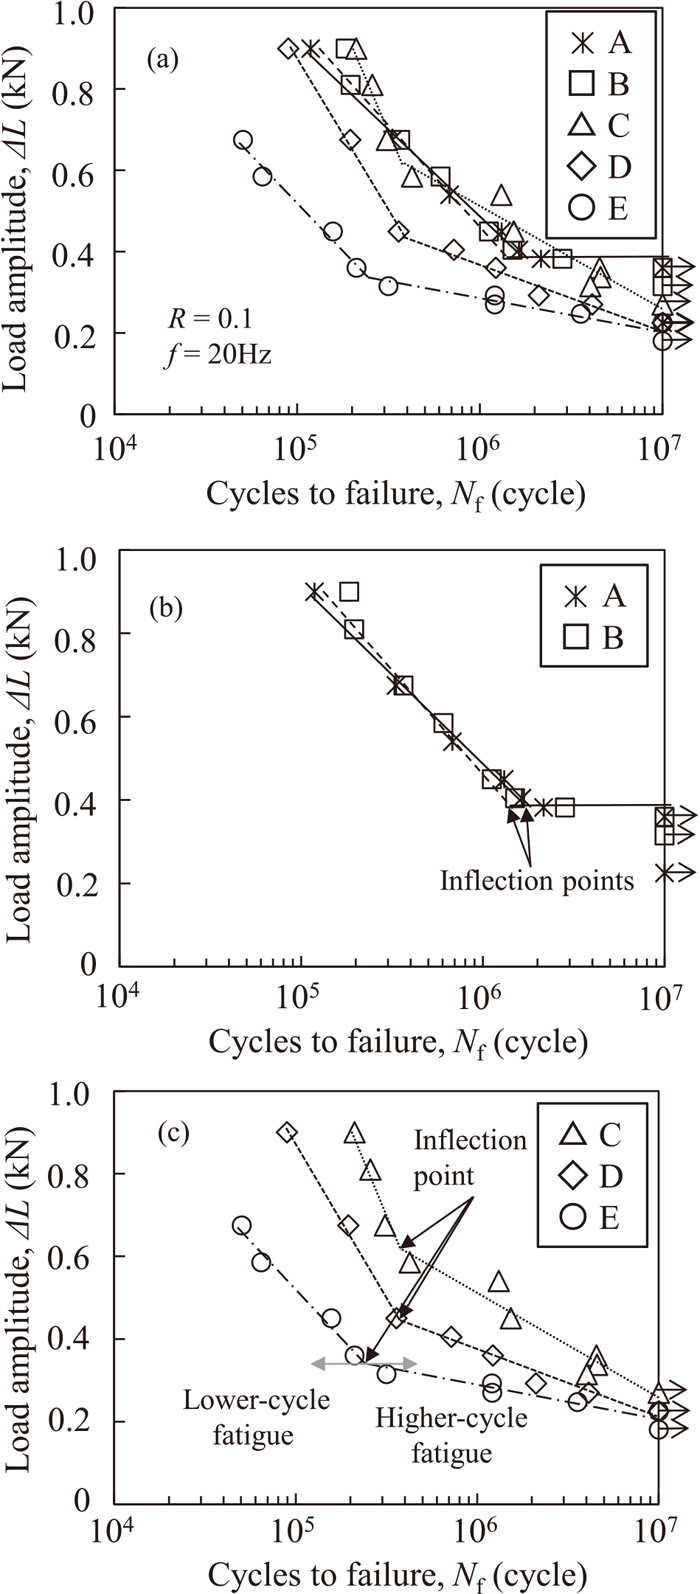
ΔL–Nf diagrams of spot welds obtained from tensile–shear fatigue tests under different hydrogen charging conditions.

Relationship between diffusible hydrogen content and endurance limit, ΔLlim at 107 cycles.
Figures 6 and 7 show the fracture surfaces of specimens that were fatigue tested in atmosphere and under hydrogen charging. In all specimens, cracks propagated from the area of stress concentration on the nugget edge in the sheet thickness direction, resulting in fracture. Figure 6 shows photographs of the fracture surfaces of specimens that failed below the inflection point (Fig. 4). Specimens that were fatigue tested in atmosphere under charging condition B, where the ΔL–Nf diagram was the same as that of the specimens tested in atmosphere, exhibited similar fracture surfaces at the crack initiation site at the nugget edge and in the crack propagation area, where the fracture surfaces were relatively flat. Figure 7 shows photographs of the fracture surfaces of specimens that failed above the inflection point (Fig. 4) under charging conditions C, D, and E, where the ΔL–Nf diagram was notably different; in these specimens, cracks appeared along grain boundaries. The fracture surfaces had notable unevenness. Intergranular fracture surface was more commonly observed in the crack propagation area than at the crack initiation site. For charging condition E, the fracture surface near the inflection point (ΔL = 0.360 kN) is also shown. Intergranular fracture surface covered a smaller area of specimens that failed above the inflection point than in specimens that failed below the inflection point, and the fracture surface was flat. A comparison of the crack initiation site and crack propagation area showed that at the crack initiation site, very few areas can be identified as intergranular fracture surface, where the fracture surface morphology was similar to that observed after the fatigue test in atmosphere. By contrast, in the crack propagation area, under all charging conditions, grain boundary cracks were scattered over the crack propagation surface. More area of intergranular fracture surface appeared at high diffusible hydrogen contents. Under charging condition E, the fracture surface near the inflection point appeared to be somewhat more uneven at the crack initiation site compared to that of other specimens that failed above the inflection point; however, there were more grain boundary cracks than in other specimens that failed below the inflection point. This result shows that the fracture surface morphology changed near the inflection point.

SEM images of fracture surfaces of spot welds after tensile–shear fatigue testing in lower-cycle than inflection point under different hydrogen charging conditions. The leftmost column presents macro-photos of specimens tested under conditions A–E. The central column presents near the crack initiation site and the rightmost column presents the crack propagation area. (Online version in color.)

SEM images of fracture surfaces of spot welds after tensile–shear fatigue testing at ΔL=0.360 kN under different hydrogen charging conditions and ΔL=0.293 kN under hydrogen charging condition E. The leftmost column presents macro-photos of specimens tested under conditions C–E. The central column presents near the crack initiation site and the rightmost column presents the crack propagation area.
In the materials and spot welds used in this study, as the diffusible hydrogen content of the specimens increased, the ratio of the brittle fracture surface containing intergranular fracture increased.11,19,28) Thus, a critical diffusible hydrogen content for embrittlement exists. When the diffusible hydrogen content in the specimens is high, the average reaches the critical value; thus, the brittle fracture surface increases. When the diffusible hydrogen content is low, diffusible hydrogen accumulates to critical amounts in the inclusions and microdefects of specimens under a load, resulting in embrittlement and failure. Consequently, their area becomes limited. Thus, differences in the ΔL–Nf diagram associated with differences in diffusible hydrogen content and the corresponding differences in the fracture surface are considered as follows. The fracture surface observation in Fig. 6 shows that intergranular fracture surfaces were more common in fatigue below the inflection point; however, the addition of a relatively high load resulted in localized plastic deformation. Diffusible hydrogen became concentrated and reached the critical content for embrittlement as a result of hydrogen accumulation associated with dislocation movement and the generation of hydrogen trap sites by vacancy formation. Specifically, at the diffusible hydrogen content introduced under charging condition C, an assessment of the hydrogen embrittlement of steel sheets28) showed that the condition was not suitable for the formation of intergranular fracture surfaces. However, in the present study, fracture surfaces often included intergranular fracture surfaces; thus, we can conclude that fatigue resulted in the accumulation of dislocations and vacancies at the grain boundary, greatly contributing to the accumulation of diffusible hydrogen at the grain boundary. By contrast, in fatigue above the inflection point, intergranular fracture surfaces rarely appeared at crack initiation sites, but rather were scattered throughout the crack propagation area. In fatigue at higher cycles, the repeated low load at crack initiation sites caused little localized plastic deformation; therefore, near the nugget (that is, the crack initiation site), the concentration of diffusible hydrogen, which could result in grain boundary fracture, was limited. However, as the diffusible hydrogen content increased, the inflection point shifted toward lower loads and shorter life, where the fatigue limit decreased because of the presence of hydrogen. Point defects (mainly vacancies), which represent the crack initiation mechanism in a low-stress fatigue test, are diffused, connected pores, and thus form microcracks.29) If diffusible hydrogen is present, hydrogen-enhanced localized plasticity,30) and hydrogen-enhanced strain induced vacancy31) is promoted. Thus, diffusible hydrogen promoted the diffusion and generation of vacancies at lower loads, which allowed pores to connect (mainly in grains) and form microcracks. In the crack propagation area, as more grain boundary cracks formed, the diffusible hydrogen content and accumulation likely increased. With more cycles, the test duration became long, and hydrogen charging provided hydrogen to the specimens. When the provided diffusible hydrogen was trapped in pores and dislocations generated and increased by fatigue, it became concentrated and accumulated. At the fracture surfaces, although grain boundary cracks were observed, they were relatively flat and followed the crack propagation direction. In crack propagation in the presence of hydrogen, a localized plastic zone formed at the tip of the cracks, which continued to propagate without widening; this behavior is called hydrogen-enhanced successive fatigue crack growth (HESFCG).32) Stress was highly concentrated at the sharp tips of the cracks, and the associated increase in dislocation density and hydrogen accumulation are expected to be notable. Thus, when these cracks intersected grain boundaries, the grain boundary preferentially cracked, creating intergranular fracture.
3.3. Effect of Frequency and Test Time on Fatigue PropertiesWe discuss the frequency dependence of the fatigue properties under hydrogen charging. Figures 8(a) and 8(b) show Nf and the time to failure tf, respectively, in atmosphere (condition A) and under hydrogen charging condition D at various frequencies. In atmosphere, Nf showed little variation with frequency; however, under hydrogen charging, Nf decreased with decreasing frequency. However, regardless of whether hydrogen charging was performed, tf increased with decreasing frequency. However, compared to the results in atmosphere, the increase in tf was limited under hydrogen charging.
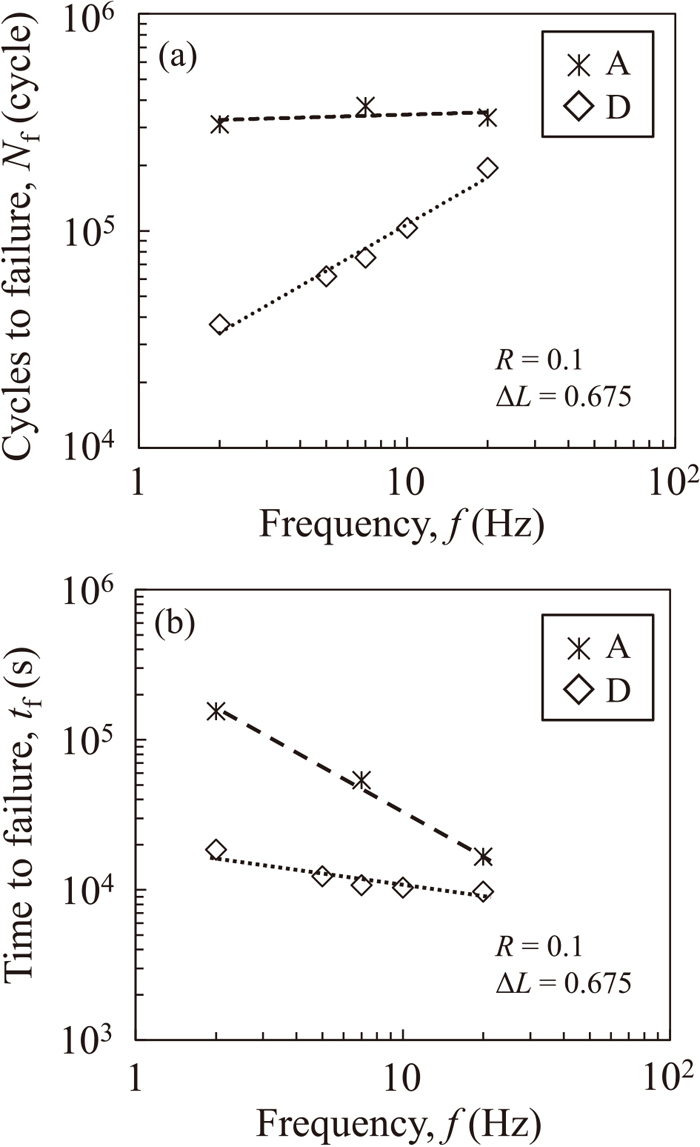
Frequency dependence of (a) Nf, (b) tf in tensile–shear fatigue tests in air and under hydrogen charging condition D. f was varied at ΔL=0.675 kN.
Figures 9(a) and 9(b) show the ΔL–Nf diagram and ΔL–tf diagram, respectively, for fatigue tests performed at frequencies of 2 and 20 Hz under charging condition D. In the 2 Hz fatigue test, as ΔL increased, Nf gradually decreased. For all ΔL values, Nf was lower in the 2 Hz test than in the 20 Hz test. The shape of the ΔL–Nf diagrams differed, and the bend in the curve that appeared at 20 Hz was unclear at 2 Hz. In addition, in the ΔL–tf diagram, as in Fig. 8(b), tf was larger at the lower frequency (2 Hz). The ΔL–tf diagram tended to converge during long tests at both frequencies. Figure 10 shows the fracture surfaces of specimens fatigue tested at a frequency of 2 Hz under charging condition D. In the 2 Hz fatigue test, there was no inflection point; thus, we observed specimens that failed at ΔL, which was close to where the inflection point appeared in the 20 Hz test for specimens that failed at a relatively high load. As in the 20 Hz fatigue test, notably uneven fracture surfaces appeared at the crack initiation site and in crack propagation areas at high ΔL (0.675 kN). Many intergranular fracture surfaces were confirmed. Furthermore, intergranular fracture surfaces were observed at ΔL values close to the inflection point (0.450 and 0.405 kN), where intergranular fracture surfaces were limited at 20 Hz.

(a) ΔL–Nf diagrams and (b) ΔL–tf diagrams at f =20 Hz and f =2 Hz for tensile–shear fatigue testing under condition D.

SEM images of fracture surfaces of spot welds after tensile–shear fatigue testing at f =2 Hz under condition D. The leftmost column presents macro-photos of specimens. The central column presents near the crack initiation site and the rightmost column presents the crack propagation area.
A previous study on the corrosion fatigue of steel33) discussed changes in the ΔL–Nf and ΔL–tf diagrams with frequency. In the corrosion fatigue of steel, it is assumed that the notch effect of corrosion marks that form on the surface reduces the fatigue strength.33) Notches caused by corrosion marks are generated when corrosion dissolves the surface, where the corrosion reaction rate is increased by the energy of repetitive stress.33) By contrast, in fatigue due to the hydrogen charging of spot welds in this study, the nugget edge, which becomes the crack initiation point under cathodic polarization, is not wetted; thus, corrosion does not occur. Therefore, corrosion marks are unlikely to have the notch effect. During the test, diffusible hydrogen diffused from the sheet surface to the concentrated stress at the nugget edge in spot welds. Furthermore, the accumulated diffusible hydrogen promoted hydrogen-enhanced localized plasticity via loading30) and hydrogen-enhanced strain induced vacancy, such as vacancy clusters.31) HESFCG32) accelerates crack propagation. Consequently, the notch effect of corrosion marks in corrosion fatigue is equivalent to the formation of microcracks by the connection of hydrogen-enhanced strain induced vacancy, such as pore clusters,31) which enhanced hydrogen-enhanced localized plasticity28) and promoted propagation through HESFCG.32) As the frequency decreased under hydrogen charging, Nf decreased. Compared to the results obtained in atmosphere, the increase in tf under hydrogen charging was limited. This result can be qualitatively explained as follows. The interaction between hydrogen and dislocations is strain-rate-dependent, where hydrogen embrittlement is promoted by a low strain rate and dislocation movement following hydrogen movement. Thus, lower frequency results in stronger interactions between hydrogen and dislocations; that is, it supports stress-induced diffusion and hydrogen-enhanced localized plasticity and stabilizes hydrogen-enhanced strain induced vacancy. The difference between the ΔL–Nf and ΔL–tf diagrams of fatigue tests performed at frequencies of 2 and 20 Hz can be explained by the strain rate dependence of the interaction between hydrogen and dislocations. In the ΔL–Nf diagram, the inflection point became unclear in diagrams from the 2 Hz fatigue test, where the fracture surface at any ΔL exhibited uneven intergranular fracture surfaces. At a relatively low ΔL (0.405 kN), failure occurred after fewer cycles than in the 20 Hz fatigue test. The crack initiation site showed intergranular fracture surfaces, where the failure mechanism was similar to that in a fatigue test with relatively high ΔL. The reason is probably that the strain rate was low in the 2 Hz fatigue test, which promoted stress-induced diffusion and hydrogen-enhanced localized plasticity, resulting in notable hydrogen accumulation associated with plastic deformation. Because the failure mechanism was the same, the inflection point disappeared.
3.4. Comparison of Fatigue Properties when Diffusible Hydrogen was Introduced and Static Test ResultFigure 11 shows the relationship between the diffusible hydrogen content and relative strength. Here, relative strength refers to the ratio of the fatigue strength at 107 cycles obtained in a 20 Hz fatigue test performed in atmosphere (fatigue limit) to the fatigue strength at 107 cycles obtained in a fatigue test performed under each hydrogen charging condition. In the static test,19) it refers to the ratio of tensile shear strength obtained in a tensile shear test performed at the conventional tensile speed [denoted as C-TST in Fig. 11 for consistency with the previous report19)] and a tensile shear test performed at slow speed (S-TST in Fig. 11) in atmosphere and under hydrogen charging. The previous study19) showed no decrease in the relative strength in C-TST until the diffusible hydrogen content reached 0.5 mass ppm. However, in S-TST, the relative strength decreased at approximately 0.005 mass ppm. By contrast, in the present fatigue test, the relative strength decreased at a diffusible hydrogen content of approximately 0.01 mass ppm. The relationship between the diffusible hydrogen content and relative strength was similar to that obtained in S-TST. However, in the semi-log linear regression of the relative strength versus diffusible hydrogen content, the slope was larger in S-TST than in the fatigue test. Because C-TST was performed at high speed, the time to failure was short, and the movement of diffusible hydrogen could not follow the dislocation movement. By contrast, in S-TST and the fatigue test, 107 cycles required more time; thus, although the strain speed was different in each test, there was sufficient interaction between hydrogen and dislocations in both cases. This observation probably explains why the relationship between the diffusible hydrogen content and relative strength was similar in S-TST and the fatigue test. However, the load at the crack initiation site was different in S-TST and the fatigue test. The stress gradient at the crack initiation site was lower in the fatigue test, which likely reduced hydrogen accumulation. Consequently, the slope was smaller in the fatigue test. We showed in Section 3.3 that the fatigue properties obtained in the fatigue test are frequency-dependent. In the ΔL–Nf diagram [Fig. 9(a)], the overall strength was lower in the 2 Hz test than in the 20 Hz test. When we refer to the observed corrosion fatigue in steel materials33) and the ΔL–tf diagram [Fig. 9(b)] in the present experiment, we can confirm a converging trend in the diagrams for the 2 Hz and 20 Hz tests as the test duration increased. In a fatigue test performed in hydrogen gas, the relationship between the ratio of the crack propagation rate (under hydrogen gas/in atmosphere) and the square root of the hydrogen gas pressure times the frequency is within a relatively narrow range.34) The fatigue limit depends not only on crack propagation but also on the likelihood of crack formation. Common mechanisms such as the promotion of hydrogen accumulation and localized plastic deformation and the stabilization of hydrogen-enhanced strain induced vacancy determine crack formation, which ultimately results in fractures (the time to final fracture is different in the fatigue and static tests). Thus, the dependence of crack formation on diffusible hydrogen has a similar trend to that in the static test. In addition, because it has been confirmed that the fracture surface contained intergranular fracture surfaces at low ΔL in a fatigue test at low frequency, the clarification of the frequency dependence of the fatigue limit is a future challenge. In the fatigue and static tests, the promotion of hydrogen accumulation and localized plastic deformation and the stabilization of hydrogen-enhanced strain induced vacancy caused hydrogen embrittlement. This similarity in mechanisms shows that the relationship between the fatigue strength at 107 cycles (fatigue limit) obtained in the fatigue test and the diffusible hydrogen content and the relationship between the tensile shear strength obtained in a low-tensile-speed tensile shear test (S-TST) and the diffusible hydrogen content can be expected to be similar. That is, if we compare the results of fatigue tests that require a relatively long time with the result of S-TST, which can yield results in a relatively short time, and then use a fatigue test for confirmation, we can efficiently obtain a design for spot welds with superior fatigue life.
We assessed the influence of the diffusible hydrogen content on the cycles to failure, fatigue limit, and fracture surface of spot welds in high-tensile-strength steel sheets. In addition, we examined the relationship between the diffusible hydrogen content and fatigue strength at 107 cycles (fatigue limit) obtained from fatigue tests and the tensile shear strength obtained from tensile shear tests. We obtained the following conclusions.
(1) A fatigue test of spot welds in high-tensile-strength steel sheets in atmosphere showed a clear fatigue limit; however, when diffusible hydrogen was introduced at a concentration of approximately 0.01 mass ppm, the cycles to failure decreased. The fatigue strength at 107 cycles decreased as the diffusible hydrogen content increased.
(2) The fracture surfaces after fatigue testing at high frequency contained intergranular fracture surfaces in the crack propagation area, indicating that hydrogen accumulation was promoted at the tip of the cracks during crack propagation.
(3) In specimens containing diffusible hydrogen, the cycles to failure were lower at lower frequency, where intergranular fracture surfaces were often observed on the fracture surfaces.
(4) A comparison of the results of fatigue and static tests revealed similar relationships between the strength obtained in a slow-speed tensile shear test (S-TST) and the fatigue test and the diffusible hydrogen content. The reason is that both tests are likely to allow interaction between hydrogen and dislocations. Consequently, fatigue property assessments that require relatively long-term tests can be screened using S-TST, which yields results in a relatively short time.
