INTRODUCTION
Water-soluble carbohydrates are commonly present in an amorphous form in food products and undergo glass-rubber transition (glass transition) at their glass transition temperature (Tg). At temperatures below Tg, amorphous carbohydrates in food matrices exist in the glassy state and have a hard, brittle, and/or crisp texture [1,2]. Meanwhile, above Tg, amorphous carbohydrates become rubbery and have a texture that is soft, ductile, and/or sticky. Caking (aggregation) of amorphous carbohydrate-based powders readily occurs in the rubbery state [3,4,5,6,7,8]. Because the Tg of amorphous hydrophilic carbohydrates decreases with increasing water content and/or water activity (aw) owing to water plasticization, water sorption can result in glass transition even at a constant temperature. The water content and aw at which glass transition can occur at ambient temperature (commonly 298 K) are termed as the critical water content (Wc) and critical water activity (awc), respectively [9,10,11,12], which are useful parameters for the quality control of amorphous water-soluble carbohydrates and carbohydrate-based foods.
The effect of water content on the Tg of amorphous materials is described by the Gordon-Taylor (GT) equation (Eq. 1),
|
T
g
=
M
s
T
gs
+
k
(
1
−
M
s
)
T
gw
M
s
+
k
(
1
−
M
s
)
| (Eq. 1) |
where Ms is the mass fraction of the solid, Tgs is the Tg of the anhydrous solid (K), Tgw is the Tg of water (K), and k is a constant (dimensionless). Tgw can be set to 136 K [13,14]. With two constants (Tgsw and k), Tg-curve (water content-dependence of Tg) and Wc can be determined using the GT equation. In addition, awc can be determined using the Guggenheim-Anderson-de Boer (GAB) water sorption equation (Eq. 2),
|
W
=
W
m
CKa
w
(
1
−
Ka
w
)
(
1
+
(
C
−
1
)
Ka
w
)
| (Eq. 2) |
where W and Wm are the equilibrium water content (g/g-DM, dry matter) and monolayer water content (g/g-DM), respectively; C is a factor correcting the sorption properties of the monolayer with respect to the bulk liquid; and K is a factor correcting the sorption properties of the multilayer with respect to the bulk liquid. From the GAB equation with three parameters (Wm, C, and K), Wc can be converted to awc.
For amorphous water-soluble carbohydrates, k in the GT equation (Eq. 1) can be predicted from Tgs (K) using the following empirical equation [12]:
|
k
=
0.0293
T
gs
−
4.39
| (Eq. 3) |
After determining the Tgs and k, Wc can be predicted by rearranging the GT equation (Eq. 1) as follows:
|
M
sc
=
162
k
162
k
+
T
gs
−
298
| (Eq. 4) |
|
W
c
=
1
−
M
sc
M
sc
| (Eq. 5) |
where Msc is the mass fraction of the solute at Tg = 298 K. The Tgs values of various amorphous water-soluble carbohydrates have been widely reported by previous studies. If no data are available in the literature, the Tgs of such carbohydrates can be easily evaluated using differential scanning calorimetry (DSC). Additionally, the Tgs of an amorphous water-soluble carbohydrate mixture can be predicted from the Tgs and ΔCp (heat capacity change induced by glass transition) of the individual components [11]. Thus, the fact that Wc can be predicted from Tgs has an important basis in food quality control. However, no study has reported an approach for predicting awc. Because the quality of food and food ingredients is commonly controlled by aw, determining awc is more important than determining Wc. Like Wc, it is useful if awc can be also predicted by Tgs. The water sorption behavior is affected by Tgs [15,16], as shown in Fig. 1; further explanation is provided in Appendix a. Thus, there is a possibility that GAB parameters can be characterized by Tgs.

Fig. 1.
Water sorption isotherm of amorphous water-soluble carbohydrates with varying Tgs (A), and three regions in the type II isotherm (B).
The present study aimed to establish a method to predict the awc of amorphous water-soluble carbohydrates from their Tgs. First, we evaluated the water sorption isotherms of four types of hydrogenated starch hydrolysate (HSH) and analyzed the results using the GAB model. Second, the effect of Tgs on the GAB parameters of amorphous water-soluble carbohydrates was investigated using Tgs values reported in the literature, and an awc-predictive approach was proposed. Finally, we assessed the applicability of this awc-prediction method to amorphous water-soluble electrolytes and partially water-insoluble carbohydrates.
RESULTS AND DISCUSSION
Water sorption isotherms of amorphous HSHs.
Water sorption isotherms of the HSH samples maintained at 298 K are shown in Fig. 2. LMiHSH, MiHSH, and HiHSH exhibited “type II” water sorption isotherms (Appendix a). Their Tgs values were considerably higher than 298 K (Table 1); thus, glass transition occurred at a certain aw in the water sorption isotherms. However, LoHSH exhibited a “type III” water sorption isotherm (Appendix a). The Tgs of LoHSH (283.5 K) was lower than 298 K (Table 1); thus, a rubbery or liquid state was observed in all the aw-region. Type III is commonly observed for amorphous water-soluble carbohydrates that have a Tgs lower than or close to 298 K; thus, awc cannot be defined intrinsically for these materials (Appendix a). LoHSH exhibited a type III curve like we expected. Thus, awc-prediction based on Tgs was conducted for only the samples showing type II isotherms (LMiHSH, MiHSH, and HiHSH).
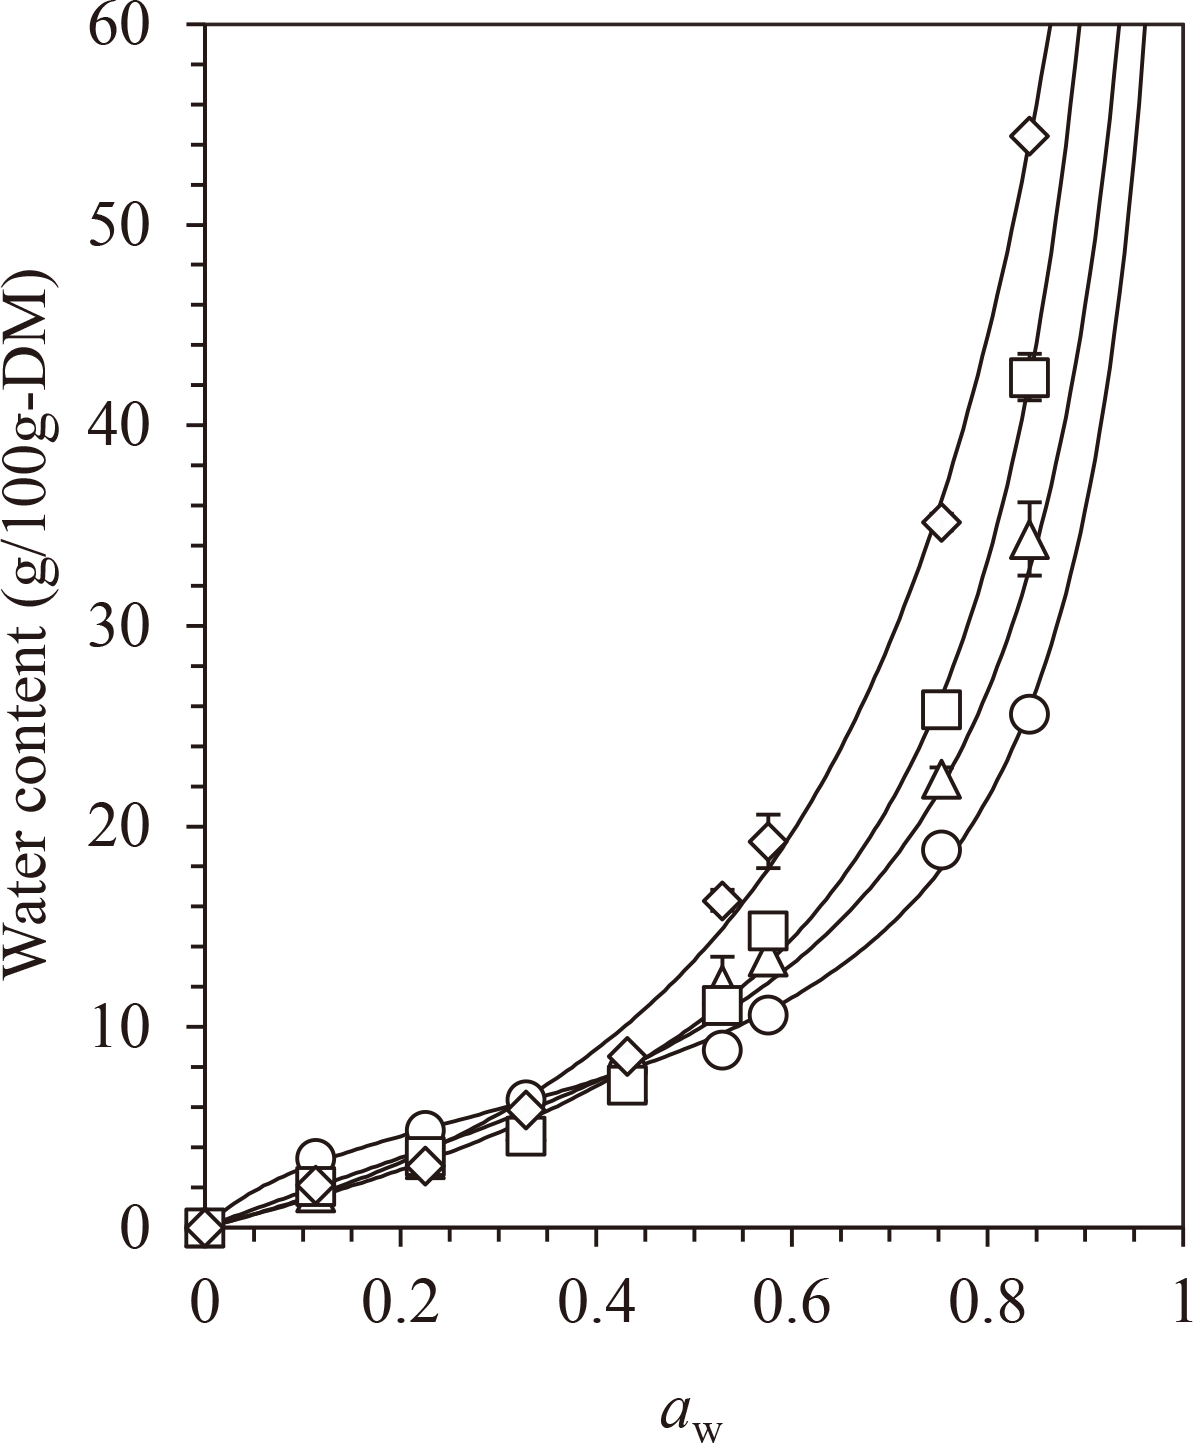
Table 1. Glass transition and water sorption properties of amorphous water-soluble carbohydrates.
| Sample | C | K | W m (g/100g) | T gs (K) | k | W c (g/100g) | a wc | Ref. |
| LoHSH | 0.572 | 0.853 | 25.583 | 283.5 | 2.23a | NA | NA | 11 |
| LMiHSH | 1.424 | 0.965 | 9.156 | 324.9 | 4.31a | 2.43b | 0.173c | 11 |
| MiHSH | 2.725 | 0.946 | 7.257 | 344.8 | 12.13a | 3.95b | 0.227c | 11 |
| HiHSH | 9.639 | 0.949 | 5.325 | 402.0 | 24.25a | 8.74b | 0.482c | 11 |
| Maltodextrin (MD) | 9.192 | 0.995 | 4.3 | 435.8 | 9.00 | 9.4 | 0.575 | 4 |
| Mango solute (MS)d | 1.686 | 0.920 | 16.1 | 310.4 | 3.86 | 1.9 | 0.074 | 3 |
| MS-MD (0.2 : 0.8) | 2.303 | 0.922 | 6.4 | 366.1 | 7.18 | 5.8 | 0.345 | 3 |
| MS-MD (0.4 : 0.6) | 2.268 | 0.958 | 8.1 | 335.3 | 5.57 | 4.1 | 0.215 | 3 |
| MS-MD (0.6 : 0.4) | 2.640 | 0.950 | 9.8 | 325.5 | 4.95 | 3.4 | 0.160 | 3 |
| MS-MD (0.8 : 0.2) | 3.414 | 0.915 | 13.0 | 320.3 | 4.07 | 3.3 | 0.120 | 3 |
| Maltose | 4.05 | 1.085 | 5.33 | 368.6 | 7.4 | 5.89b | 0.337c | 17 |
| Glucose-MD (0.2 : 0.8) | 6.40 | 0.933 | 6.47 | 370.1 | 8.11 | 7.20 | 0.343 | 7 |
| Inulin (low MW) | 3.66 | 0.944 | 6.87 | 384.4 | 6.43 | 8.29b | 0.431c | 18 |
| Inulin (native) | 6.95 | 0.852 | 6.77 | 398.0 | 5.93 | 10.41b | 0.525c | 18 |
a The value was calculated by the approximated Couchman-Karasz model [11]. b The value was calculated by the Gordon-Taylor model with Tgs and k (Eq. 1). c The value was calculated by the Guggenheim, Anderson, and de Boer model with Wc (Eq. 2). d Water-soluble materials (manly sucrose, glucose, and fructose) were extracted from mango puree [4].
Effect of Tgs on the GAB parameters of amorphous water-soluble carbohydrates.
To establish an awc-predictive approach based on Tgs, the GAB and GT parameters for amorphous water-soluble carbohydrates were taken from the literature [3,4,7,11,17,18] and are listed in Table 1. GAB parameters are very sensitive to experimental values; a small deviation in the experimental values can cause a large difference in the GAB parameters [4,19,20]. In addition, the water contents at each aw are different between water sorption and water desorption (i.e., hysteresis effect). Therefore, the water content in samples needs to be removed fully prior to water sorption. However, these problems are not always elucidated in the literature. To avoid employing uncertain data, we only included the data reported by our research group at this stage and the data reported by other studies were applied later for comparison.
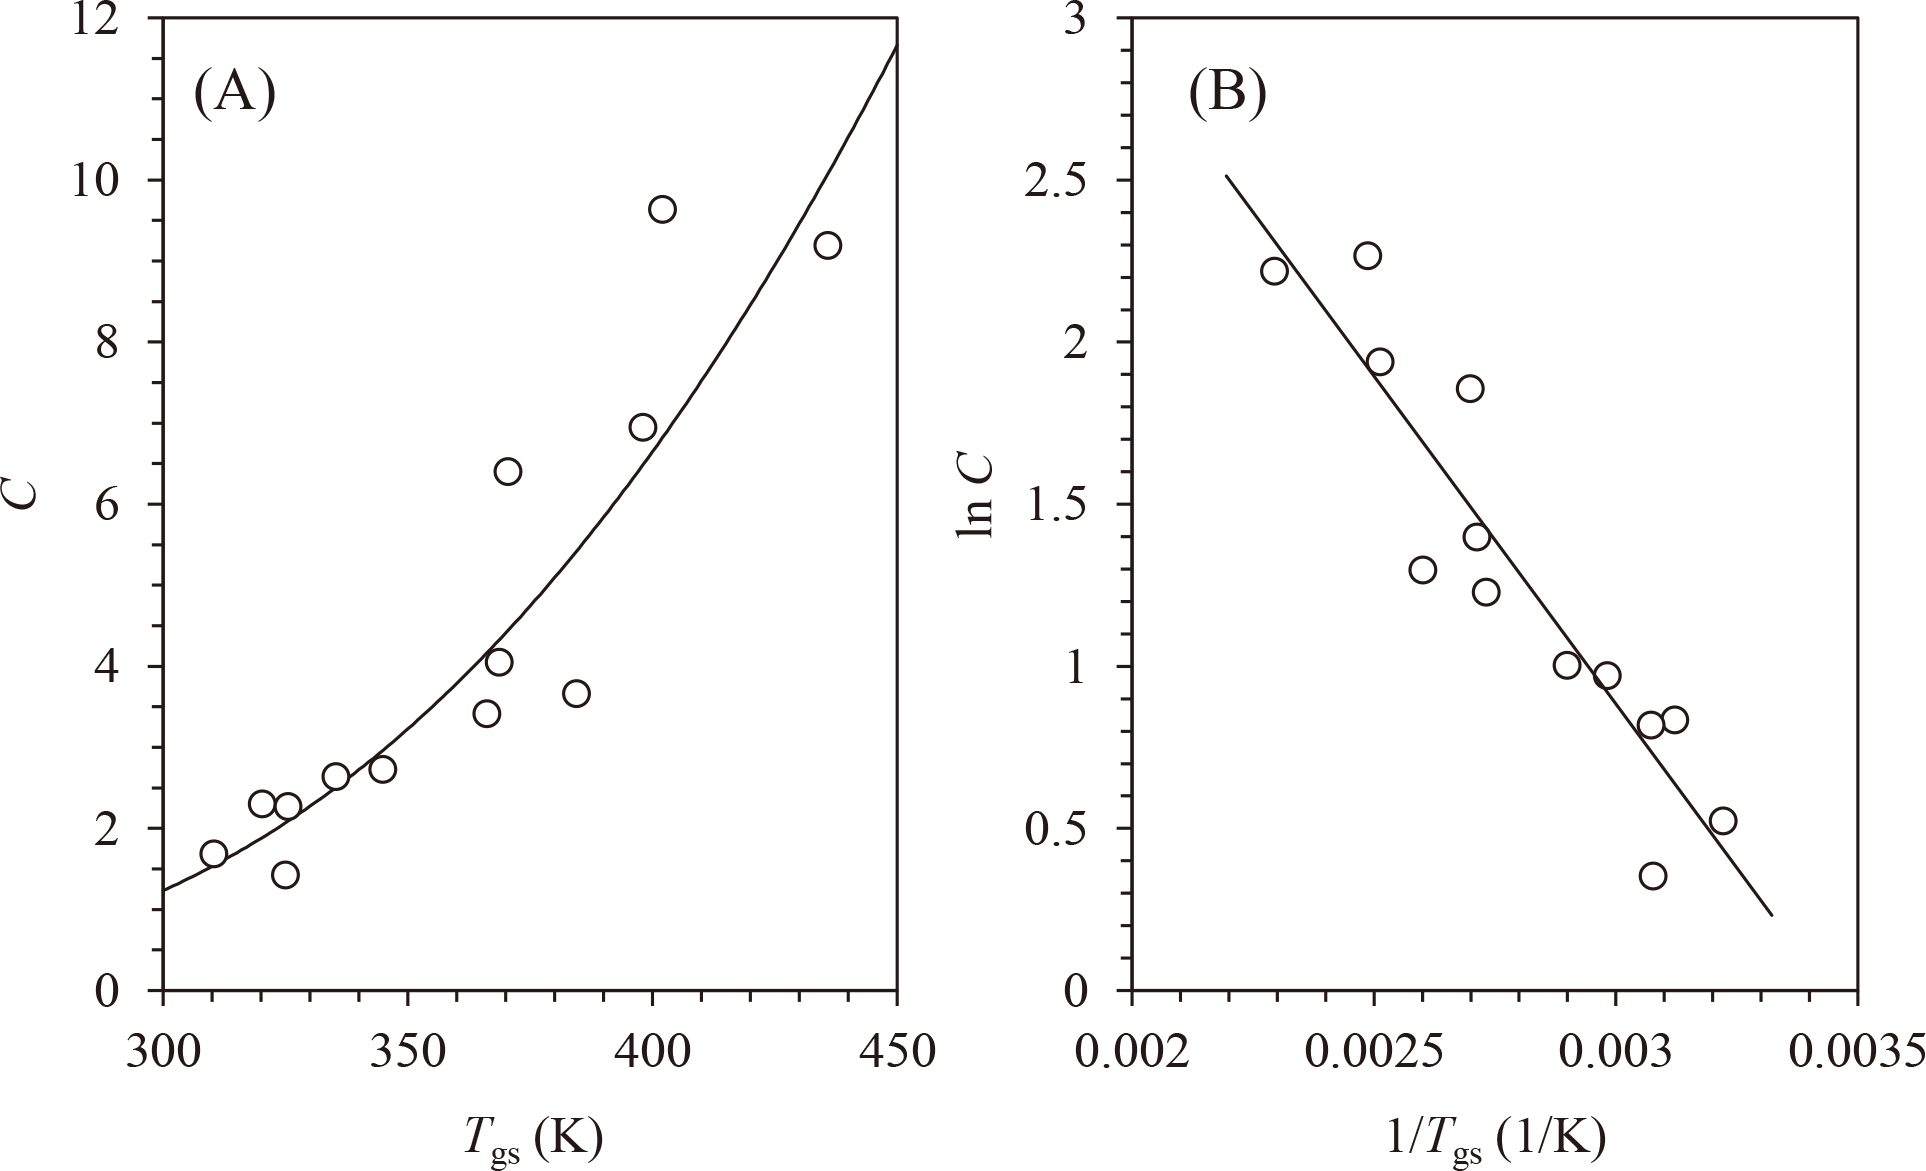
The relationship between C and Tgs is shown in Fig. 3A. The C values increased with increasing Tgs. The effect of the temperature on C can be analyzed using the Arrhenius-type (or van’t Hoff-type) equation [21,22,23,24]:
|
C
=
C
0
exp
(
ΔH
C
RT
)
| (Eq. 6) |
where T and R are absolute temperature and gas constant, respectively, and C0 and ΔHC are pre-exponential factor and activation energy, respectively. Temperature is directly proportional to molecular mobility; the higher the temperature, the higher the molecular mobility. Conversely, Tgs is inversely proportional to molecular mobility; the higher the Tgs, the lower the molecular mobility at a constant temperature (298 K in this study). In other words, T and Tgs are interchangeable parameters that reflect molecular mobility. Accordingly, the Arrhenius-type plot for C (Eq. 6) can be rearranged as follows:
|
C
=
C
0
*
exp
(
C
*
T
gs
)
| (Eq. 7) |
where C0* and C* are constants. This equation is referred to as “Tg-based Arrhenius-like equation” in this paper.
The Tg-based Arrhenius-like plot (lnC vs. 1/Tgs) for amorphous water-soluble carbohydrates is shown in Fig. 3B. There was a clear linearity in the plot (R2 = 0.857), and C* (slope) and lnC0* (intercept) values were determined to be −2022.7 and 6.9514, respectively, from the linearity (Eq. 7). Linearity also describes the solid curve shown in Fig. 3A.
The effect of temperature on K has also been analyzed using the Arrhenius-type equation previously [21,22,23,24]:
|
K
=
K
0
exp
(
ΔH
K
RT
)
| (Eq. 8) |
where K0 and ΔHK are the pre-exponential factor and activation energy, respectively. Thus, it is expected that the Tg-based Arrhenius-like equation can be also applied to K in addition to C (Eq. 7). However, there was little variation in K values of the amorphous water-soluble carbohydrates (Table 1), and mean ± SD of the K values was confirmed to be 0.942 ± 0.057 (n = 13). To simplify the awc-predictive approach, K was fixed to 1 (constant) for amorphous water-soluble carbohydrates.
When K is fixed to 1, the GAB model is equivalent to the Brunauer-Emmett-Teller (BET) model. The BET model is commonly employed to analyze water sorption behavior up to the intermediate aw-region [17]. Because the awc values of amorphous water-soluble carbohydrates are almost in the aw-range applied by the BET model (Table 1), the setting of K as 1 simplified the awc-predictive approach. Electrolyte polymers (e.g., proteins) and samples containing water-insoluble materials and/or parts have been reported to exhibit a much lower value of K than 1 [7,25]. However, this study focused only on water-soluble carbohydrates, which simplified the approach.
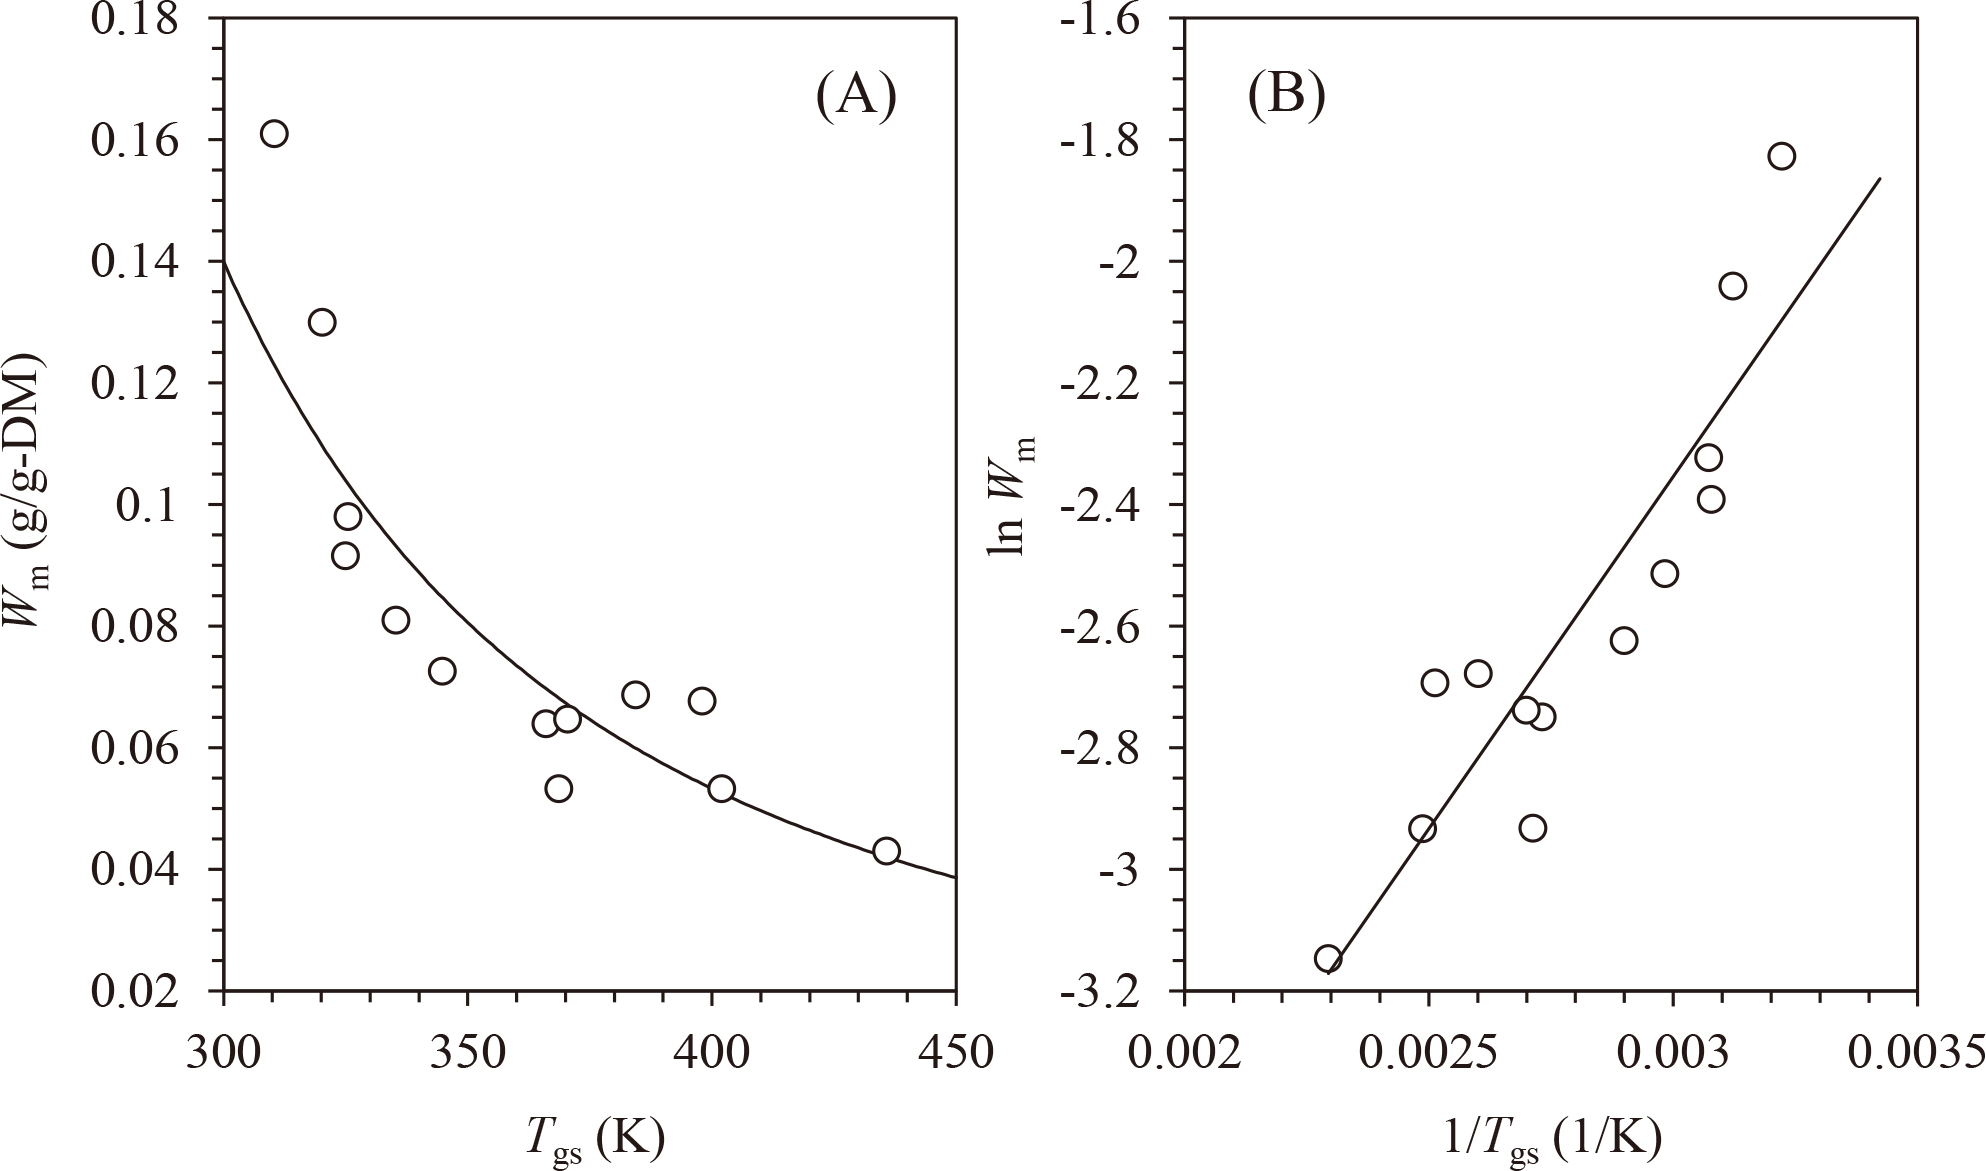
The temperature dependence of Wm has often been undetermined by previous studies, although there are some examples in which the Arrhenius-type equation has been applied [19,21]. This will be because the monolayer water content is independent of temperature, and temperature has a negligible effect on the surface area of materials. In contrast, Wm intrinsically depends on Tgs (Appendix a), because higher the Tgs, larger is the molar mass [11,18] and thus lower the surface area per g-DM. In other words, it is expected that a higher Tgs corresponds to a lower Wm.
The effect of Tgs on the Wm of amorphous water-soluble carbohydrates is shown in Fig. 4A. As expected, Wm decreased with increasing Tgs. As discussed above, the effect of Tgs on Wm can be analyzed using the Tg-based Arrhenius-like equation.
|
W
m
=
W
m
0
*
exp
(
W
m
*
T
gs
)
| (Eq. 9) |
where Wm0* and Wm* are constants. The Tg-based Arrhenius-like plot (lnWm vs. 1/Tgs) is shown in Fig. 4B. Good linearity was observed in the plot (R2 = 0.812), and Wm* (slope) and lnWm0* (intercept) values were determined to be 1159 and −5.830, respectively. Linearity also describes the solid curve shown in Fig. 4A.
Although the physical significance of the constants (C*, C0*, Wm*, and Wm0*) in the Tg-based Arrhenius-like equation is unclear at present, the Tg-based Arrhenius-like plot can be effectively used to express the effect of Tgs on the C and Wm of amorphous water-soluble carbohydrates. This is a valuable result for establishing an awc-predictive approach based on Tgs.
Applicability of the awc-predictive approach to amorphous water-soluble carbohydrates.
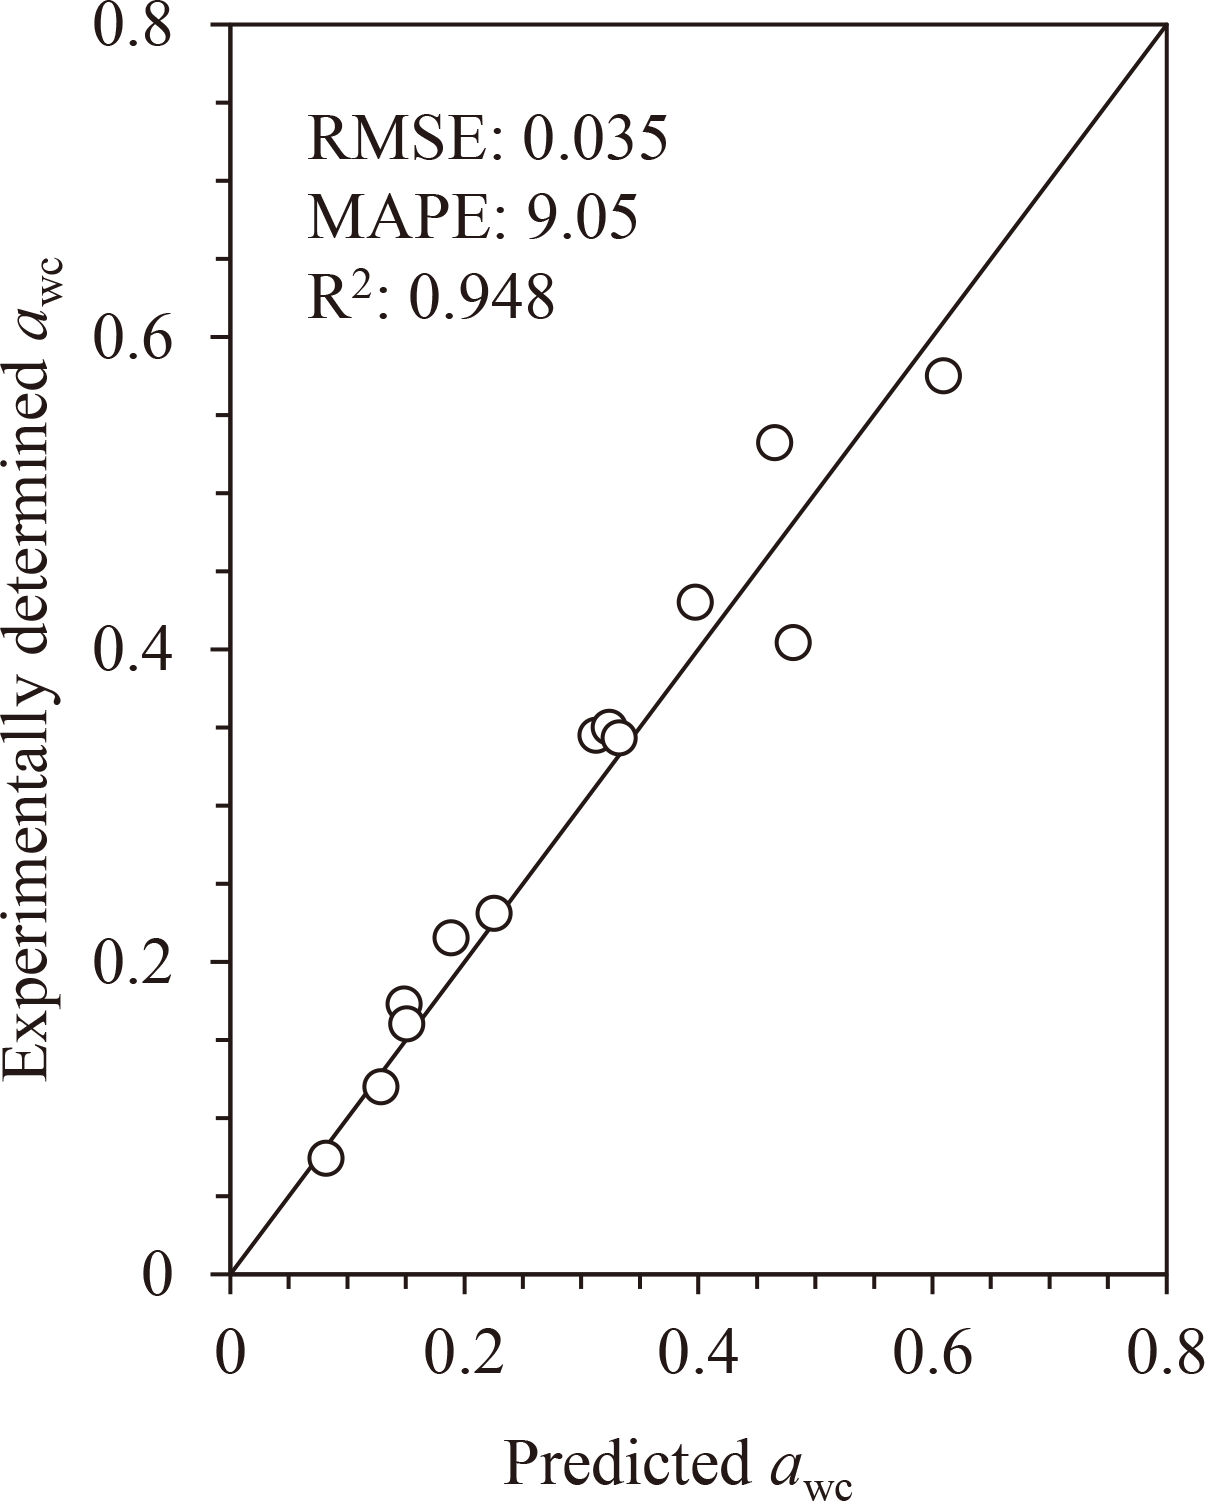
As C and Wm can be predicted using Tgs, awc can also be predicted using Tgs. Briefly, k was obtained using Eq. 3 from Tgs, and then, Wc was obtained using Eq. 5 using Tgs and k. Meanwhile, C and Wm were obtained using Eqs. 7 and 9, respectively, using Tgs. Thereafter, Wc was converted to awc using Eq. 2 with obtained C and Wm values. Subsequently, using the awc-predictive approach, awc was calculated from the experimentally determined Tgs listed in Table 1 [3,4,7,11,17,18]. The relationship between the experimentally determined awc and the predicted awc is shown in Fig. 5. The calculated awc values were in good agreement with the predicted awc values (RMSE = 0.035, MAPE = 9.05, and R2 = 0.948; n = 13).
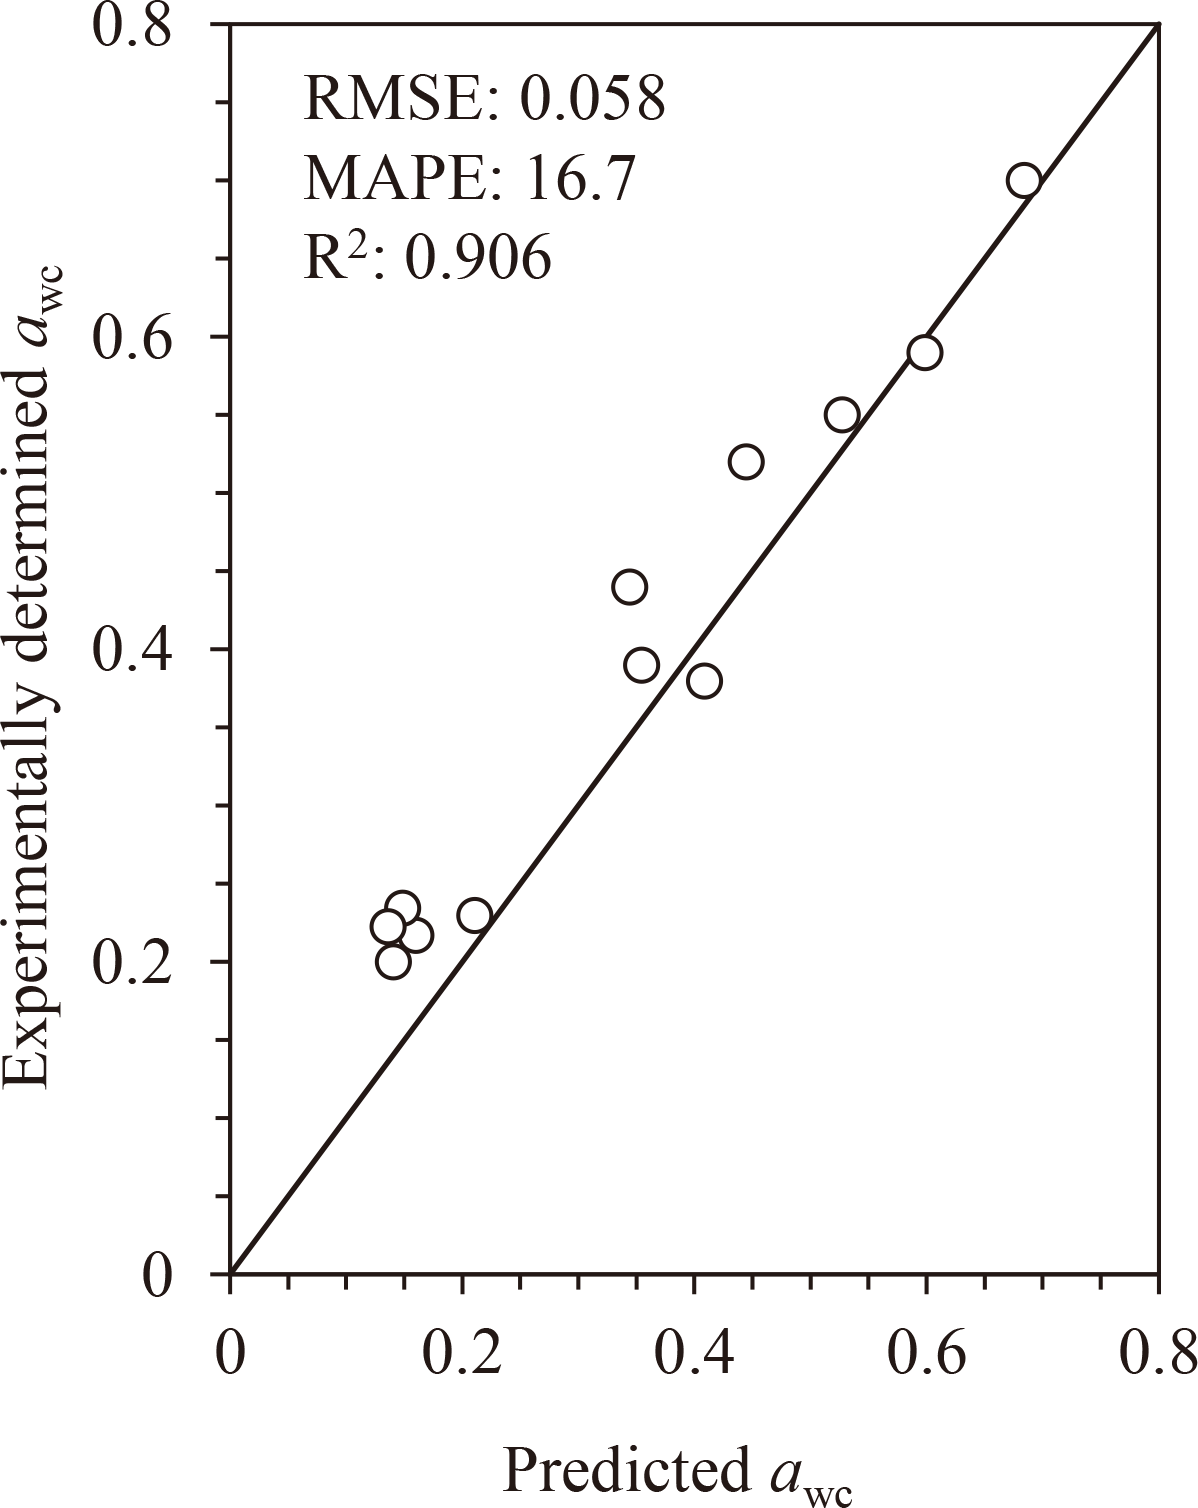
To further validate our proposed method, the applicability of the awc-prediction approach to other water-soluble carbohydrates reported in the literature was tested. The experimentally determined Tgs and awc and predicted awc are listed in Supplemental Data (Table S2; see J. Appl. Glycosci. Web site) [9,10,26,27,28]. The relationship between the experimentally determined and predicted awc is shown in Fig. 6. There was relatively good agreement between the values (RMSE = 0.058, MAPE = 16.7, R2 = 0.906, n = 12). Based on these results, we concluded that the awc-predictive approach based on Tgs can successfully determine the awc of amorphous water-soluble carbohydrates.
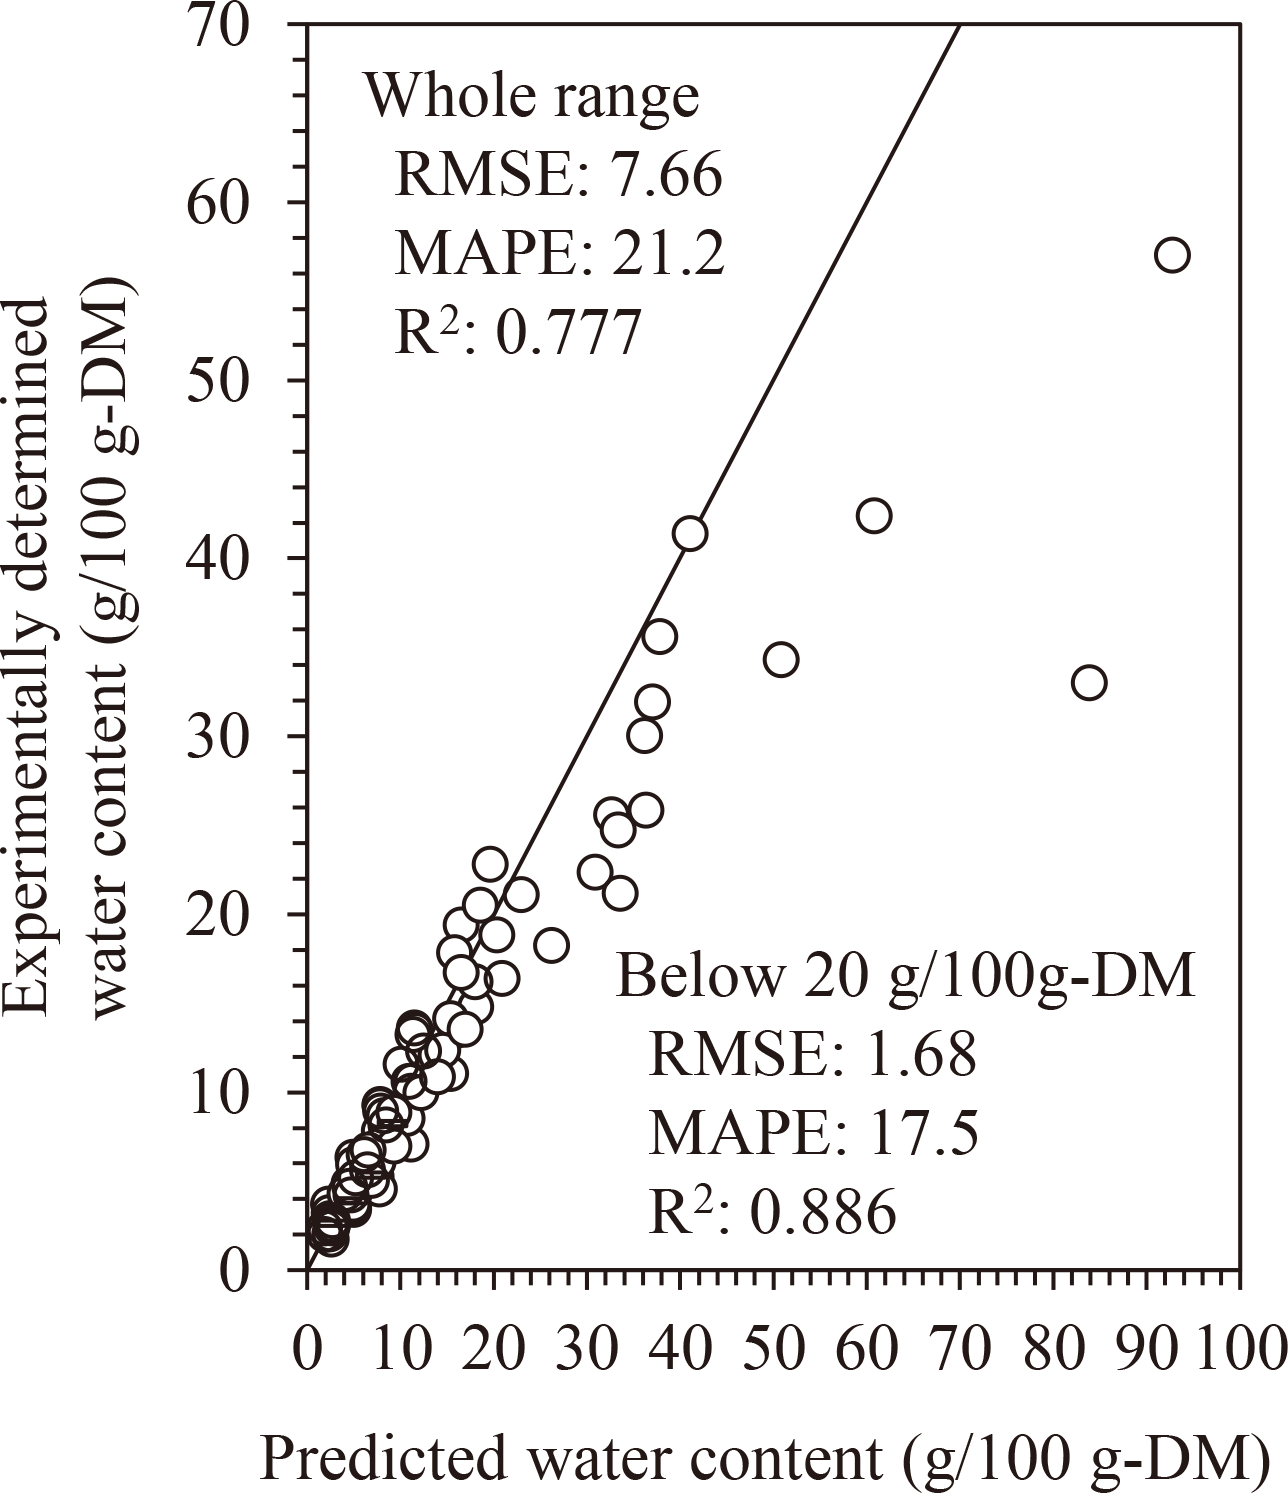
The awc-predictive approach can predict the GAB parameters, which implies that water sorption isotherm can also be predicted from Tgs. For confirmation, we evaluated the relationship between the experimentally determined and predicted water content at each aw (Fig. 7) and found the values were in moderate agreement (RMSE = 7.66, MAPE = 21.2, and R2 = 0.777; n = 90). A large difference between the calculated and predicted values was observed in the high-water content (high aw) region. This is because the BET model (applicable in the low and intermediate aw-regions) was applied as the predictive approach. The prediction was greatly improved when the water content range was limited to < 20 g/100 g-DM (RMSE = 1.68, MAPE = 17.5, and R2 = 0.886; n = 73).
Effect of amorphous water-soluble electrolytes and water-insoluble carbohydrates on the awc-predictive approach.
The awc-predictive approach was established with the assumption that the materials were amorphous water-soluble carbohydrates. Thus, we evaluated whether this awc-predictive approach is also applicable to other carbohydrates and carbohydrate-based materials.
The experimentally determined Tgs and awc and predicted awc of the amorphous electrolytes and carbohydrate-electrolyte mixtures are listed in Supplemental Data (Table S3; see J. Appl. Glycosci. Web site) [17,29]. The relationship between the experimentally determined and predicted awc is shown in Fig. 8. The experimental and predicted awc values of calcium maltobionate (CaMb) and CaMb-maltose mixtures were almost similar. CaMb is composed of a divalent cation (Ca2+) and two maltobionate ions. Maltobionate consists of glucose and gluconate. Because the CaMb and CaMb-maltose systems comprise carbohydrate and carbohydrate-related (hydrogen-bonding system) parts, the contribution of electrostatic interactions in them is weak. Thus, the awc-predictive approach established by amorphous water-soluble carbohydrates can be applied to them as well. The predicted awc of HMb (maltobionic acid), however, showed a large deviation from its experimentally determined value owing to large electrostatic interactions.

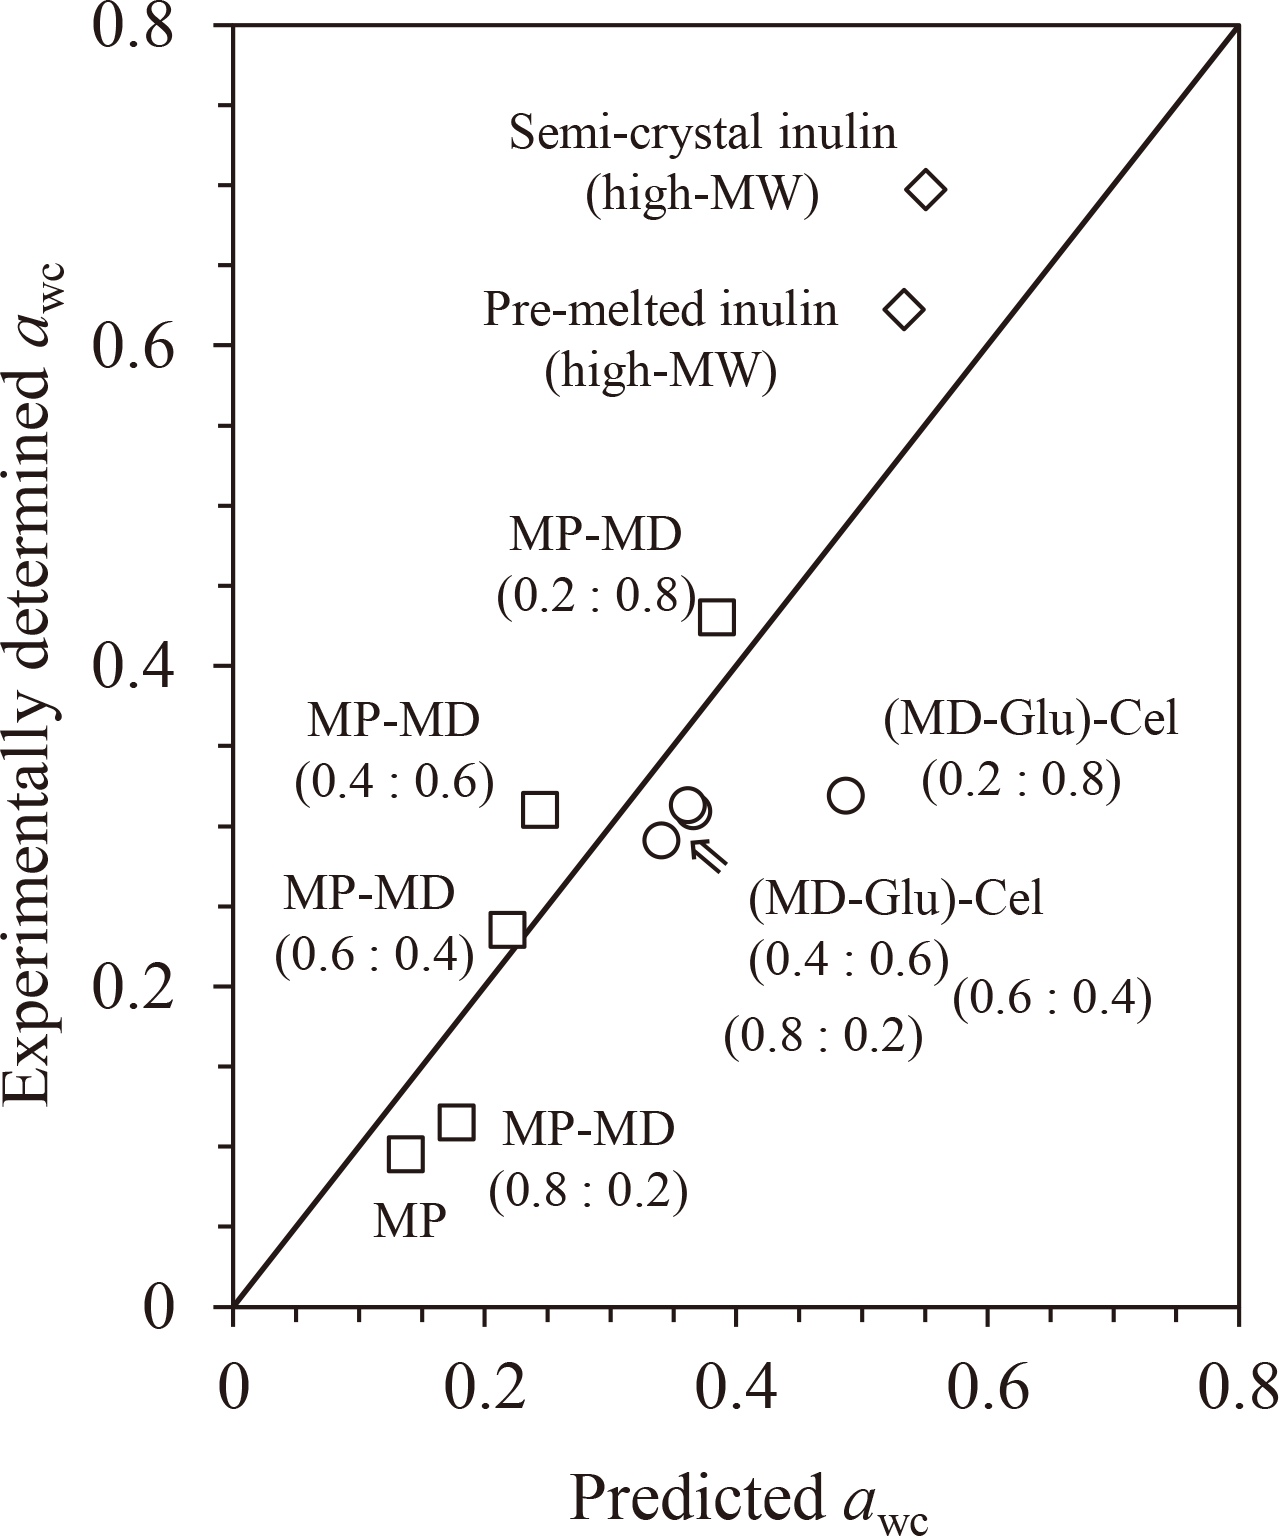
The experimentally determined Tgs and awc and the predicted awc for partially water-insoluble carbohydrates are listed in Supplemental Data (Table S4; see J. Appl. Glycosci. Web site)[4,7,18]. The relationship between the experimentally determined awc and the predicted awc is shown in Fig. 9. The higher the water-insoluble content, the larger the deviation in the prediction. For example, the values of semi-crystalline inulin (high-MW), which contains water-insoluble (crystal) parts, showed a larger deviation than those of pre-melted inulin (high-MW). In the case of (maltodextrin (MD)-glucose)-cellulose samples (MD-glucose mixture at 0.2 dry weight fraction of glucose was mixed with crystalline cellulose at 0.8, 0.6, 0.4, and 0.2 dry weight fractions of cellulose), the awc of the sample containing 0.8 dry weight fraction of cellulose showed the largest deviation from the predicted value. These large deviations originate from the different physical significance of water content and aw. Water content (g/g-DM) is expressed as the amount of water per amount of total dry matter, including water-insoluble materials. However, aw is mainly affected by hydrophilic materials and/or parts; there is little or no contribution from water-insoluble materials and/or parts. Thus, the water content at each aw value decreased intrinsically with an increase in the ratio of water-insoluble materials and/or parts. As a result, the effect of Tgs on the GAB parameters differed from that of the awc-predictive approach established using water-soluble carbohydrates. If the unit of equilibrium water content is changed from “g/g-DM” to “g/g-hydrophilic matters,” a better awc prediction will be achieved.