On Molecular Dynamics Simulations of Silicate Melt/Glass−Molecular Simulations of Inorganic Compounds−
Article ID: 2022-0012

Details
Article ID: 2022-0012
無機化合物のMD計算を念頭において,高分子様の構造を持つ無機凝集体について構造などの概要を示し,古典分子動力学法による2元系ケイ酸塩溶融体/ガラスの計算における構造緩和の問題を述べる.また無機凝集体のMD計算の困難さ,意義,および必要性について述べる.
Structural features of inorganic polymer, oxoate compounds like silicate, are described. Then molecular dynamics simulations of sodium silicate melt / glasses were carried out using an empirical inter atomic potential model. The behavior of the energy and structural relaxation were investigated. The Q-species (the most important characters describing structure of silicate) change during an (NPT)-MD, show no obvious systematic change even in the clear energy relaxation. The difficulty of discussing the relation between energy-structure relaxation was shown. The necessity of computational methods of inorganic solids are discussed.

Enthalpy (●) and density (◆) as function of temperature of the N18000 system of Na2O·2SiO2 melt/glass. The arrow indicate the direction of relaxation with time in (NPT)-MD calculations.
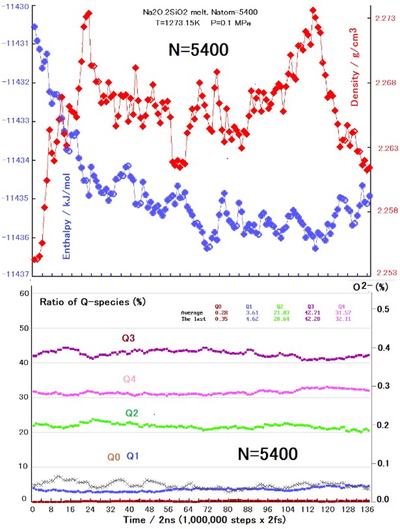
Results of (NPT)-MD calculations at 1273. 15 K and 0.1 MPa of N5400 system. Enthalpy and density are plotted in upper graph, and Q-species and O2- ratio (×) are plotted in lower graph.

Results of (NPT)-MD calculations at 1273.15 K and 0.1 MPa of N9000 system. Enthalpy and density are plotted in upper graph, and Q-species and O2- ratio (×) are plotted in lower graph.

Results of (NPT)-MD calculations at 1273.15 K and 0.1 MPa of N18000 system. Enthalpy and density are plotted in upper graph, and Q-species and O2- ratio (×) are plotted in lower graph.

Results of (NPT)-MD calculations at 1273.15 K and 0.1 MPa of N36000 system. Enthalpy and density are plotted in upper graph, and Q-species and O2- ratio (×) are plotted in lower graph.

Qn distribution of Na2O·2SiO2 melt/glass as a function against temperature. MD calculated molar fractions of Qn species of the N18000 system are displayed.
| Basic cell | ||
| System | No. atoms | Edge length/Å(1273.15 K) |
| N5400 | 5400 | 43.13 |
| N9000 | 9000 | 51.19 |
| N18000 | 18000 | 64.48 |
| N36000 | 36000 | 81.43 |
| T/K | Q0 | Q1 | Q2 | Q3 | Q4 |
| 1773.15 | 0.24 | 3.93 | 21.52 | 44.40 | 29.90 |
| 1673.15 | 0.38 | 4.16 | 21.03 | 43.73 | 30.69 |
| 1573.15 | 0.24 | 3.56 | 20.96 | 45.96 | 29.28 |
| 1473.15 | 0.33 | 3.25 | 21.88 | 43.88 | 30.66 |
| 1373.15 | 0.17 | 3.89 | 20.19 | 45.92 | 29.83 |
| 1273.15 | 0.16 | 3.81 | 20.14 | 45.79 | 30.09 |
| 1173.15 | 0.16 | 3.27 | 20.60 | 46.00 | 29.98 |
| 1073.15 | 0.19 | 3.45 | 20.08 | 45.67 | 30.62 |