Abstract
In 2018, heatwaves (HWs), defined as a period of abnormally hot weather with a daily maximum temperature (T_Max) exceeding its 95th percentile threshold for at least 3 consecutive days, were prevalent from June through August, and temperature records exceeded the reference values in many countries over East Asia (EA), including China (CH), Japan (JP), and the Korean Peninsula (KP). Particularly, extreme HWs from July through August lasted for the longest duration of 21.3 days, with T_Max reaching 36.9°C. The highest T_Max recorded since 1907 was 41°C in Hongcheon, located east of Seoul in the KP. Here, we examined the factors that influenced the 2018 HW, and how these relate to the 1994 HW, which was the second longest HW recorded in the KP. The results showed that abnormally strong and northwestward extended anticyclone features observed in July 2018 lasted as a persistent North Pacific anticyclone anomaly until August 2018, centered at the northern KP. These anticyclone features subsequently formed a modon-like blocking, with a cyclonic anomaly in the East China Sea. In August 1994, the North Pacific High (NPH) extended to eastern EA, which broke down the meridional dipole structure and HWs did not persist. The NPH, which persisted until August 2018, was accompanied by a sinking motion, suppression of precipitation, anomalous maximum temperature, weakening of the westerly jet stream, and increased insolation due to clear sky. We found that the prolonged and northwestward-shifted NPH, including the KP, drove the extraordinarily hot 2018 summer in Korea. In addition, low precipitation and massive evapotranspiration with persistent insolation in July 2018 influenced the dry condition at the surface. We suggest that the predictions for the location and duration of the NPH associated with the HWs are required to reduce heat-related mortality and the impact on agriculture because of excessive evapotranspiration.
1. Introduction
According to the World Meteorological Organization (WMO), based on the WMO report regarding the state of the global climate in 2018 (World Meteorological Organization 2019) published on the website “https://library.wmo.int/doc_num.php?explnum_id=5789”, severe heatwaves (HWs) occurred across the Northern Hemisphere in the summer of 2018. HWs caused by extreme weather events have been a serious issue in the past few decades (Meehl and Tebaldi 2004; Luber and McGeehin 2008). They result in economic ramifications, increase in the mortality rates of elderly individuals, and severe decline in crop yields (Piao et al. 2010; Reidsma et al. 2010; Seneviratne et al. 2012; Fischer and Knutti 2013; Lee and Min 2018).
Several studies have described HWs caused by large-scale atmospheric circulation and thermal effects in the tropics and extratropics (Wang et al. 2000; Yoo et al. 2004; Ding et al. 2010; Liu et al. 2015). For example, one of the factors that influences HWs over East Asia (EA) is the North Pacific High (NPH), which directly affects the large-scale atmospheric circulation system (Park and Schubert 1997; Kim et al. 2012b; Wang et al. 2014; Wang et al. 2016; Chen et al. 2019). Liu, Q. et al. (2019) reported that the decadal variation of the western Pacific subtropical high (WPSH) is linked to summer HWs in East China. The Pacific-Japan pattern leads to a strengthening and westward shift of the WPSH (Sun et al. 2018), which can also contribute to extremely high temperatures in Northeast China (Kim et al. 2012a; Wang et al. 2013; Tao and Zhang 2019; Xu et al. 2019). Furthermore, Chen et al. (2019) demonstrated that the circulation over the western North Pacific is modulated by the wind direction due to the reduction in the sea surface temperature over the Indian Ocean. Along with large-scale atmospheric circulation, the blocking associated with long-lasting anticyclonic circulation is related to warm extremes in the mid-latitudes (Pfahl and Wernli 2012; Ruti et al. 2014). Lee and Lee (2016) analyzed the relationship of HWs in Korea with El Niño and the Arctic Oscillation (AO). They suggested that the relationship between El Niño and Korean HWs has weakened, whereas that between AO and Korean HWs has strengthened in recent years. Yeh et al. (2018) studied the physical mechanisms of HWs over the Korean Peninsula in 2016, which occurred from the blocking in the downstream region of Korea due to the strong convection induced by warm sea surface temperature (SST) anomalies over the western subtropical Pacific. Yoo et al. (2004) reported that tropical SST anomalies caused abnormally cool and warm summers over EA in 1993 and 1994, respectively. Kim et al. (1998) showed that HWs in 1994 over the Korean Peninsula were affected by the NPH due to the stagnation of the typhoon “Vanessa”. Kim et al. (2006) also mentioned the significant relationship between weather-related deaths and HWs. They mentioned that the causes of HWs in 1994 were increased insolation with NPH and soil moisture shortage due to the drought condition.
EA experienced an unusually hot summer in 2018, which caused severe adverse societal impacts and considerable damage to ecosystems (Imada et al. 2019; Liu, B. et al. 2019; Shimpo et al. 2019; Tao and Zhang 2019; Xu et al. 2019). Historical temperature records surpassed the reference range in many countries. For example, the daily maximum temperature (T_Max) reached 37.3°C in Shenyang, located in the southern region of Northeast China, and 41.1°C in Kumagaya, located in the north of Tokyo, Japan. The Korea Meteorological Administration (KMA) also reported that the highest daily T_Max and minimum temperatures exceeded 41°C in Hongcheon and 30°C in Gangneung, respectively, which are historical temperature records since 1907 for South Korea. Furthermore, according to the annual report of Korea Centers for Disease Control and Prevention on notified patients with heat-related illnesses in Korea, 4,526 heat-related illnesses and 48 heat-related mortalities were reported in South Korea. The KMA report titled “Characteristics of Heat Wave Current Status and Prospect and Chang-ma (2018)”, released on the website http://www.kma.go.kr/notify/press/reqional_list.jsp?bid=press2&mode=view&num=9701, stated that HWs were caused by the early cessation of the rainy season (Chang-ma). Shimpo et al. (2019) stated that the 2018 rain event terminated early with the northward shift of the stationary Baiu front because of re-enhancement of the North Pacific subtropical high. Liu, B. et al. (2019) reported that the 2018 northward shift of the North Pacific high was the record-breaking experience on Earth since 1958. In model experimental studies on the 2018 HWs, Imada et al. (2019), based on the results of a large-ensemble simulation, argued that the extremely high temperatures over Japan in July would not have occurred without anthropogenic global warming. Nishi and Kusaka (2019) used numerical modeling to simulate daytime high-temperature events in the urban areas of Kumagaya, Japan.
This study aimed to examine the frequency, duration, and amplitude in terms of sub-seasonal characteristics and the possible effect of evapotranspiration (ET) during July and comparisons of trends in the HWs over EA. We also sought to identify the physical mechanisms of the 2018 extraordinary HWs in Korea compared with the HWs during 1994, an another extremely hot summer.
This study is categorized into the following sections: Section 2 describes the data and definition of HWs. Section 3 discusses the features of the 2018 HWs. Section 4 provides an overview of the causes of 2018 and 1994 HWs, associated with the large-scale atmospheric circulation. Section 5 provides the conclusions of this study.
2. Data and methods
2.1 Data
To detect HWs for summer (June to August) over a 40-year period from 1979 to 2018, we used the global gridded daily T_Max data from the Climate Prediction Center (CPC), available on the website of the NOAA/OAR/ESRL PSD, Boulder, Colorado, USA (https://www.esrl.noaa.gov/psd/data/gridded/data.cpc.globaltemp.html), with a horizontal resolution of 0.5° × 0.5°. We examined the causes of HWs by using the European Centre for Medium-Range Weather Forecasts' ERA-Interim data (Dee et al. 2011) and the ET (i.e., the sum of evaporation and transpiration from Earth's surface to the atmosphere) data retrieved from Terra/Moderate Resolution Imaging Spectroradiometer (MODIS) satellite observations (Running et al. 2017). The ERA-Interim data are daily mean, with a horizontal resolution of 0.5° × 0.5°, and the MODIS ET is an 8-day composite dataset product produced at 500-m pixel resolution. We also analyzed the number of heat-related illnesses and deaths based on the Korea Centers for Disease Control and Prevention's annual report on notified patients with heat-related illnesses in Korea on the website http://www.cdc.go.kr/CDC/cms/content/mobile/18/143918_view.h tml (in Korean).
2.2 Definition of heatwaves
Commonly, HWs are defined as a persistent occurrence of consecutive hot days. Various temperature metrics have been used to define an HW event, including daily T_Max, daily minimum temperature, and daily mean temperature (Della-Marta et al. 2007; Mazdiyasni and Aghakouchak 2015; Tong et al. 2014; Chen and Li 2017). In this study, we determined the 95th percentile threshold by using CPC daily T_Max for a total of the targeted 40 years × 92 days. According to Perkins et al. (2012), an HW is defined as a period of abnormally hot weather, with the T_Max exceeding its 95th percentile threshold for at least 3 consecutive days. In addition, we focused on the total number of HW days (HWD), the frequency of HW events (HWF), and the highest temperature (amplitude) for HW events (HWA) for a specific day from June to August (Fischer and Schär 2010; Seo et al. 2018). In this study, an HW event denotes a consecutive HW.
3. Identification of heatwaves over East Asia
3.1 Status of heatwaves over East Asia
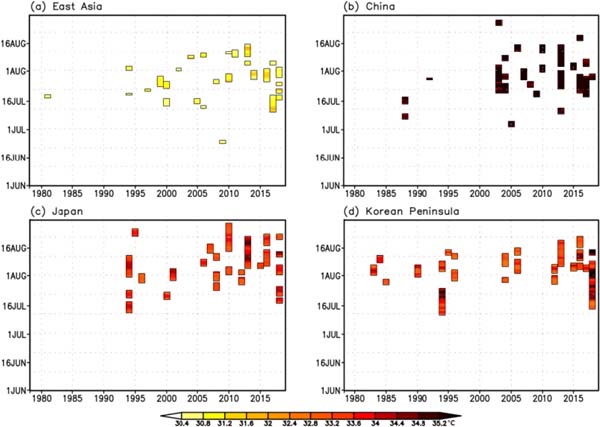
To identify the features of HWs over EA, the three heat wave parameters HWD, HWF, and HWA and their linear trends during the summer from 1979 to 2018 were examined (Fig. 1). HWs occur throughout EA, and, therefore, HWD centers are located over central east China, south of Japan, and the Korean Peninsula (Fig. 1a). The spatial distribution of HWF is consistent with that of HWD (Fig. 1b). Increasing trends also appear over the regions where large HWD and HWF occur (Figs. 1d, e). To compare the regional differences with high and increasing HWs, we selected specific areas, such as EA (EA; 100–145°E, 20–45°N), central East China (CH; 118–123°E, 28–32°N), western Japan (JP; 130–135°E, 32–36°N), and the Korean Peninsula (KP; 125–130°E, 34–38°N). Based on the above definition of HWs, details of HWD, HWF, and HWA in the four regions are provided in Fig. 1g, 1h, and 1i, respectively. The time series of the area-averaged HWD show a slightly increasing trend over not only EA but also CH, JP, and the KP (Fig. 1g). Relatively intense HWs occur occasionally over CH, JP, and the KP (Figs. 1g, h). Particularly, HWs in 1994 and 2018 were extraordinary episodic events that lasted longer than usual over the KP. The HWA shows a high temperature, exceeding 34°C, in regions where HWD and HWF are also high (Fig. 1c), and the increasing trend of the HWA is coincident with that of HWD and HWF (Fig. 1f). For HWs occurring over EA, there is an increase in the trend of intense HWs (Fig. 1i). The first and second records of HWD, HWF, and HWA over each region are detailed in Table 1. In CH, the longest and hottest year was 2013 for HWD and HWA. In the KP and JP, the longest and most frequent HWs were recorded in 2018. The highest intensity of HWs was recorded at 36.9°C in 2018 in the KP and at 35.6°C in 1994 in JP. In 2018, HWs occurred frequently over JP, whereas longer duration events were observed over the KP. Moreover, the highest HWA was recorded during 2018 over the KP at 36.9°C and during 1994 over JP at 35.6°C (Fig. 1i). In the second record, the duration and amplitude of HWs were recorded in 1994 in the KP. In the KP, prolonged and intense episodic events occurred during 1994 and 2018. In the following analysis, we compared the characteristics of long-lasting HWs for 2 events as 2018 and 1994, the first and second records of severe HWs in the KP.
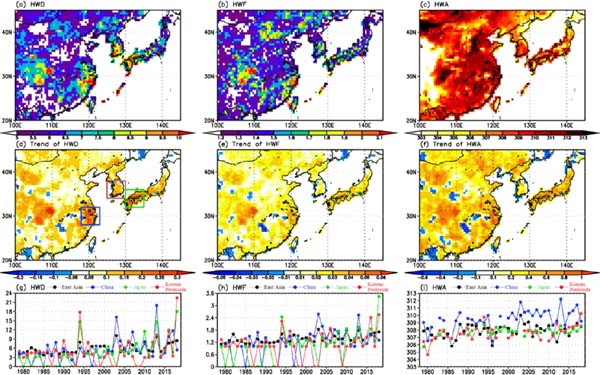
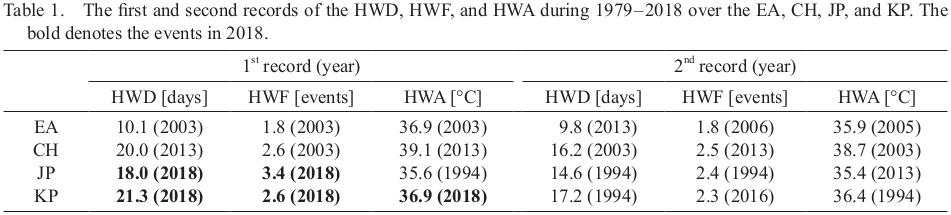
Table 1.The first and second records of the HWD, HWF, and HWA during 1979–2018 over the EA, CH, JP, and KP. The bold denotes the events in 2018.
3.2 Comparison between HWs of 1994 and 2018
Figure 2 shows the occurrence of the identified HWD for an averaged area of EA, CH, JP, and the KP during the summer from 1979 to 2018. The HWs over EA and CH tended to gradually increase in frequency and duration after 2000, and they occurred mainly during mid-July to mid-August (Figs. 2a, b). The amplitudes of the HWs over EA and CH extended from 30.2°C to 31.6°C and from 35°C to 38°C, respectively. In CH, the T_Max recorded during HWs was higher than that in other regions. Over JP, HWs have increased since the 1990s and they occurred from late-July to late-August (Fig. 2c). A study on the relationship between HWs and intraseasonal oscillation has shown that the HW characteristics over the KP and JP have lasted longer than those over other regions (Hsu et al. 2017). The distribution of T_Max in HWs over JP ranges from 33°C to 34.8°C. The HWs over the KP usually have a shorter temporal duration, from late-July to mid-August, whereas in 1994 and 2018, they initiated from mid-July and lasted longer (Fig. 2d). Especially, the intensity of HWs during July 1994 and 2018 was as high as August. In 2018, the longest HWDs over the KP and JP were 21.3 and 18 days, respectively, and they started on July 25 and 18, respectively. HWs in 1994 over the KP and JP started from mid-July. HWs in 1994 over the KP were typically longer, whereas HWs did not persist over JP. Particularly, T_Max during HWs in 1994 and 2018 over the KP exceeded 35.2°C from late July. In both cases, the HWs started early in mid-July. Although HWs in 1994 ended in late July, HWs in 2018 lasted until early August. In the following, we focus on intense and prolonged HWs that occurred over the KP from mid-July 2018 and investigate the characteristics of strong HWs in comparison with the 1994 HWs, an extremely hot summer.
With extraordinary HWs over the KP in 2018, the number of heat-related illnesses and deaths increased by 3.4 and 4.8 times over the last 4 years, respectively (Table 2). Especially, in July (August), the number of heat-related illnesses and deaths increased by 3.8 (3.3) times and 6.1 (1.5) times over the last 4 years, respectively, to 3,095 (1,252) and 43 (4) times. In 2018, the number of heat-related illnesses dramatically increased from mid-July to August. It can be seen that the prolonged HWs, which began in July, could be the cause for most heat-related illnesses and deaths.
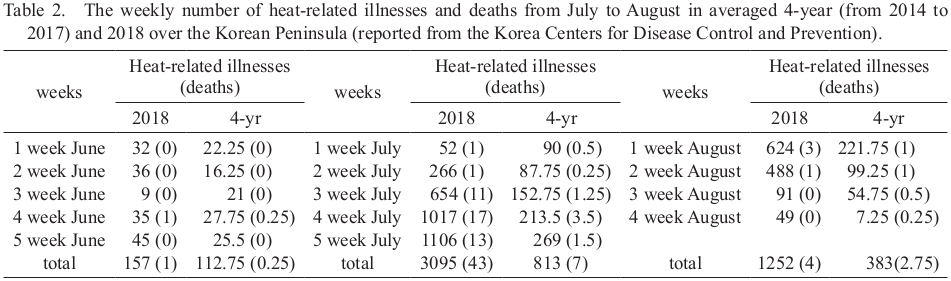
Table 2.The weekly number of heat-related illnesses and deaths from July to August in averaged 4-year (from 2014 to 2017) and 2018 over the Korean Peninsula (reported from the Korea Centers for Disease Control and Prevention).
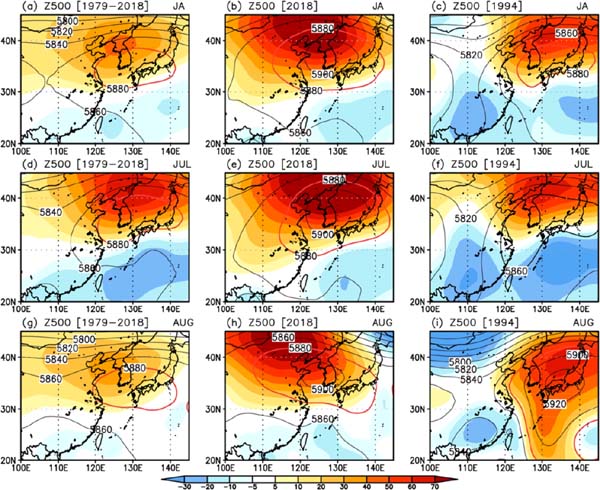
To examine the typical spatial pattern during HWs, the composite of mean and anomalies (mean – total mean) of the geopotential height at 500 hPa were recorded for HWs occurring in the KP (Fig. 3). The long-term means (climatology for June to August) are based on the data from 1979 to 2018. In July-August, a meridional dipole pattern with negative anomalies over the South China Sea and positive anomalies over northeastern EA was observed (Fig. 3a). The meridional dipole pattern was further enhanced in July than August (Figs. 3d, g). The anomalous anticyclone extended over the north of the KP in July moved westward in August (Figs. 3d, g). In 2018, a stronger NPH developed across the 30°N latitude and showed more northwestward extension, strengthening from July to August (Figs. 3e, h). From July, the NPH pattern was further intensified and was as strong as that in August, called as an August-like pattern. The northwestward extended NPH persisted in August, still maintaining its intensity and structure. In contrast to 2018, the NPH was relatively weaker and centered on the northeast of the KP in 1994 (Fig. 3c). The meridional dipole pattern appeared zonally elongated in July; however, its structure collapsed due to the northward strengthening of the NPH in August (Figs. 3f, i). In summary, the large-scale atmospheric circulation anomaly over the northeastern part of EA in 2018 obviously intensified, and this anticyclonic anomaly was stronger and more persistent from July to August compared with 1994.
4. Possible causes of heatwaves in 2018
4.1 Large-scale circulation with blocking
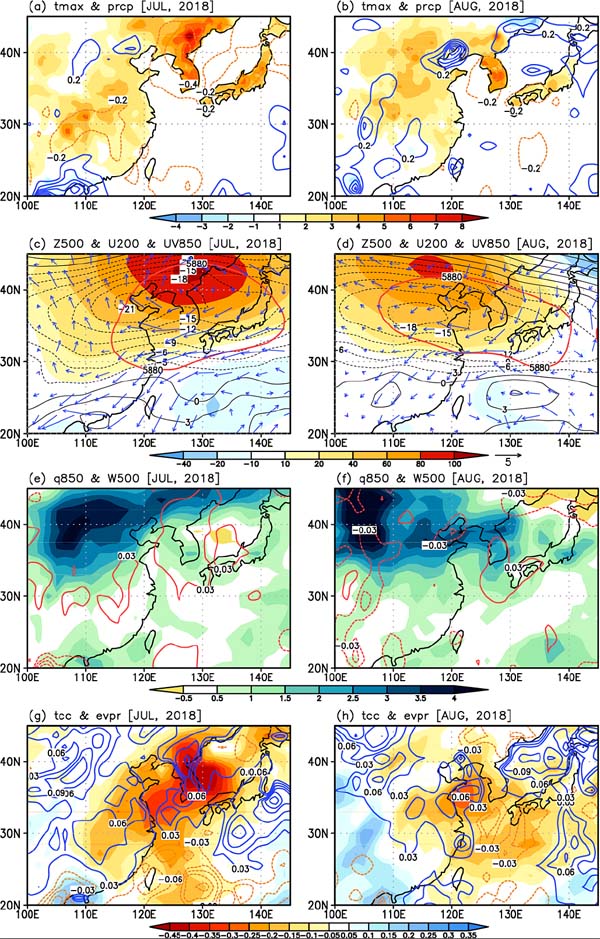
To identify the physical mechanism of HWs in 2018 associated with large-scale atmospheric circulation, the composite anomalies of T_Max, precipitation, geopotential height at 500 hPa (Z500), zonal wind at 200 hPa (U200), specific humidity at 850 hPa (Q850), vertical velocity at 500 hPa (W500), total cloud cover (tcc), and evaporation (evpr) were calculated for HWs occurring over the KP (Fig. 4). In July, the warm anomalies of T_Max were widely seen over EA and the warm core that existed over the KP was consistent with the suppression of precipitation (Fig. 4a). It was also accompanied by the positive anomalies of Z500 in the northern EA. A meridional dipole structure with anticyclonic anomalies over the northern EA and cyclonic anomalies over the East China Sea, known as modon-like blocking (Haines and Marshall 1987), was intensified, as the westerly jet stream moved northward and weakened (Fig. 4c). Yun et al. (2011) describes that this NPH in August was accompanied by the northward shift of the Asian jet-induced blocking by Rossby wave. The structure of anticyclonic anomalies in July, which appeared to be as strong as the anticyclonic anomaly pattern in August, led to the following conclusion. The positive moisture anomalies transported by southeasterly winds over northwestern EA and the sinking motion with the expansion of NPH covered the surrounding KP (Fig. 4e). The decreased cloud cover around the center of EA was accompanied by an increase in insolation and evaporation with the depletion of precipitation (Figs. 4a, g). These induced favorable conditions for HWs to occur. Moreover, during August, Figs. 4a and 4b indicates that the center of largest positive T_Max anomalies accompanied by negative precipitation anomalies shifted from the north of the KP in July to southern part of the KP in August. Anticyclonic anomalies expanded maintaining the modon-like blocking structure from July, whereas the center moved northwestward (Fig. 4d). The northward shifted westerly jet stream sustained, and its intensity increased slightly near 36°N than that of July. Although the positive moisture anomaly increased at 850 hPa around the KP by northeasterly wind, the sinking motion caused by the expansion of NPH during July blocked the cloud formation. In addition, the increase in evaporation was induced by the high insolation under low cloud conditions (Figs. 4f, h). Recent studies have explained that warmth and moisture contribute to the daytime high temperature due to the suppression of radiation cooling during the night-time (Um et al. 2007; Ha and Yun 2012). This suggests that not only the northwestward expansion and development of NPH with sinking motion but also the warming by moisture effect is an essential factor in inducing HWs.
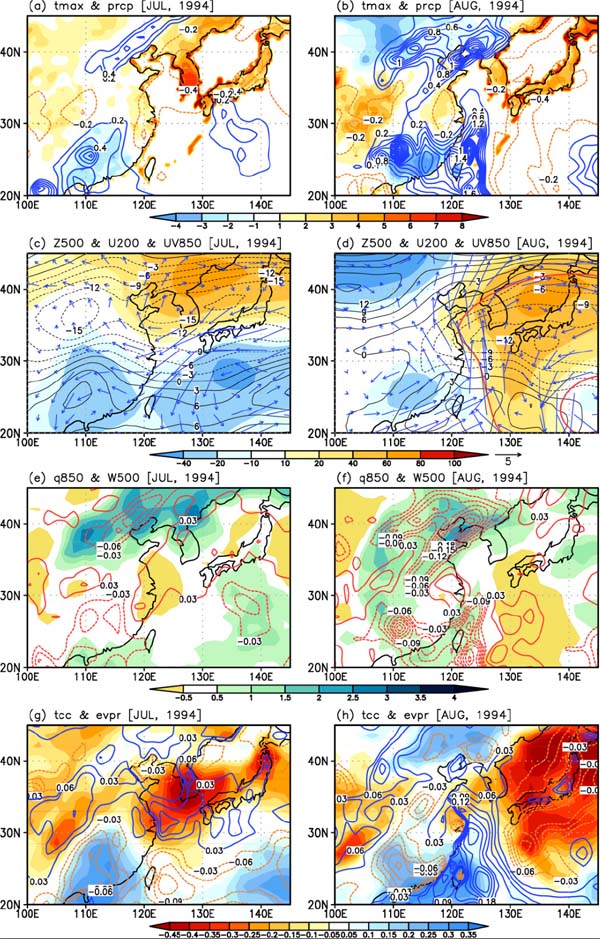
We examined the typical structure of atmospheric circulation during the second longest and highest intense HWs recorded in 1994. The positive temperature anomalies appeared over the southern KP and the precipitation depleted in the vicinity of 30–40°N (Fig. 5a). In July 2018, the NPH did not extend to the KP, but a modon-like blocking structure existed (Fig. 5c). It produced a northward displacement of the westerly jet stream in mid-latitude, causing static atmospheric circulation. Although there were positive moisture anomalies north of 35°N, a sinking motion appeared with anticyclonic circulation (Fig. 5e). Clear sky appeared around the KP with anticyclonic anomalies and was accompanied by increased evaporation (Fig. 5g). The explanation for major patterns associated with HWs in the KP is similar to those of July 2018, but values from the variables were small. In August, warm anomalies appeared in the vicinity of 30–40°N, and the warm core moved eastward compared with that in July 1994 (Figs. 5a, b). The positive precipitation anomalies increased most of land, but the negative precipitation anomalies were consistent with the warm anomalies (Fig. 5b). The NPH developed toward eastern EA, showing a broken meridional dipole structure, and the westerly jet stream shifted to the south and intensified (Fig. 5d). Along the western edge of the NPH, positive moisture anomalies were transported by the southeasterly winds over northwestern EA (Fig. 5f). Rising motion occurred over continental EA, coinciding with the increasing precipitation. The negative anomalies of cloud cover still existed over eastern EA and evaporation increased around the KP (Fig. 5h). These conditions did not meet the favorable conditions associated with the formation of HWs over the KP because of the northeastern expansion of NPH in August 1994. This suggests that HWs in the KP must have been affected by the anticyclonic circulation related to the NPH from July to August in 2018. We need to further examine the static atmosphere in mid-latitude to occur HWs due to the modon-like blocking accompanied by the northwestward expansion and development of NPH from July to August 2018 over the KP.
4.2 Seasonal evolution of stationary waves
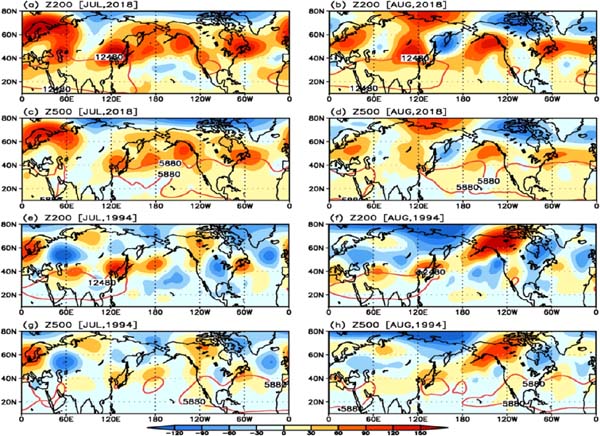
We examined the seasonal evolution of the stationary wave associated with modon-like blocking (Fig. 6). It shows the spatial distribution of the mean and the anomaly at 200-hPa and 500-hPa geopotential height. For July and August in 2018, an anomalous high in the upper-level, known as a heat-dome, stagnated above the mid-latitude across the northern hemisphere and aligned in the zonal direction with 5-core in July and 4-core in August in the vicinity of the mid-latitude (Figs. 6a, b). At the upper level, the anticyclonic circulation exhibited more eastward extension around the Tibetan Plateau (i.e., Tibetan high) to 150°E including EA (Fig. 6a). During August, the Tibetan high, which can be identified by the geopotential height contour 12,480 m at 200 hPa, strengthened and moved eastward at mid-latitudes and the anomalous high persisted over EA (Fig. 6b). The anticyclonic flow over the North Pacific (i.e., NPH) at 500 hPa expanded and strengthened northwestward up to 120°E at mid-latitude, including the KP in July (Fig. 6c). These features are similar to the vertical atmospheric structure associated with the KP HWs suggested by Hong et al. (2018). They also emphasized the roles of the anomalous high in the upper and lower levels accompanied by anomalous easterly winds around the KP. The center of the NPH intensified and moved southward over the KP in August (Fig. 6d). In the summer of 2018, both the Tibetan high and the NPH strengthened and developed until the KP. These two highs expanded over the KP and were associated with the sinking motion, which contributed to the warm conditions that could lead to HWs. In 1994, the Tibetan high was similar to that in 2018, but the NPH was weaker and did not extend to the KP (Figs. 6e–h).
We further analyzed the seasonal evolution of the mid-latitude stationary waves for 2018 and 1994, when extraordinary HWs occurred (Fig. 7), which showed the vertical-longitude cross-section of the eddy height was recorded at 40°N. The summers of 2018 and 1994 have been characterized by zonally elongated upper and mid-level anticyclonic flow along the global longitude with a wavenumber 4 structure (Fig. 7). Particularly, the stationary wave in the Tibetan high and NPH intensified over EA in the vicinity of 120°E in July (Fig. 7c). During July 2018, the August-like stationary wave eddy height indicated an unusual seasonal evolution in the mid-latitude. The seasonal evolution in August 2018 was maintained as it developed westward (Fig. 7e). When we compared to 2018, the zonally elongated anticyclonic eddies were weaker (Figs. 7d, f).
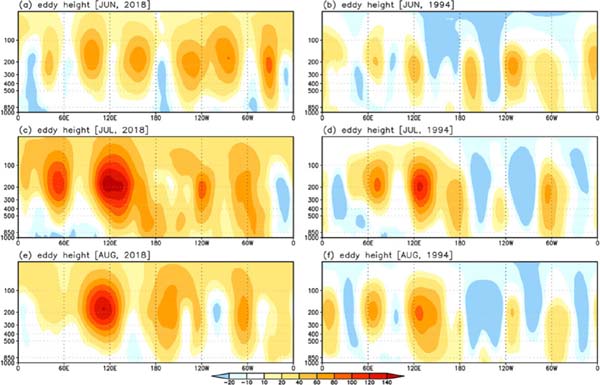
It appears that the Tibetan high and NPH develop over the KP because of weakening and northward shift of the westerly jet stream in both 2018 and 1994 July. Although the intensity of Tibetan high and NPH in 2018 is relatively stronger than those in 1994, both years had a stagnant heat-dome at the mid-latitude and concurrent HWs. Notably, NPH expanded the northwestward, including the KP, in 2018 August, whereas it did not extend to the KP in 1994 August. The modon-like blocking induced by the stationary wave over EA, which persisted until August 2018, was accompanied by a sinking motion, an increase in incoming shortwave radiation, and a decrease in precipitation. Therefore, HWs occurred continuously from July to August of 2018.
4.3 Effects of evapotranspiration
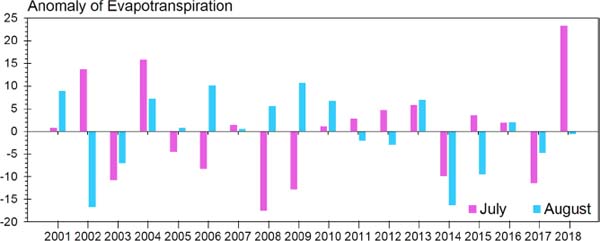
Despite the warm and moist air from the south, the sinking motion accompanied by the northwestward expansion of NPH caused the suppression of precipitation. During the summer of 2018, the mean (anomalous) rainfall and rainy days were 343.4 mm (−12.7 mm) and 7.7 days (−9.4 days), respectively, which were lower than the reference values. From the viewpoint of the surface water balance, we consider precipitation and ET as representative of water supply and consumption, respectively. The positive ET anomaly in July 2018 was the largest at 23.5 mm in the past 18 years (Fig. 8). It can be interpreted that the extreme heat caused by the large-scale circulation during July 2018 resulted in large water consumption on the surface. The dry condition at the surface was accompanied by the sinking motion and incoming radiation. In July 2018, the HWs with excessive ET caused the hottest temperature, which was as high as that in August. Although, the ET anomaly was small in August 2018, it might be considered that the drought condition continued because of less precipitation with severe water consumption on the surface in July. Therefore, the prolonged HWs of 2018 occurred extraordinarily, compounding the reduction of precipitation and drought with over-ET.
5. Summary
In recent decades, the frequency of HWs showed a widespread increasing trend over EA. In summer 2018, the KP experienced extreme heat throughout July and August, with the highest temperature and longest consecutive hot days on record since 1907. We examined the causes of these abnormal temperature patterns and the difference from other episodic events as in 1994.
During the HWs in July 2018, an August-like large-scale atmospheric circulation developed in mid-latitude. This large-scale feature was characterized as zonally elongated anticyclonic flow with wavenumber 4 structure in the upper and mid-level troposphere. Notably, the stationary wave in the upper level anticyclonic flow over the Tibetan Plateau and in mid- and low-level anticyclonic flow over the North Pacific intensified over EA in the vicinity of 120°E. In the mid- and low-level, the anticyclonic anomalies were abnormally strong and northwestward extended features as it was also formed in the meridional dipole pattern with cyclonic anomalies over the South China Sea which, in turn, generated a modon-like blocking. This blocking was accompanied by a sinking motion, suppression of precipitation, anomalously high T_Max, weakening westerly jet stream, clear sky, increase in incoming radiation, acceleration of evaporation, and inflow of warm and moist air at the western side including the KP. In August 2018, the northwestward expansion and development of NPH formed in July retained its structure, maintaining the meridional dipole pattern. The expansion of the NPH with the sinking motion and persistent warming with effect on moisture played a key role in inducing HWs. Therefore, the HWs lasted longer, up to 21.3 days from July to August over the KP.
Different from 2018, the NPH did not extend to the KP in July 1994, but there was a modon-like blocking structure. It produces the northward displacement of the westerly jet stream in mid-latitude, causing static atmospheric circulation accompanied by sinking motion, low precipitation, clear sky, and increased radiation over the KP. In August, the NPH extended to eastern EA with a broken meridional dipole structure and the westerly jet stream shifted to the south. The HWs of 1994 were initiated earlier, but they did not persist for longer than those in 2018.
We suggest that the prolonged HWs in the KP could be affected by the anticyclonic circulation related to the NPH from July to August. Therefore, the modon-like blocking with the northwestward expansion and development of NPH from July to August caused the static atmosphere in the mid-latitudes and seemed to have played a crucial role in the 2018 HWs in the KP. In relation to the northward expansion of the NPH and its association with jet streams, further studies are warranted in the context of vulnerability of HWs and the contribution of anthropogenic causes.
Moreover, the mean (anomalous) amount of rainfall and rainy days were 343.4 mm (−12.7 mm) and 7.7 days (−9.4 days), respectively, in the KP, because of the sinking motion accompanied by the northwestward extended NPH during the summer of 2018. From the viewpoint of the surface water balance, we considered precipitation and ET to represent the water supply and consumption, respectively. The positive ET anomaly in July 2018 was the largest at 23.5 mm in the past 18 years. The strong ET during the increase in incoming radiation influenced the dry condition at the surface, with a reduction in precipitation in July 2018. The results indicate the existence of intense and prolonged HWs with temperatures exceeding 34.4°C that added to the drought with over-ET over the KP in 2018.
Acknowledgments
This study was supported by the Institute for Basic Science (project code: IBS-R028-D1). The work on CHH was supported by the Korea Ministry of Environment under the “Climate Change Correspondence Program”.
References
- Chen, R., Z. Wen, and R. Lu, 2019: Influences of tropical circulation and sea surface temperature anomalies on extreme heat over Northeast Asia in the midsummer of 2018. Atmos. Oceanic Sci. Lett., 12, 238-245.
- Chen, Y., and Y. Li, 2017: An inter-comparison of three heat wave types in China during 1961–2010: Observed basic features and linear trends. Sci. Rep., 7, 45619, doi:10.1038/srep45619.
- Dee, D. P., S. M. Uppala, A. J. Simmons, P. Berrisford, P. Poli, S. Kobayashi, U. Andrae, M. A. Balmaseda, G. Balsamo, P. Bauer, P. Bechtold, A. C. M. Beljaars, L. van de Berg, J. Bidlot, N. Bormann, C. Delsol, R. Dragani, M. Fuentes, A. J. Geer, L. Haimberger, S. B. Healy, H. Hersbach, E. V. Hólm, L. Isaksen, P. Kållberg, M. Köhler, M. Matricardi, A. P. McNally, B. M. Monge-Sanz, J.-J. Morcrette, B.-K. Park, C. Peubey, P. de Rosnaya, C. Tavolato, J.-N. Thépaut, and F. Vitart, 2011: The ERA-interim reanalysis: Configuration and performance of the data assimilation system. Quart. J. Roy. Meteor. Soc., 137, 553-597.
- Della-Marta, P. M., M. R. Haylock, J. Luterbacher, and H. Wanner, 2007: Doubled length of western European summer heat waves since 1880. J. Geophy. Res., 112, D15103, doi:10.1029/2007JD008510.
- Ding, T., W. Qian, and Z. Yan, 2010: Changes in hot days and heat waves in China during 1961–2007. Int. J. Climatol., 30, 1452-1462.
- Fischer, E. M., and S. Schär, 2010: Consistent geographical patterns of changes in high-impact European heat-waves. Nat. Geosci., 3, 398-403.
- Fischer, E. M., and R. Knutti, 2013: Robust projections of combined humidity and temperature extremes. Nat. Climate Change, 3, 126-130.
- Ha, K.-J., and K.-S. Yun, 2012: Climate change effects on tropical night days in Seoul, Korea. Theor. Appl. Climatol., 109, 191-203.
- Haines, K., and J. Marshall, 1987: Eddy-forced coherent structures as a prototype of atmospheric blocking. Quart. J. Roy. Meteor. Soc., 113, 681-704.
- Hong, J.-S., S.-W. Yeh, and K.-H. Seo, 2018: Diagnosing physical mechanisms leading to pure heat waves versus pure tropical nights over the Korean Peninsula. J. Geophys. Res., 123, 7149-7160.
- Hsu, P.-C., J.-Y. Lee, K.-J. Ha, and C.-H. Tsou, 2017: Influence of boreal summer intraseasonal oscillation on heat waves in Asian monsoon area. J. Climate, 30, 7191-7211.
- Imada, Y., M. Watanabe, H. Kawase, H. Shiogama, and M. Arai, 2019: The July 2018 high temperature event in Japan could not have happened without human-induced global warming. SOLA, 15A, 8-12.
- Kim, H.-G., K.-D. Min, I.-H. Yoon, Y.-S. Moon, and D.-I. Lee, 1998: Characteristics of the extraordinary high temperature events occurred in summers of 1987 and 1994 over the Korean Peninsula. J. Korean Meteor. Soc., 34, 47-64.
- Kim, J., D.-G. Lee, I.-S. Park, B.-C. Choi, and J.-S. Kim, 2006: Influences of heat waves on daily mortality in South Korea. Atmosphere, 16, 269-278.
- Kim, J.-S., R. C.-Y. Li, and W. Zhou, 2012a: Effects of the Pacific-Japan teleconnection pattern on tropical cyclone activity and extreme precipitation events over the Korean Peninsula. J. Geophys. Res., 117, D18109, doi:10.1029/2012JD017677.
- Kim, J.-S., W. Zhou, X. Wang, and J. Shaleen, 2012b: El Niño Modoki and the summer precipitation variability over South Korea: A diagnostic study. J. Meteor. Soc. Japan, 90, 673-684.
- Lee, S.-M., and S.-K. Min, 2018: Heat stress changes over East Asia under 1.5° and 2.0°C global warming targets. J. Climate, 31, 2819-2831.
- Lee, W.-S., and M.-I. Lee, 2016: Interannual variability of heat waves in South Korea and their connection with large-scale atmospheric circulation patterns. Int. J. Climatol., 36, 4815-4830.
- Liu, B., C. Zhu, J. Su, S. Ma, and K. Xu, 2019: Recordbreaking northward shift of the western North Pacific subtropical high in July 2018. J. Meteor. Soc. Japan, 97, 913-925.
- Liu, G., R. Wu, S. Sun, and H. Wang, 2015: Synergistic contribution of precipitation anomalies over northwestern India and the South China Sea to high temperature over the Yangtze River Valley. Adv. Atmos. Sci., 32, 1255-1265.
- Liu, Q., T. Zhou, H. Mao, and C. Fu, 2019: Decadal variations in the relationship between the western Pacific subtropical high and summer heat waves in East China. J. Climate, 32, 1627-1640.
- Luber, G., and M. McGeehin, 2008: Climate changes and extreme heat events. Amer. J. Prev. Med., 35, 429-435.
- Mazdiyasni, O., and A. Aghakouchak, 2015: Substantial increase in concurrent droughts and heatwaves in the United States. Proc. Natl. Acad. Sci. U.S.A., 112, 11484-11489.
- Meehl, G., A., and C. Tebaldi, 2004: More intense, more frequent, and longer lasting heat waves in the 21st century. Science, 305, 994-997.
- Nishi, A., and H. Kusaka, 2019: Effect of foehn wind on record-breaking high temperature event (41.1°C) at Kumagaya on 23 July 2018. SOLA, 15, 17-21.
- Park, C.-K., and S. D. Schubert, 1997: On the nature of the 1994 East Asia summer drought. J. Climate, 10, 1056-1070.
- Perkins, S. E., L. V. Alexander, and J. R. Nairn, 2012: Increasing frequency, intensity and duration of observed global heatwaves and warm spells. Geophys. Res. Lett., 39, L20714, doi:10.1029/2012GL053361.
- Pfahl, S., and H. Wernli, 2012: Quantifying the relevance of atmospheric blocking for co-located temperature extremes in the Northern Hemisphere on (sub-) daily time scales. Geophys. Res. Lett., 39, L12807, doi:10.1029/2012GL052261.
- Piao, S., P. Ciais, Y. Huang, Z. Shen, S. Peng, J. Li, L. Zhou, H. Liu, Y. Ma, Y. Ding, P. Friedlingstein, C. Liu, K. Tan, Y. Yu, T. Zhang, and J. Fang, 2010: The impacts of climate change on water resources and agriculture in China. Nature, 467, 43-51.
- Reidsma, P., F. Ewert, A. O. Lansink, and R. Leemans, 2010: Adaptation to climate change and climate variability in European agriculture: The importance of farm level responses. Eur. J. Agron., 32, 91-102.
- Running, S., Q. Mu, and M. Zhao, 2017: MOD16A2: MODIS/Terra net evapotranspiration 8-day L4 global 500m SIN Grid V006. NASA LP DAAC, doi:10.5067/MODIS/MOD16A2.006.
- Ruti, P. M., A. Dell'Aquila, and F. Giorgi, 2014: Understanding and attributing the Euro-Russian summer blocking signatures. Atmos. Sci. Lett., 15, 204-210.
- Seneviratne, S. I., N. Nicholls, D. Easterling, C. M. Goodess, S. Kanae, J. Kossin, Y. Luo, J. Marengo, K. McInnes, M. Rahimi, M. Reichstein, A. Sorteberg, C. Vera, and X. Zhang, 2012: Changes in climate extremes and their impacts on the natural physical environment. Managing the Risks of Extreme Events and Disasters to Advance Climate Change Adaptation Field, C. B., V. Barros, T. F. Stocker, D. Qin, D. J. Dokken, K. L. Ebi, M. D. Mastrandrea, K. J. Mach, G.-K. Plattner, S. K. Allen, M. Tignor, and P. M. Midgley (eds.), Cambridge University Press, 109-230.
- Seo, Y.-W., K.-S. Yun, J.-Y. Lee, Y.-W. Lee, K.-J. Ha, and J.-G. Jhun, 2018: Future changes due to model biases in probabilities of extreme temperatures over East Asia using CMIP5 data. Int. J. Climatol., 38, 1177-1188.
- Shimpo, A., K. Takemura, S. Wakamatsu, H. Togawa, Y. Mochizuki, M. Takekawa, S. Tanaka, K. Yamashita, S. Maeda, R. Kurora, H. Murai, N. Kitabatake, H. Tsuguti, H. Mukougawa, T. Iwasaki, R. Kawamura, M. Kimoto, I. Takayabu, Y. N. Takayabu, Y. Tanimoto, T. Hirooka, Y. Masumoto, M. Watanabe, K. Tsuboki, and H. Nakamura, 2019: Primary factors behind the heavy rain event of July 2018 and the subsequent heat wave in Japan. SOLA, 15A, 13-18.
- Sun, J. Q., J. Ming, M. Zhang, and S. Yu, 2018: Circulation features associated with the record-breaking rainfall over south China in June 2017. J. Climate, 31, 7209-7224.
- Tao, P., and Y. Zhang, 2019: Large-scale circulation features associated with the heat wave over Northeast China in summer 2018. Atmos. Oceanic Sci. Lett., 12, 254-260.
- Tong, S., X. Y. Wang, G. FitzGerald, D. McRae, G. Neville, V. Tippett, P. Aitken, and K. Verrall, 2014: Development of health risk-based metrics for defining a heatwave: A time series study in Brisbane, Australia. BMC Public Health, 14, 435, doi:10.1186/1471-2458-14-435.
- Um, H.-H., K.-J. Ha, and S.-S. Lee, 2007: Evaluation of the urban effect of long-term relative humidity and the separation of temperature and water vapor effects. Int. J. Climatol., 27, 1531-1542.
- Wang, B., R. Wu, and X. Fu, 2000: Pacific-East Asian teleconnection: How does ENSO affect East Asian climate? J. Climate, 13, 1517-1536.
- Wang, W., W. Zhou, X. Wang, S. K. Fong, and K. C. Leung, 2013: Summer high temperature extremes in South-east China associated with the East Asian jet stream and circumglobal teleconnection. J. Geophys. Res., 118, 8306-8319.
- Wang, W., W. Zhou, and D. Chen, 2014: Summer high temperature extremes in Southeast China: Bonding with the El Niño-Southern Oscillation and East Asian summer monsoon coupled system. J. Climate, 27, 4122-4138.
- Wang, W., W. Zhou, X. Li, X. Wang, and D. Wang, 2016: Synoptic-scale characteristics and atmospheric controls of summer heat waves in China. Climate Dyn., 46, 2923-2941.
- World Meteorological Organization, 2019: WMO statement on the state of the global climate in 2018. WMO-No. 1233, 38 pp.
- Xu, K., R. Lu, J. Mao, and R. Chen, 2019: Circulation anomalies in the mid-high latitudes responsible for the extremely hot summer of 2018 over Northeast Asia. Atmos. Oceanic Sci. Lett., 12, 231-237.
- Yeh, S.-W., Y.-J. Won, J.-S. Hong, K.-J. Lee, M. Kwon, K.-H. Seo, and Y.-G. Ham, 2018: The record-breaking heat wave in 2016 over South Korea and its physical mechanism. Mon. Wea. Rev., 146, 1463-1474.
- Yoo, S.-H., C.-H. Ho, S. Yang, H.-J. Choi, and J.-G. Jhun, 2004: Influences of tropical western and extratropical Pacific SST on East and Southeast Asian climate in the summers of 1993–94. J. Climate, 17, 2673-2687.
- Yun, K.-S., S.-Y. Kim, K.-J. Ha, and M. Watanabe, 2011: Effects of subseasonal basic state changes on Rossby wave propagation during northern summer. J. Geophys. Res., 116, D24102, doi:10.1029/2011JD016258.
