Abstract
We made an effort to inspect the raindrop size distribution (RSD) characteristics of Indian Ocean and Pacific Ocean tropical cyclones (TCs) using ground-based disdrometer measurements from observational sites in India and Taiwan. Five TCs (2010–2013) from the Indian Ocean and six TCs (2014–2016) from the Pacific Ocean were measured using particle size and velocity disdrometers installed in south India and south Taiwan, respectively. Significant differences between the RSDs of Indian Ocean and Pacific Ocean TCs are noticed. For example, a higher number of small drops is observed in Indian Ocean TCs, whereas Pacific Ocean TCs have more mid-size and large drops. RSDs of Pacific Ocean TCs have higher mass-weighted mean diameter and lower normalized intercept parameter than Indian Ocean TCs. RSD values quantified based on rainfall rate and precipitation types also showed similar characteristics between Indian Ocean and Pacific Ocean TCs. The radar reflectivity and rainfall rate (Z-R) relations and shape and slope (μ-Λ) relations of both oceanic (Indian and Pacific) TCs are found to be distinctly different. Possible causes for the dissimilarities in RSD features between Indian Ocean and Pacific Ocean TCs are due to relative differences in water vapor availability and convective activity between TCs in these two oceanic basins.
1. Introduction
Tropical cyclones (TCs) are a severe natural hazard that cause significant property damage and loss of life when making landfall, in part due to torrential rainfall. The study of raindrop size distribution (RSD) in TCs can be useful for better understanding cloud microphysics and improving the cloud models (Tokay et al. 2008; Zhang et al. 2006), and assessing rainfall-caused erosivity (Janapati et al. 2019). There have been reports on RSD characteristics of TCs around the globe. Over the Atlantic Ocean, Merceret (1974) found no distinct differences in RSD characteristics between the rainbands and eyewall region of Hurricane Ginger. Additionally, Jorgensen and Willis (1982) did not observed much variation in radar reflectivity and rainfall rate (Z-R) relations between the eyewall and outer rainband regions at 3 km above the surface and below. Using airborne radar and disdrometer measurements, Marks et al. (1993) observed significant differences in the eyewall and outer rainband Z-R relations (eyewall: Z = 253R1.3; outer rainband Z = 341R1.25; total Z = 311R1.27). A clear demarcation in RSD characteristics from before and during the passage of Hurricane Helene (2000) was observed by Ulbrich and Lee (2002), who found that Z-R relations (Z = 118R1.48) of TCs differ from those of tropical Z-R (Z = 250R1.2) and default Z-R relations (Z = 300R1.4). An analysis of seven Atlantic TCs by Tokay et al. (2008) revealed the presence of more small and mid-size drops and fewer large drops, with a maximum diameter seldom exceeding 4 mm. Chang et al. (2009) explored drop shape and RSD characteristics of typhoon rainfall during landfall over north Taiwan and found a maritime convective type RSD for typhoon systems. They mentioned that typhoon convective systems influenced by Taiwan's terrain had RSD features of intermediate to maritime and continental clusters. Radhakrishna and Narayana Rao (2010) explored seasonal variations of cyclonic and non-cyclonic RSD characteristics over southern India and perceived large numbers of small and medium drops with an almost absence of large drops in cyclonic precipitation. With the aid of the Particle Size and Velocity (Parsivel) disdrometer, Chen et al. (2012) analyzed the RSD characteristics of Typhoon Morakot (2009) and noted substantial differences between precipitation characteristics of the eyewall and outer rainbands. Wind profiler and disdrometer observations from Kim et al. (2013) showed strong and weak bright bands in the rainband and eyewall regions of Typhoon Kompasu, respectively. Further, they noticed a higher mass-weighted mean diameter (Dm) in the outer rainband than in the eyewall region. Differences between cyclonic and northeast monsoon thunderstorm rainfall RSDs was detailed by Kumar and Reddy (2013). Over east India, Bhattacharya et al. (2013) noticed stratiform features before and after Tropical Cyclone Aila in the Bay of Bengal. Kumari et al. (2014) illustrated RSD differences between two TCs that passed over southern India. Over Korea, Suh et al. (2016) analyzed the RSD characteristics of nine rainfall groups and noticed smaller Dm and normalized intercept parameter (Nw) values in typhoon rainfall than in other rainfall categories. Higher concentrations of small drops in TC eyewalls and large drops in outer rainband regions was observed over Darwin, Australia, by Deo and Walsh (2016). Wang et al. (2016) demonstrated the microphysical characteristics in the rainbands of Typhoon Matmo (2014) over eastern China using ground-based radar and disdrometer measurements. Kim and Lee (2017) perceived different microphysical characteristics between stratiform and mixed stratiform-convective regimes of the rainbands of Typhoon Bolaven (2012) over South Korea. Janapati et al. (2017) detected clear differences in RSD characteristics in precipitation of TCs from the Bay of Bengal, before and after landfall. Recently, Wen et al. (2018) investigated the RSD characteristics of seven typhoons observed over China, and noticed higher raindrop concentrations and lower rain drop diameters for typhoon convective precipitation than the maritime convective clusters of Bringi et al. (2003).
Thus far in the literature, TC RSD have been limited to case studies or to particular oceanic regions. Additionally, there have been no comparison studies of RSD characteristics between one oceanic region and another. Hence, this study reports on RSD differences between Indian Ocean and Pacific Ocean TCs using Parsivel disdrometer data from stations in southern India and Taiwan. The remainder of this paper is ordered as follows: Section 2 outlines the data and methodology, Section 3 provides results and discussion, and Section 4 gives a summary.
2. Data and methodology
2.1 Tropical cyclones
A total of five Indian Ocean TCs (2010–2013) and six Pacific Ocean TCs (2014–2016) were measured using Parsivel disdrometers at Yogi Vemana University in Kadapa, India (14.4742°N, 78.7098°E, 138 m above sea level) and at Shu-Te University in Kaohsiung, Taiwan (120.3746°E, 22.7621°N, 9 m above sea level). The tracks of these TCs and locations of the disdrometers (indicated by red stars) are shown in Fig. 1. Track information for the Indian Ocean TCs was obtained from the India Meteorological Department (IMD) best track archive (http://www.rsmcnewdelhi.imd.gov.in). Track information for the Pacific Ocean TCs was obtained from the Japan Meteorological Agency (JMA) best track database (https://www.jma.go.jp/jma/jma-eng/jma-center/rsmc-hp-pub-eg/besttrack.html). Table 1 lists the Indian Ocean and Pacific Ocean TCs used in this study, with their names, life span, disdrometer measurement periods, total rain accumulations, and rainfall rate statistics (maximum, mean, and standard deviation). Rainfall amounts for a location are considered to be attributed to TCs if that location is within 500 km of the TC center (Deo and Walsh 2016; Jiang and Zipser 2010; Prat and Nelson 2013; Wu et al. 2015). Hence, in this study, the RSD measurements of selected TCs (as listed in Table 1) from Parsivel disdrometers in south Taiwan and south India are considered for further analysis if the distance between the disdrometer site and the TC center is 500 km or less (Deo and Walsh 2016).

The Parsivel (Löffler-Mang and Joss 2000; Yuter et al. 2006) is a laser-based disdrometer that can simultaneously measure precipitating particle size (liquid particles: 0.2 to 5 mm and solid particles: 0.2 to 25 mm) and fall speed (0.2 to 20 m s−1) and records them in 32 × 32 drop size and fall velocity classes. This instrument has an optical sensor that generates a 650 nm 3 mW laser beam 180 mm long, 30 mm wide, and 1 mm high. A decrease in the laser signal occurs when precipitating particles pass through the light sheet. The signal deviation amplitude is a measure of particle size and the signal deviation duration allows estimation of particle fall velocity. Detailed explanation of the Parsivel disdrometer along with the assumptions used to determine hydrometeor size and velocity can be found in Löffler-Mang and Joss (2000), Battaglia et al. (2010), Jaffrain and Berne (2011), Friedrich et al. (2013b), Tokay et al. (2014) and references within.
Parsivel experiences some instrumental errors in strong wind, marginal effect, and splashing effect conditions. Particles falling through the edges of the sample area appear as small particles moving faster than the empirical relationship between fall velocity and particle diameter, a phenomenon known as the marginal effect. Raindrops that hit the surface of the Parsivel itself break apart and bounce back into the sampling area, a phenomenon known as the splashing effect. To minimize these measurement errors, quality control procedures are applied to disdrometer data. In this study, the first two size bins of disdrometer data are discarded because of their low signal-to-noise ratio. Further, 1-min samples with fewer than 10 drops or rainfall rates less than 0.1 mm h−1 are considered noise and are thus discarded (Tokay et al. 2013). Additionally, raindrops with diameters greater than 6 mm and fall speeds 60 % above or below the Atlas et al. (1973) empirical fall velocity-diameter relation (Jaffrain and Berne 2011) are discarded (Fig. 2). During the passage of TCs at both observational sites, we did not observe any solid precipitation with either disdrometer.

The quality-controlled raw spectra are used to estimate raindrop concentration N (Di) (m−3 mm−1) using the following equation (Friedrich et al. 2013b; Tokay et al. 2014).
To compute
N (
Di) for each diameter class (
i = 1 to 32), number concentrations were summed over all velocity classes (
j = 1 to 32) (
Friedrich et al. 2013b). Here,
nij is the number of drops reckoned in size bin
i (
i = 1 to 32), velocity bin
j (
j = 1 to 32), Δ
t (s) is the sampling time (60 seconds), Δ
Di (mm) is the width of the
ith class diameter,
V(
Di) (m s
−1) = 9.65 − 10.3exp (−0.6*
Di) is the fall velocity of the
ith size bin drops (
Atlas et al. 1973), and
Aeff (m
2) is the effective sampling area expressed by

(
Battaglia et al. 2010;
Löffler-Mang and Joss 2000;
Tokay et al. 2014), in which
Di (mm) is the
ith bin size drop diameter,
L is the length of the Parsivel beam (180 mm), and
B is the width of the Parsivel beam (30 mm).
The rainfall rate R (mm h−1), sixth moment (Rayleigh) reflectivity/radar reflectivity factor Z (mm6 m−3), liquid water content W (g m−3), and total number concentration (Nt, m−3) are derived (Friedrich et al. 2013a, b) by the following expressions.
where,
ρw (1 g cm
−3) is the density of water.
The
nth order moment (in mm
n m
−3) of the drop size distribution can be expressed as
where
n = 3 for the third moment, 4 for the fourth moment, and 6 for the sixth moment of the size distribution.
The mass-weighted mean diameter (Dm, mm), shape parameter (μ, dimensionless), and slope parameter (Λ, mm−1) are obtained (Bringi et al. 2003; Tokay and Short 1996; Ulbrich 1983) from the third, fourth, and sixth moments of the size distribution as
The slope parameter Λ (mm
−1) is given (
Tokay and Short 1996) by
where
μ is the shape parameter (dimensionless) and is given (
Tokay and Short 1996) by
where
G is
The normalized intercept parameter
Nw (mm
−1 m
−3) is defined by
Bringi et al. (2003) as
where
W (g m
−3) represents the liquid water content for the corresponding size distribution.
The mass spectrum standard deviation σm (mm) can be expressed in terms of Dm and N(D) (Thurai et al. 2014; Ulbrich 1983; Williams et al. 2014) as
2.3 MODIS and ERA-Interim data
Along with the disdrometer measurements, Moderate Resolution Imaging Spectroradiometer (MODIS) and European Centre for Medium-Range Weather Forecasts (ECMWF) Interim Re-Analysis (ERA-Interim) datasets over the observational sites in Taiwan (22.75–22.875°N, 120.25–120.375°E) and India (14.375–14.5°N, 78.625–78.75°E) were used for the TCs dates listed in Table 1. Convective available potential energy (CAPE, J kg−1: available every three hours) and vertical integral water vapor (W, kg m−2; available every six hours) from ECMWF ERA-Interim (Dee et al. 2011) with a 0.125° × 0.125° grid resolution are used. Cloud top temperatures (CTT, °C) from the MODIS level 3 data product (Platnick 2015) are used. The level 3 daily data product (MOD08_D3) of MODIS consists of 1° × 1° grid average values of atmospheric parameters related to aerosol particle properties, water vapor, and cloud optical and physical properties. Details about the MODIS cloud product algorithms are provided in Platnick et al. (2003) and King et al. (2003). CTT data, which are available at a 1° × 1° grid resolution, are interpolated to a 0.125° × 0.125° grid resolution.
3. Results
The disdrometers at the observational sites in Taiwan and India recorded a 8392 RSD samples (1-min) for six Pacific Ocean TCs and 3776 RSD samples (1-min) for five Indian Ocean TCs. The variations of mean raindrop concentration (N(D), m−3 mm−1) with drop diameter (D, mm) for Indian Ocean and Pacific Ocean TCs are illustrated in Fig. 3. Throughout this paper, raindrops with diameters of 1–3 mm are considered as mid-size drops, and drops below and above this range are considered, small and large drops, respectively (Janapati et al. 2017; Kumar and Reddy 2013; Kumari et al. 2014; Tokay et al. 2008). Figure 3 clearly demonstrates that the raindrop concentration of mid-size and large drops is higher for Pacific Ocean TCs than Indian Ocean TCs. The Pacific Ocean TCs have higher mean rainfall rates (R, mm h−1), mass-weighted mean diameters (Dm, mm), and lower normalized intercept parameters (Nw, mm−1 m−3) than Indian Ocean TCs (Fig. 3). A higher concentration of small drops and lower concentration of mid-size and large drops in Indian Ocean TCs results in lower Dm values than Pacific Ocean TCs.

Further, to recognize dissimilarities in rain parameters (log10 R, log10 W, Dm, and log10 Nw) of Indian Ocean and Pacific Ocean TCs, the probability distribution functions (PDF) of these parameters are computed and illustrated in Fig. 4. The Pacific Ocean TCs have larger values than Indian Ocean TCs for log10 R > 0.5, where R is in mm h−1, and the Indian Ocean TCs show peak distributions at lower rainfall intensities (log10 R = 0) (Fig. 4a). The liquid water content (log10 W) PDF shows relatively greater frequency in Indian Ocean TCs for log10 W < −0.6 (here W is in g m−3) than in Pacific Ocean TCs (Fig. 4b). A clear variation in PDF distributions of Dm for Indian Ocean and Pacific Ocean TCs can be seen (Fig. 4c). The Indian Ocean and Pacific Ocean TCs have peak PDF distributions of Dm at around 0.8 mm and 1.4 mm, respectively. Like Dm, the normalized the intercept parameter (log10 Nw) also showed distinct differences in PDF distributions between Indian Ocean and Pacific Ocean TCs (Fig. 4d). The PDF of log10 Nw shows a higher percentage at lower log10 Nw values in the Pacific Ocean TCs, and a higher percentage at higher log10 Nw values in the Indian Ocean TCs (Fig. 4d). Additionally, to show the dissimilarities between Indian Ocean and Pacific Ocean TCs rain parameters, a Student's t-test is executed for log10 R, log10 W, Dm, and log10 Nw, and the results reject the null hypothesis H0 (log10 RPacific = log10 RIndian; log10 WPacific = log10 WIndian; Dm_Pacific = Dm_Indian; log10 Nw_Pacific = log10 Nw_Indian) at significance levels of 0.05 and 0.01.

The mean raindrop concentrations of Indian Ocean and Pacific Ocean TCs are classified into six rainfall rate classes (C1:0.1–1, C2:1–2, C3:2–5, C4:5–10, C5:10–20, C6: > 20 mm h−1) and are shown in Fig. 5. The rain statistics of these six rainfall rate classes for Indian Ocean and Pacific Ocean TCs are provided in Table 2. For C1 and C2, there are higher concentrations of mid-size and large drops in Pacific Ocean TCs than in Indian Ocean TCs (Figs. 5a, b). Additionally, raindrops with diameters of > 1.4 mm and 1.6 mm in C3 and C4, respectively, have greater concentrations in Pacific Ocean TCs (Figs. 5c, d). In C5 and C6 (Figs. 5e, f), raindrops larger than 2 mm in diameter are more common in Pacific Ocean TCs than Indian Ocean TCs. From Fig. 5, it can be seen that even after separating the Pacific Ocean and Indian Ocean TCs raindrop spectra into different rainfall rate classes, mid-size and large drops are more common in Pacific Ocean TCs than Indian Ocean TCs. For both oceanic TCs, it can be seen that the concentration of large drops and spectral width increase with increased rainfall rate.


Variations of Dm and log10 Nw values in the six rainfall rate classes of both oceanic TCs are shown in Fig. 6 with a box and whisker plot. It is obvious from Fig. 6a that Pacific Ocean TCs have higher Dm values than Indian Ocean TCs. In contrast, Dm values increase with increased rainfall rate classes for the TCs in both oceans. In contrast to Dm, the log10 Nw values are higher for Indian Ocean TCs than Pacific Ocean TCs. Higher mid-size and large drop concentrations in Pacific Ocean TCs result in higher Dm values for Pacific Ocean TCs. The mean and standard deviation values of Dm, log10 Nw, μ, and Λ for Pacific Ocean and Indian Ocean TCs are provided in Table 3. For both oceanic TCs, increased rainfall rates correlate with increasing Dm values due to the increase in the mid-size and large drop concentration with increased rainfall rate.
3.2 Dm-R and Nw-R relations
The normalized intercept parameter (log10 Nw) and mass-weighted mean diameter (Dm) infer the RSD features, and these parameters varied with rainfall intensity for different precipitating cloud systems (Chen et al. 2013; Marzano et al. 2010; Thurai et al. 2010). Figure 7 shows scatter plots of Dm and log10 Nw with rainfall rates for both oceanic TCs. An apparent distinction in the distribution of Dm with rainfall rate can be seen between Indian Ocean and Pacific Ocean TCs. The Dm values in Pacific Ocean TCs (Fig. 7a) are distributed between 0.4 and 3 mm, with few points around 3–3.5 mm, whereas the Dm values for Indian Ocean TCs are scattered from 0.4 to 2 mm, with few points between 2–2.5 mm. Despite this, as rainfall rate increases, the distribution of Dm narrows for both oceanic TCs, which is consistent with previous studies (Chang et al. 2009; Kumar and Reddy 2013; Wen et al. 2018). Lower variation of Dm with increased rainfall rate could be due to the RSD reaching equilibrium at higher rainfall rates, in which raindrop breakup and coalescence reach a near balance (Hu and Srivastava 1995), and further rainfall rates increases under RSD equilibrium conditions are due to an increase in number concentration (Bringi and Chandrasekar 2001). The power law fitting equations derived for Dm-R and log10 Nw-R are also shown in Fig. 7. The Dm-R relations obviously show that the Pacific Ocean TCs have higher coefficient and exponent values than Indian Ocean TCs. This implies that for a given rainfall rate, Pacific Ocean TCs have higher Dm values than Indian Ocean TCs, which can be seen in Fig. 6. In contrast, the coefficient and exponent values of log10 Nw -R relations are higher for Indian Ocean TCs than Pacific Ocean TCs, indicating the higher concentration of small drops in Indian Ocean TCs. Over east China, Chen et al. (2016) estimated the Dm-R and Nw-R relations for a continental squall line at four different locations, with coefficient and exponential values of Dm-R relations of 1.642–1.725 and 0.1–0.13, respectively. The coefficient values of Dm-R relations reported by Chen et al. (2016) are higher than the coefficient values of both oceanic TCs in this present study. In contrast, the coefficient and exponent values of log10 Nw-R relations of the continental squall line ranged were 2.843–2.855 and 0.053–0.073, respectively, and their coefficient values were lower than the coefficient values of both oceanic TCs in this study. This clearly demonstrates that both oceanic TCs have higher concentrations of small drops than the continental squall line observed over east China.

The μ-Λ relations provide useful information for understanding RSD characteristics and retrieving RSD parameters from polarimetric radar observations through the constrained-gamma method (Brandes et al. 2004; Cao et al. 2008; Zhang et al. 2001, 2006, 2003). These relations were found to vary by region and rain type (Seela et al. 2018; Tang et al. 2014; Zhang et al. 2003), which necessitates investigation of each region's representative μ-Λ relations. Figure 8 shows scatterplots for the μ and Λ values of Indian Ocean and Pacific Ocean TCs. To estimate the μ-Λ relations of Indian Ocean and Pacific Ocean TCs, we adopted criteria similar those of Cao et al. (2008). That is, if the sum of the count of particles from drop channels 3–21 is less than 1000 or the rainfall rate is less than 5 mm h−1, those datasets would not be used to derive μ-Λ relations. Because μ and Λ values greater than 20 and 20 mm−1, respectively, are ascribed to measurement error rather than storm physics (Zhang et al. 2003), μ-Λ relations are estimated for μ < 20 and Λ < 20 mm−1, and are shown in Fig. 8. For rainfall in Indian Ocean TCs, 50.13 % of the data points are associated with μ > 20 and Λ > 20 mm−1, whereas for Pacific Ocean TCs, 13.32 % of the data points are associated with μ > 20 and Λ > 20 mm−1. The red and blue solid lines in Figs. 8a and 8b represent the polynomial least squares fit for the data points of Pacific Ocean and Indian Ocean TCs, respectively. The computed μ-Λ relations of both oceanic TCs are depicted in Fig. 8, and these relations vary greatly between one another. The green solid line in Fig. 8 represents the equation from Zhang et al. (2003). Current μ-Λ relations, as well as previously reported μ-Λ relations of TCs in different parts of the world (Chang et al. 2009; Chen et al. 2012; Chu and Su 2008; Wen et al. 2018), are provided in Table 4.

Figure 9 shows scatterplots of mass-weighted mean diameter and the standard deviation of mass spectrum for Indian Ocean and Pacific Ocean TCs. The data points shown in Figs. 9a and 9b are those that satisfy the quality control procedure of Williams et al. (2014), i.e., each 1-min raindrops spectra is considered if 1) there are at least 50 raindrops in at least three different diameter bins, 2) the reflectivity factor is greater than 10 dBZ, and 3) the rainfall rate is greater than 0.1 mm h−1, and σm values corresponding to Dm < 0.5 mm are discarded. After applying this quality control procedure, 3611 and 8297 min of raindrop spectra are observed in Indian Ocean and Pacific Ocean TCs, respectively. If fitting is performed for data with Dm > 0.5 mm, the fitted equation becomes σm = 0.36Dm1.35 and σm = 0.29Dm1.71 for the Pacific Ocean and Indian Ocean TCs, respectively. Using large data sets (24,872 min) of two-dimensional video disdrometer (2DVD) measurements over Huntsville, Alabama, Williams et al. (2014) computed the σm-Dm relation as σm = 0.30Dm1.36. A similar relation (σm = 0.266Dm1.65) was evaluated by Thurai et al. (2014) for 10 months of 2DVD observations over Alabama. Thurai et al. (2017) estimated σm-Dm relations (σm = 0.48Dm0.94) for two precipitation events measured in Colorado and Huntsville, Alabama, using 2DVD. The differences in the Dm-σm relations of Thurai et al. (2017) and our results could be due to Thurai et al. (2017) using a droplet spectrometer and the truncation effect of the Parsivel disdrometer used in this study.

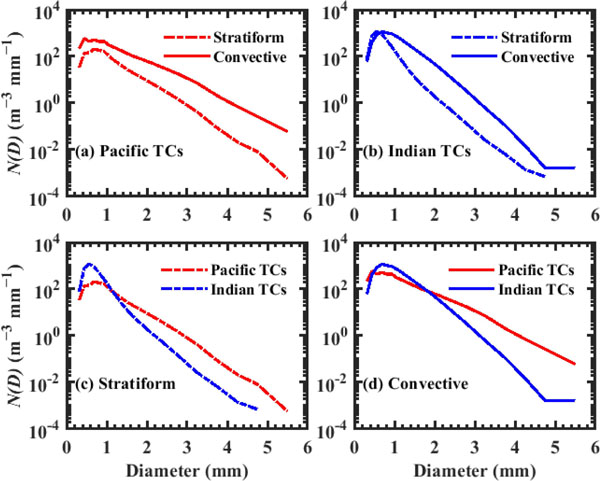
It has been well documented that RSD features significantly change between convective and stratiform precipitation types (Tokay and Short 1996; Ulbrich and Atlas 2007). To classify precipitation into stratiform and convective types, different researchers adopted various classification criteria (Bringi et al. 2003; Das et al. 2017; Krishna et al. 2016; Steiner et al. 1995; Tokay and Short 1996). Among previous precipitation classifications studies, Bringi et al. (2003) documented the RSD characteristics of different precipitation types over a wide range of climatic regimes and observed profound variations between stratiform and convective regimes in maritime and continental clusters. The RSDs of Indian Ocean and Pacific Ocean TCs are categorized into stratiform and convective types by adopting the threshold criteria (i.e., standard deviation of rainfall rate) of Bringi et al. (2003). In this study, 10 consecutive 1-min RSD samples were considered to be stratiform type if the mean value of R ≥ 0.5 mm h−1 and the standard deviation of R (σR) ≤ 1.5 mm h−1, and convective type if the mean value of R ≥ 5 mm h−1 and the standard deviation of R (σR) > 1.5 mm h−1. Samples not meeting these criteria were discarded. With these classification criteria, 66.67 % of data points in the Pacific Ocean TCs are stratiform type and 33.33 % are convective type. For the Indian Ocean TCs, 82.35 % of the data points are stratiform type and 17.65 % are convective type.
The raindrop concentrations of convective and stratiform regimes of Indian Ocean and Pacific Ocean TCs are shown in Fig. 10. For both oceanic TCs, a relatively higher drop concentration can be seen for convective regimes than stratiform regimes (Figs. 10a, b). For both oceanic TCs, the stratiform regimes have nearly exponential distributions, whereas the convective regimes have broad distributions, which might be due to the collisional breakup of large drops in convective rain (Hu and Srivastava 1995). To compare the raindrop concentration of Indian Ocean and Pacific Ocean TCs with respect to precipitation type, Figs. 10a and 10b are re-plotted into Figs. 10c and 10d. Even within the different precipitation types we see a strong distinction in RSDs, with a higher concentration of mid-size and large drops in Pacific Ocean TCs. It is also worth noting that larger numbers of small drops can be seen in Indian Ocean TCs.
The distribution of the mean Dm and log10 Nw values in the stratiform and convective regimes of Indian Ocean and Pacific Ocean TCs are illustrated in Fig. 11. The gray rectangular boxes in Fig. 11 are the maritime and continental clusters defined by Bringi et al. (2003). For both oceanic TCs, convective regimes have higher mean Dm and log10 Nw values than stratiform regimes. In contrast, Pacific Ocean TCs have higher Dm and lower log10 Nw values than Indian Ocean TCs in both convective and stratiform precipitations. The Indian Ocean TCs have smaller drop diameter values than the maritime convection of Bringi et al. (2003). The mean and standard deviation values of Dm, log10 Nw, μ, and Λ in the stratiform and convective regimes of the Pacific Ocean and Indian Ocean TCs are listed in Table 5. If we compare our Dm and log10 Nw distributions with those of the maritime and continental clusters of Bringi et al. (2003), only Pacific Ocean convective precipitation is near the maritime-like clusters, with the rest having lower Dm values than the convective clusters of Bringi et al. (2003). Additionally, Bringi et al. (2003) proposed two different microphysical processes that lead to large Dm and log10 Nw variations in stratiform rain. Larger Dm and smaller log10 Nw values occur due to the melting of large snowflakes and smaller Dm and larger log10 Nw values are due to the melting of tiny graupel or smaller rimed ice particles. As shown in Fig. 11, Indian Ocean TCs stratiform precipitations have lower Dm and larger log10 Nw values than Pacific Ocean TCs, implying that Indian Ocean TCs stratiform precipitation is associated with melting of tiny graupel or smaller rimed ice particles, whereas Pacific Ocean TCs feature melting of large snowflakes.

Z-R relations play a vital role in quantitative precipitation estimation from radar measurements, and these relations were found to vary by geographical location and storm type and strongly depend on RSD characteristics (Rosenfeld and Ulbrich 2003; Seela et al. 2017). The uncertainties in estimating rainfall rate from weather radars can be minimized using indigenous Z-R relations rather than default or tropical Z-R relations (Ulbrich and Lee 2002). In Z = ARb relations, the presence of large or small drops can be inferred from the coefficient A and the exponent b representing microphysical processes. If b is greater than unity, then collision-coalescence (size or mixed controlled) is the characteristic feature. If b equals unity, then the collision, coalescence, and breakup processes (number controlled) are associated with homogeneous rainfall (Atlas and Williams 2003; Atlas et al. 1999; Steiner et al. 2004). The Z-R relations for Indian Ocean and Pacific Ocean TCs are deduced by applying linear regression to logarithmic values of rainfall rate (R, mm h−1) and radar reflectivity (Z, mm6 m−3), and are provided in Fig. 12. A clear demarcation in the coefficient and exponent values of Z-R relations can be seen between the Indian Ocean and Pacific Ocean TCs. For the observational site in India (Kadapa), Jayalakshmi and Reddy (2014) estimated Z-R relations for seasonal rainfall (southwest monsoon (SW): Z = 300.5R1.375 and northeast (NE) monsoon: Z = 163.324R1.35) as well as for precipitation type (SW stratiform: Z = 334.13R1.424, NE stratiform: Z = 245.35R1.283, SW convective: Z = 265.59R1.341, NE convective: Z = 122.41R1.430). The coefficient A in the Z-R relations of Indian Ocean TCs (A = 148.44) is smaller than the seasonal rainfall coefficients, which indicates that the raindrop sizes are relatively smaller in TCs than in seasonal rainfall. Over northern Taiwan, Seela et al. (2018) computed the Z-R relations for summer (stratiform: Z = 276.13R1.41, convective: Z = 237.88R1.41, total: Z = 266.42R1.38) and winter (stratiform: Z = 127.67R1.54, convective: Z = 142.94R1.52, total: Z = 129.76R1.55) rainfall using Joss-Waldvogel disdrometer measurements. For the same observational site over northern Taiwan, Chang et al. (2009) evaluated the Z-R relations (Z = 206.83R1.45) of typhoon rainfall using 2DVD measurements. The current Z-R relations of Pacific Ocean TCs (stratiform Z = 368.28R1.49, convective: Z = 328.73R1.42, total: Z = 346.03R1.42) are different from those of seasonal and typhoon rainfall, and these variations could be due to either the use of different instruments to estimate Z-R relations or Taiwan's complex orography. The estimated Z-R relations of Indian Ocean and Pacific Ocean TCs will enhance the quantitative precipitation estimation of TCs rainfall for these two oceanic basins.

4. Discussion
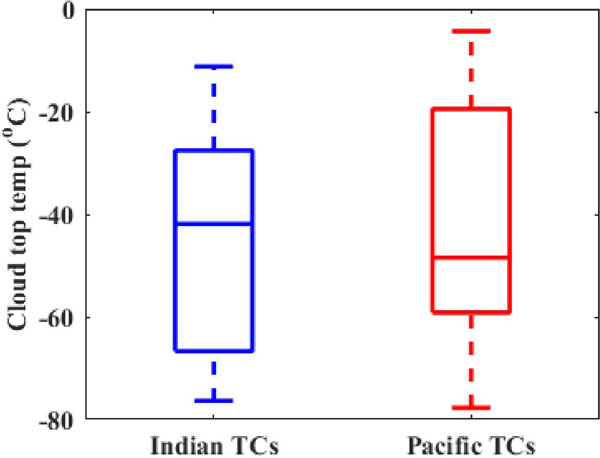
To determine the possible rationale for RSD variations between Indian Ocean and Pacific Ocean TCs, the CAPE (J kg−1), water vapor (Kg m−2), vertical profiles of temperature (°C), and relative humidity values from ERA-Interim, and CTT from MODIS are considered for disdrometers' measurement periods (as listed in Table 1). Figure 13 shows a box and whisker plot of CAPE and water vapor values for the disdrometer observational periods of Indian Ocean and Pacific Ocean TCs. It is apparent that Pacific Ocean TCs have relatively higher water vapor and strong convective activity (higher CAPE) than Indian Ocean TCs. Relatively higher water vapor with vigorous updrafts and downdrafts leads to the growth of cloud particles (both liquid and solid) to a sufficiently larger size (by aggregation, riming, and collision-coalescence processes) in Pacific Ocean TCs than in Indian Ocean TCs. The MODIS-obtained CTT values are slightly higher for Pacific Ocean TCs than Indian Ocean TCs (Fig. 14). Melting of large (small) particles in the Pacific (Indian) TCs results in relatively higher (lower) Dm and lower (higher) log10 Nw values in the Pacific (Indian) TCs (Fig. 11). A Student's t-test is applied to the CAPE, water vapor, and CTT values of the Indian Ocean and Pacific Ocean TCs. The test results showed a significant difference at the 0.01 level in CAPE and column water vapor between Indian Ocean TCs and Pacific Ocean TCs, whereas, there was not a significant difference in CTT. Further mean vertical profiles of temperature and relative humidity for Pacific Ocean and Indian Ocean TCs are shown in Fig. 15. The temperature profiles of Pacific Ocean TCs show relatively higher values than Indian Ocean TCs (Fig. 15a) at all pressure levels. However, the relative humidity profiles showed higher values below 925 hPa and above 775 hPa (Fig. 15b) for the Pacific Ocean TCs. Higher temperature and lower relative humidity values can be seen for Pacific Ocean TCs between 775 and 925 hPa (∼ 2.2–0.76 km), which shows that it is possible for small drops in the Pacific Ocean TCs to evaporate between these pressure levels. The above explanation provides possible reasons for the occurrence of more large drops in Pacific Ocean TCs and more small drops in Indian Ocean TCs.

5. Summary
For the first time, RSD characteristics of Indian Ocean and Pacific Ocean TCs are compared using Parsivel disdrometers installed at observational sites in India and Taiwan. The contribution of mid-size and large drops is higher in Pacific Ocean TCs than in Indian Ocean TCs. The probability distribution of rain integral parameters for Indian Ocean and Pacific Ocean TCs showed distinct distributions. RSDs classified into different rainfall rate classes as well as precipitation types (stratiform and convective) showed a greater concentration of mid-size and large drops in Pacific Ocean TCs. In different rainfall rate classes and precipitation types, higher (lower) mass-weighted mean diameter (normalized intercept parameter) values are observed for Pacific Ocean TCs. The derived empirical relations (Dm-R, log10 Nw-R, μ-ΛDm-σm, log10 Nw-Dm and Z-R) are found to differ between the Pacific Ocean and Indian Ocean TCs, confirming that must adopt TC-specific empirical relations in remote sensing and radar rainfall estimation algorithms. Relatively higher convective activity and water vapor in the Pacific TCs resulted in a greater number of large drops in Pacific TCs than Indian TCs through different microphysical processes.
Acknowledgments
All authors thank IMD and JMA for providing TCs track information. This work is supported by the Ministry of Science and Technology (MOST), Taiwan, under grant numbers MOST 104-2923-M-008-003-MY5, MOST 106-2625-M-008-013, MOST 106-2811-M-008-084, MOST 107-2111-M-008-038, and MOST 108-2625-M-008-011, and partially by “Earthquake-Disaster & Risk Evaluation and Management Center, E-DREaM” from The Featured Areas Research Center Program within the framework of the Higher Education Sprout Project by the Ministry of Education (MOE), Taiwan. The first author, Jayalakshmi Janapati acknowledges MOST in carrying out this work under grant numbers MOST 104-2811-M-008-064, MOST 106-2811-M-008-084, MOST 107-2811-M-008-2551, and MOST 108-2811-M-008-558. The second author, Balaji Kumar Seela, acknowledges Academia Sinica, Taiwan, for providing the graduate fellowship under Taiwan international Graduate Program (TIGP) and MOST for providing the graduate fellowship under grant numbers MOST 106-2625-M-008-013 and MOST 107-2625-M-008-002. The second author also acknowledges MOST for providing the post-doctoral fellowship under grant numbers MOST 107-2111-M-008-038, MOST 108-2625-M-008-011 and MOST 108-2811-M-008-595, and the Central Weather Bureau (CWB), Taiwan under the grant number CWB 1072019C.
References
- Atlas, D., and C. R. Williams, 2003: The anatomy of a continental tropical convective storm. J. Atmos. Sci., 60, 3-15.
- Atlas, D., R. C. Srivastava, and R. S. Sekhon, 1973: Doppler radar characteristics of precipitation at vertical incidence. Rev. Geophys., 11, 1-35.
- Atlas, D., C. W. Ulbrich, F. D. Marks, Jr., E. Amitai, and C. R. Williams, 1999: Systematic variation of drop size and radar-rainfall relations. J. Geophys. Res., 104, 6155-6169.
- Battaglia, A., E. Rustemeier, A. Tokay, U. Blahak, and C. Simmer, 2010: PARSIVEL snow observations: A critical assessment. J. Atmos. Oceanic Technol., 27, 333-344.
- Bhattacharya, A., A. Adhikari, and A. Maitra, 2013: Multitechnique observations on precipitation and other related phenomena during cyclone Aila at a tropical location. Int. J. Remote Sens., 34, 1965-1980.
- Brandes, E. A., G. Zhang, and J. Vivekanandan, 2004: Comparison of polarimetric radar drop size distribution retrieval algorithms. J. Atmos. Oceanic Technol., 21, 584-598.
- Bringi, V. N., and V. Chandrasekar, 2001: Polarimetric Doppler Weather Radar: Principles and Applications. Cambridge University Press, 636 pp.
- Bringi, V. N., V. Chandrasekar, J. Hubbert, E. Gorgucci, W. L. Randeu, and M. Schoenhuber, 2003: Raindrop size distribution in different climatic regimes from disdrometer and dual-polarized radar analysis. J. Atmos. Sci., 60, 354-365.
- Cao, Q., G. Zhang, E. Brandes, T. Schuur, A. Ryzhkov, and K. Ikeda, 2008: Analysis of video disdrometer and polarimetric radar data to characterize rain microphysics in Oklahoma. J. Appl. Meteor. Climatol., 47, 2238-2255.
- Chang, W.-Y., T.-C. C. Wang, and P.-L. Lin, 2009: Characteristics of the raindrop size distribution and drop shape relation in typhoon systems in the western Pacific from the 2D video disdrometer and NCU C-band polarimetric radar. J. Atmos. Oceanic Technol., 26, 1973-1993.
- Chen, B., Y. Wang, and J. Ming, 2012: Microphysical characteristics of the raindrop size distribution in Typhoon Morakot (2009). J. Trop. Meteor., 18, 162-171.
- Chen, B., J. Yang, and J. Pu, 2013: Statistical characteristics of raindrop size distribution in the Meiyu season observed in eastern China. J. Meteor. Soc. Japan, 91, 215-227.
- Chen, B., J. Wang, and D. Gong, 2016: Raindrop size distribution in a midlatitude continental squall line measured by thies optical disdrometers over East China. J. Appl. Meteor. Climatol., 55, 621-634.
- Chu, Y.-H., and C.-L. Su, 2008: An investigation of the slope-shape relation for gamma raindrop size distribution. J. Appl. Meteor. Climatol., 47, 2531-2544.
- Das, S. K., M. Konwar, K. Chakravarty, and S. M. Deshpande, 2017: Raindrop size distribution of different cloud types over the Western Ghats using simultaneous measurements from Micro-Rain Radar and disdrometer. Atmos. Res., 186, 72-82.
- Dee, D. P., S. M. Uppala, A. J. Simmons, P. Berrisford, P. Poli, S. Kobayashi, U. Andrae, M. A. Balmaseda, G. Balsamo, P. Bauer, P. Bechtold, A. C. M. Beljaars, L. van de Berg, J. Bidlot, N. Bormann, C. Delsol, R. Dragani, M. Fuentes, A. J. Geer, L. Haimberger, S. B. Healy, H. Hersbach, E. V. Hólm, L. Isaksen, P. Kållberg, M. Köhler, M. Matricardi, A. P. McNally, B. M. Monge-Sanz, J.-J. Morcrette, B.-K. Park, C. Peubey, P. de Rosnay, C. Tavolato, J.-N. Thépaut, and F. Vitart, 2011: The ERA-Interim reanalysis: Configuration and performance of the data assimilation system. Quart. J. Roy. Meteor. Soc., 137, 553-597.
- Deo, A., and K. J. E. Walsh, 2016: Contrasting tropical cyclone and non-tropical cyclone related rainfall drop size distribution at Darwin, Australia. Atmos. Res., 181, 81-94.
- Friedrich, K., E. A. Kalina, F. J. Masters, and C. R. Lopez, 2013a: Drop-size distributions in thunderstorms measured by optical disdrometers during VORTEX2. Mon. Wea. Rev., 141, 1182-1203.
- Friedrich, K., S. Higgins, F. J. Masters, and C. R. Lopez, 2013b: Articulating and stationary PARSIVEL disdrometer measurements in conditions with strong winds and heavy rainfall. J. Atmos. Oceanic Technol., 30, 2063-2080.
- Hu, Z., and R. C. Srivastava, 1995: Evolution of raindrop size distribution by coalescence, breakup, and evaporation: Theory and observations. J. Atmos. Sci., 52, 1761-1783.
- Jaffrain, J., and A. Berne, 2011: Experimental quantification of the sampling uncertainty associated with measurements from PARSIVEL disdrometers. J. Hydrometeor., 12, 352-370.
- Janapati, J., B. K. Seela, M. V. Reddy, K. K. Reddy, P.-L. Lin, T. N. Rao, and C.-Y. Liu, 2017: A study on raindrop size distribution variability in before and after landfall precipitations of tropical cyclones observed over southern India. J. Atmos. Sol.-Terr. Phys., 159, 23-40.
- Janapati, J., B. K. Seela, P.-L. Lin, P. K. Wang, and U. Kumar, 2019: An assessment of tropical cyclones rainfall erosivity for Taiwan. Sci. Rep., 9, 15862, doi:10.1038/s41598-019-52028-5.
- Jayalakshmi, J., and K. K. Reddy, 2014: Raindrop size distributions of southwest and northeast monsoon heavy precipitation observed over Kadapa (14°4′N, 78°82′E), a semi-arid region of India. Curr. Sci., 107, 1312-1320.
- Jiang, H., and E. J. Zipser, 2010: Contribution of tropical cyclones to the global precipitation from eight seasons of TRMM data: Regional, seasonal, and interannual variations. J. Climate, 23, 1526-1543.
- Jorgensen, D. P., and P. T. Willis, 1982: A Z-R relationship for Hurricanes. J. Appl. Meteor., 21, 356-366.
- Kim, D.-K., and D.-I. Lee, 2017: Raindrop size distribution and vertical velocity characteristics in the rainband of Hurricane Bolaven (2012) observed by a 1290 MHz wind profiler. J. Atmos. Sol.-Terr. Phys., 155, 27-35.
- Kim, D.-K., Y.-H. Kim, and K.-Y. Chung, 2013: Vertical structure and microphysical characteristics of Typhoon Kompasu (2010) at landfall. Asia-Pac. J. Atmos. Sci., 49, 161-169.
- King, M. D., W. P. Menzel, Y. J. Kaufman, D. Tanré, B.-C. Gao, S. Platnick, S. A. Ackerman, L. A. Remer, R. Pincus, and P. A. Hubanks, 2003: Cloud and aerosol properties, precipitable water, and profiles of temperature and water vapor from MODIS. IEEE Trans. Geosci. Remote Sens., 41, 442-458.
- Krishna, U. V. M., K. K. Reddy, B. K. Seela, R. Shirooka, P.-L. Lin, and C.-J. Pan, 2016: Raindrop size distribution of easterly and westerly monsoon precipitation observed over Palau Islands in the Western Pacific Ocean. Atmos. Res., 174-175, 41-51.
- Kumar, S. B., and K. K. Reddy, 2013: Rain drop size distribution characteristics of cyclonic and north east monsoon thunderstorm precipitating clouds observed over Kadapa (14.47°N, 78.82°E), tropical semi-arid region of India. Mausam, 64, 35-48.
- Kumari, N. P. A., S. B. Kumar, J. Jayalakshmi, and K. K. Reddy, 2014: Raindrop size distribution variations in JAL and NILAM cyclones induced precipitation observed over Kadapa (14.47°N, 78.82°E), a tropical semi-arid region of India. Indian J. Radio Space Phys., 43, 57-66.
- Löffler-Mang, M., and J. Joss, 2000: An optical disdrometer for measuring size and velocity of hydrometeors. J. Atmos. Oceanic Technol., 17, 130-139.
- Marks, F. D., Jr., D. Atlas, and P. T. Willis, 1993: Probability-matched reflectivity-rainfall relations for a hurricane from aircraft observations. J. Appl. Meteor., 32, 1134-1141.
- Marzano, F. S., D. Cimini, and M. Montopoli, 2010: Investigating precipitation microphysics using ground-based microwave remote sensors and disdrometer data. Atmos. Res., 97, 583-600.
- Merceret, F. J., 1974: On the size distribution of raindrops in Hurricane Ginger. Mon. Wea. Rev., 102, 714-716.
- Platnick, S., 2015: MODIS Atmosphere L3 Daily Product. NASA MODIS Adaptive Processing System. Goddard Space Flight Center, USA.
- Platnick, S., M. D. King, S. A. Ackerman, W. P. Menzel, B. A. Baum, J. C. Riédi, and R. A. Frey, 2003: The MODIS cloud products: Algorithms and examples from Terra. IEEE Trans. Geosci. Remote Sens., 41, 459-473.
- Prat, O. P., and B. R. Nelson, 2013: Mapping the world's tropical cyclone rainfall contribution over land using the TRMM Multi-satellite Precipitation Analysis. Water Resour. Res., 49, 7236-7254.
- Radhakrishna, B., and T. Narayana Rao, 2010: Differences in cyclonic raindrop size distribution from southwest to northeast monsoon season and from that of non-cyclonic rain. J. Geophys. Res., 115, D16205, doi:10.1029/2009JD013355.
- Rosenfeld, D., and C. W. Ulbrich, 2003: Cloud microphysical properties, processes, and rainfall estimation opportunities. Radar and Atmospheric Science: A Collection of Essays in Honor of David Atlas. Wakimoto, R. M., and R. Srivastava (eds.), Meteorological Monographs book series, American Meteorological Society, 237-258.
- Seela, B. K., J. Janapati, P.-L. Lin, K. K. Reddy, R. Shirooka, and P. K. Wang, 2017: A comparison study of summer season raindrop size distribution between Palau and Taiwan, two Islands in Western Pacific. J. Geophys. Res., 122, 11787-11805.
- Seela, B. K., J. Janapati, P.-L. Lin, P. K. Wang, and M.-T. Lee, 2018: Raindrop size distribution characteristics of summer and winter season rainfall over north Taiwan. J. Geophys. Res., 123, 11602-11624.
- Steiner, M., R. A. Houze, Jr., and S. E. Yuter, 1995: Climatological characterization of three-dimensional storm structure from operational radar and rain gauge data. J. Appl. Meteor., 34, 1978-2007.
- Steiner, M., J. A. Smith, and R. Uijlenhoet, 2004: A microphysical interpretation of radar reflectivity–rain rate relationships. J. Atmos. Sci., 61, 1114-1131.
- Suh, S.-H., C.-H. You, and D.-I. Lee, 2016: Climatological characteristics of raindrop size distributions in Busan, Republic of Korea. Hydrol. Earth Syst. Sci., 20, 193-207.
- Tang, Q., H. Xiao, C. Guo, and L. Feng, 2014: Characteristics of the raindrop size distributions and their retrieved polarimetric radar parameters in northern and southern China. Atmos. Res., 135-136, 59-75.
- Thurai, M., V. N. Bringi, and P. T. May, 2010: CPOL radar-derived drop size distribution statistics of stratiform and convective rain for two regimes in Darwin, Australia. J. Atmos. Oceanic Technol., 27, 932-942.
- Thurai, M., C. R. Williams, and V. N. Bringi, 2014: Examining the correlations between drop size distribution parameters using data from two side-by-side 2D-video disdrometers. Atmos. Res., 144, 95-110.
- Thurai, M., P. Gatlin, V. N. Bringi, W. Petersen, P. Kennedy, B. Notaroš, and L. Carey, 2017: Toward completing the raindrop size spectrum: Case studies involving 2D-video disdrometer, droplet spectrometer, and polarimetric radar measurements. J. Appl. Meteor. Climatol., 56, 877-896.
- Tokay, A., and D. A. Short, 1996: Evidence from tropical raindrop spectra of the origin of rain from stratiform versus convective clouds. J. Appl. Meteor., 35, 355-371.
- Tokay, A., P. G. Bashor, E. Habib, and T. Kasparis, 2008: Raindrop size distribution measurements in tropical cyclones. Mon. Wea. Rev., 136, 1669-1685.
- Tokay, A., W. A. Petersen, P. Gatlin, and M. Wingo, 2013: Comparison of raindrop size distribution measurements by collocated disdrometers. J. Atmos. Oceanic Technol., 30, 1672-1690.
- Tokay, A., D. B. Wolff, and W. A. Petersen, 2014: Evaluation of the new version of the laser-optical disdrometer, OTT Parsivel2. J. Atmos. Oceanic Technol., 31, 1276-1288.
- Ulbrich, C. W., 1983: Natural variations in the analytical form of the raindrop size distribution. J. Climate Appl. Meteor., 22, 1764-1775.
- Ulbrich, C. W., and L. G. Lee, 2002: Rainfall characteristics associated with the remnants of Tropical Storm Helene in upstate South Carolina. Wea. Forecasting, 17, 1257-1267.
- Ulbrich, C. W., and D. Atlas, 2007: Microphysics of raindrop size spectra: Tropical continental and maritime storms. J. Appl. Meteor. Climatol., 46, 1777-1791.
- Wang, M., K. Zhao, M. Xue, G. Zhang, S. Liu, L. Wen, and G. Chen, 2016: Precipitation microphysics characteristics of a Typhoon Matmo (2014) rainband after landfall over eastern China based on polarimetric radar observations. J. Geophys. Res., 121, 12415-12433.
- Wen, L., K. Zhao, G. Chen, M. Wang, B. Zhou, H. Huang, D. Hu, W.-C. Lee, and H. Hu, 2018: Drop size distribution characteristics of seven typhoons in China. J. Geophys. Res., 123, 6529-6548.
- Williams, C. R., V. N. Bringi, L. D. Carey, V. Chandrasekar, P. N. Gatlin, Z. S. Haddad, R. Meneghini, S. Joseph Munchak, S. W. Nesbitt, W. A. Petersen, S. Tanelli, A. Tokay, A. Wilson, and D. B. Wolff, 2014: Describing the shape of raindrop size distributions using uncorrelated raindrop mass spectrum parameters. J. Appl. Meteor. Climatol., 53, 1282-1296.
- Wu, Q., Z. Ruan, D. Chen, and T. Lian, 2015: Diurnal variations of tropical cyclone precipitation in the inner and outer rainbands. J. Geophys. Res., 120, 1-11.
- Yuter, S. E., D. E. Kingsmill, L. B. Nance, and M. Löffler-Mang, 2006: Observations of precipitation size and fall speed characteristics within coexisting rain and wet snow. J. Appl. Meteor. Climatol., 45, 1450-1464.
- Zhang, G., J. Vivekanandan, and E. Brandes, 2001: A method for estimating rain rate and drop size distribution from polarimetric radar measurements. IEEE Trans. Geosci. Remote Sens., 39, 830-841.
- Zhang, G., J. Vivekanandan, E. A. Brandes, R. Meneghini, and T. Kozu, 2003: The shape–slope relation in observed gamma raindrop size distributions: Statistical error or useful information? J. Atmos. Oceanic Technol., 20, 1106-1119.
- Zhang, G., J. Sun, and E. A. Brandes, 2006: Improving parameterization of rain microphysics with disdrometer and radar observations. J. Atmos. Sci., 63, 1273-1290.