Articles : Special Edition on Extreme Rainfall Events in 2017 and 2018
大気大循環モデルにもとづく2018年7月に日本で発生した極端現象への海洋からの影響評価
2020 年 98 巻 4 号 p. 801-820

詳細
2020 年 98 巻 4 号 p. 801-820
Through a set of ensemble experiments with an atmospheric general circulation model (AGCM), potential influence of sea-surface temperature (SST) anomalies is assessed on large-scale atmospheric circulation anomalies that induced two extreme events observed over Japan in July 2018. One is a heavy rainfall event in early July mainly over western Japan, which was primarily caused by extreme moisture inflow associated with a cyclonic anomaly to the southwest of Japan and an anticyclonic anomaly to the east of Japan. An AGCM experiment with prescribed global SST anomalies cannot reproduce the anticyclonic anomaly, leading to the failure to simulate the enhancement of the moisture inflow and thereby precipitation over western Japan. The other extreme event is heat wave in mid- and late July almost over the entire Japan, which was caused by a strong anticyclonic anomaly around Japan. The AGCM experiment with global SST anomalies can well reproduce the warm anticyclonic anomalies. The additional experiments have confirmed that SST anomalies in both the tropics and midlatitude North Pacific have potential for forcing the leading mode of the atmospheric variability over the western North Pacific that brought the heat wave. Both the tropical and extratropical SST anomalies are also found to force a poleward shift of the subtropical jet axis over the western Pacific and anomalous tropospheric warming in the midlatitude Northern Hemisphere, both of which persisted in June and July.
From the end of June through early July of 2018, Japan, especially its western portion, suffered from a profound heavy rainfall event, which caused more than 230 fatalities (Shimpo et al. 2019). The heavy rainfall occurred under the extreme moisture inflow from the south (Sekizawa et al. 2019; Takemura et al. 2019) and an upper-tropospheric trough to the west of Japan that favored large-scale ascent over a stationary Meiyu-Baiu front (Shimpo et al. 2019; Takemura et al. 2019; Yokoyama et al. 2020). This rainfall event was immediately followed by the intensification of the low-level North Pacific Subtropical High (NPSH or Bonin High) and the upper-level Tibetan High (or South Asian High), which brought extremely high temperature over Japan until August (Shimpo et al. 2019). Imada et al. (2019) pointed out that, in addition to the anomalous intensification of those two anticyclones, anthropogenic global warming also contributed significantly to this heat wave event. They further indicated that the former was likely to be forced not by the global warming but partly by other external forcings, such as sea-surface temperature (SST) anomalies. The extreme summertime warmness in Japan may also be associated with the tropospheric warming in the midlatitude Northern Hemisphere that persisted from autumn in 2017 (Shimpo et al. 2019), and this tropospheric warmness may be forced by SST anomalies in the tropical Pacific (Kobayashi and Ishikawa 2019).
One of the factors affecting summertime climate over East Asia is the Pacific Japan (PJ) teleconnection pattern, which accompanies anomalous convective activity over the tropical western Pacific (Nitta 1987; Kosaka and Nakamura 2006), manifested as modulated typhoon activity (Choi et al. 2010; Kosaka and Nakamura 2010). The PJ pattern is characterized by a meridional dipole of height anomalies and is associated with interannual variability of the Meiyu-Baiu precipitation over East Asia (Kosaka and Nakamura 2010). A particular phase of the PJ pattern that accompanies enhanced (suppressed) Meiyu-Baiu precipitation tends to occur after the mature phase of an El Niño (La Niña) event in preceding winter, which can provide a certain degree of potential predictability of the summertime climatic condition over East Asia (Xie et al. 2009; Kosaka et al. 2012). Therefore, suppressed Meiyu-Baiu precipitation and above-normal warmness should likely occur in summer 2018 if based on the delayed remote influence of the PJ pattern response following a La Niña event in 2017/2018 winter, but only the extreme warmness actually occurred.
Another factor affecting the summertime climate over East Asia is the Silk Road pattern, characterized by eastward-propagating Rossby wave trains along the subtropical jet (STJ) over the Eurasian continent (Enomoto et al. 2003; Enomoto 2004; Kosaka et al. 2009). Kosaka et al. (2012) pointed out that with its low correlation with El Niño/La Niña, the Silk Road pattern has potential predictability that should be lower compared with the PJ pattern. In addition, Rossby wave propagation through the polar-front jet (PFJ) along the Siberian coast also affects the summertime climate over the western North Pacific (e.g., Nakamura and Fukamachi 2004). Liu et al. (2019) suggested that an anticyclonic circulation anomaly over Japan may be caused by eastward wave propagation along the PFJ triggered perhaps by SST anomalies over the North Atlantic in July 2018.
The latest studies thus suggest that remote influences from the tropics and/or the upstream can lead to extreme climatic conditions over summertime Japan and associated anomalous atmospheric circulation, but one may wonder whether SST anomalies in the midlatitude North Pacific may also play a role. Atmospheric regional model experiments suggest that the summertime midlatitude SST frontal zone over the North Pacific, a confluent region of the warm Kuroshio and cold Oyashio currents, can control westerly jets and precipitation (Nakamura and Miyama 2014). Matsumura et al. (2016) indicated that a warm SST anomaly along the midlatitude oceanic frontal zone over the western North Pacific can induce northward shift of the subtropical jet and Meiyu-Baiu rainband. In the summer of 2018, a warm anomaly was observed over the western North Pacific (Fig. 1), which may have potential to affect the atmospheric circulation.
This study aimed to investigate the role of SST anomalies in forcing the atmospheric circulation anomalies during those extreme events in summer 2018 based on ensemble experiments of an atmospheric general circulation model (AGCM). We evaluated separately the influence from the tropical SST anomalies and that from the extratropical SST anomalies. One may argue that midlatitude SST anomalies are likely to be forced by atmospheric anomalies, and thus, an AGCM experiment forced with midlatitude SST anomalies may not represent a true causal relationship between the atmosphere and ocean. However, the warm SST anomaly observed to the southeast of Japan in July 2018 accompanied anomalous upward surface latent and sensible heat fluxes, particularly during the heat wave event, as confirmed by both the JRA-55 reanalysis and an independent ocean surface flux data (WHOI OAFlux (Yu and Weller 2007) not shown). This is suggestive of an active role of the midlatitude ocean in reinforcing the atmospheric circulation anomalies in July 2018.
The Japanese 55-year Reanalysis (JRA-55) dataset was used for this study, which was available on a 1.25° × 1.25° latitude-longitudinal grid system for the 61-year period from 1958 through 2018 (Kobayashi et al. 2015). Climatological-mean fields were defined daily as the 61-year averages, and daily anomalies were defined as local deviations from the climatological-mean fields. We used precipitation data in the reanalysis, because precipitation over the ocean was not available until the satellite era and because our main focus was not on precipitation itself, but rather on the atmospheric circulation that caused the two extreme events.
2.2 Numerical simulationsWe used an atmospheric general circulation model (AGCM) named AFES (AGCM For Earth Simulator, Ohfuchi et al. 2004; Kuwano-Yoshida et al. 2010) configured at horizontal resolution T119 (about 100 km), with 56 vertical levels extending from the surface up to ∼ 0.1 hPa. The prescribed SST and sea ice data are the Optimally Interpolated Advanced Very-High-Resolution Radiometer Pathfinder SST (OISST) data produced by the US National Oceanic and Atmospheric Administration (NOAA) compiled on a 0.25° × 0.25° grid system (Reynolds et al. 2007). Following Lau (1997), we conducted four kinds of AGCM experiments forced with different lower-boundary conditions as follows. In the Global Ocean-Global Atmosphere (GOGA) experiment, we prescribed observed daily SSTs over the global oceans. In the Tropical Ocean-Global Atmosphere (TOGA) experiment, we prescribed observed daily SSTs only over the tropical oceans between 25.5°S and 25.5°N, whereas the climatological daily SSTs were prescribed for the extratropical oceans. The tropical and extratropical domains are presented in Fig. 1. Note that the observed SSTs were prescribed over the entire Tropics in our TOGA experiment, but only within the tropical Pacific in its counterpart of Lau (1997). The Midlatitude Ocean-Global Atmosphere (MOGA) experiment is the experiment in which the observed daily SSTs were prescribed only over the extratropical North Pacific Ocean (between 25.5°N and 65.3°N), whereas the climatological daily SSTs were prescribed over the other oceans. In the climatological (CLM) experiment, the climatological SSTs were prescribed entirely over the global oceans. The climatological sea ice was prescribed for all of the experiments. The daily climatological seasonal cycles of SST and sea ice were obtained as their local averages between 1982 and 2013 for individual calendar days. Each of the four experiments had 50 ensemble members integrated from March 10 through July 31, 2018. In addition, we conducted two sets of 30-member ensemble integrations with higher horizontal resolution (T239, nearly 50 km) in the same configuration as in the GOGA (GOGA-H) and CLM (CLM-H) experiments. There are two reasons why we conducted the higher-resolution model experiment. One is that a higher-resolution model has a tendency to represent more intense precipitation (e.g., Kusunoki et al. 2006). The other reason is that the higher-resolution is required for AGCMs to obtain realistic atmospheric responses to midlatitude SST anomalies (e.g., Czaja et al. 2019), although we have not conducted its higher-resolution counterpart of the MOGA experiment due to limited computer resources.

Anomalies of SSTs (K) of the NOAA OISST (a) averaged over the heavy rainfall period (June 28–July 8, 2018) and (b) averaged over the heat wave (July 11–30, 2018). Black lines indicate domains used for the TOGA and MOGA experiments.
As presented in Fig. 2, precipitation anomalies based on the reanalysis after averaged over the heavy rainfall period (June 28–July 8, 2018) were positive almost entirely over Japan, and they exceeded 16 mm day−1 over western Japan (Fig. 2a). Precipitation averaged over the Chugoku area (33–35°N, 132–135°E), a part of western Japan, was as much as 37.3 mm day−1 if averaged during this period, which was the largest precipitation in the same period over the last 61 years and more than three times larger than the climatological-mean value. The heavy rainfall was associated with a profound anomalous moisture flux from the south (Fig. 2a), which was also the largest over the last 61 years (Takemura et al. 2019). The anomalous moist southerlies were likely caused by slight eastward retreat and northward expansion of the NPSH and a cyclonic anomaly over the southern East China Sea.

(a) Anomalies of precipitation (mm day−1; color), 850-hPa geopotential height (m; contour), and vertically integrated moisture flux (kg m−1 s−1; blue arrow) in the reanalysis averaged for the heavy rainfall period. Thick contour indicates the 850-hPa climatological-mean geopotential height being 1500 m. (b) Anomalies of 500-hPa horizontal temperature advection (K day−1; contour). Colors are for those normalized by standard deviations of interannual variability among the last 61 years. Purple arrows indicate horizontal wind anomalies at the 500-hPa level. (c) As in (b), but for 200-hPa vorticity (10−5 s−1). (d) As in (a), but for responses of the GOGA experiment. (e) As in (b), but for responses of the GOGA experiment. Significant positive (negative) anomalies at the 5 % level based on the Student t-test are indicated by yellow (blue) shading. (f) As in (e), but for 200-hPa vorticity. (g) As in (d), but for responses of the TOGA experiment. (h) As in (f), but for responses of the TOGA experiment. (i) As in (f), but for responses of the MOGA experiment.
Sampe and Xie (2010) proposed that warm horizontal temperature advection in the mid-troposphere dynamically induces ascent along the STJ to organize the Meiyu-Baiu rainband. Kosaka et al. (2011) found that the interannual variability of the Meiyu-Baiu precipitation is also in conjunction with that of the horizontal temperature advection. During the rainfall event, positive anomalies of the 500-hPa horizontal temperature advection were indeed observed over western Japan (Fig. 2b) on the basis of period-mean fields of horizontal wind and temperature for individual years. The warm advection during the rainfall event averaged over the Chugoku area was the 7th largest over the last 61 years. This anomalous advection was caused by the anomalous southwesterlies crossing the climatological-mean temperature gradient along the STJ. The anomalous southwesterlies during the rainfall event were associated with an anticyclonic vorticity anomaly over the western North Pacific in the upper troposphere (Fig. 2c), which formed in conjunction with a cyclonic anomaly to its south. These dipolar anomalies are reminiscent of the PJ pattern. In fact, the lower-tropospheric anticyclonic anomaly was located just below the node of those upper-tropospheric dipolar anomalies, suggestive of a northward tilt of the vorticity anomalies with height as a characteristic of the PJ pattern (Kosaka and Nakamura 2006, 2010).
The GOGA experiment cannot reproduce the positive precipitation anomaly as the ensemble-mean response, which is locally defined as the deviation from the CLM experiment. The period-mean precipitation is even less than that of the CLM experiment over western Japan (Fig. 2d, Table 1). Compared with the CLM experiment, the surface NPSH in the GOGA experiment is retreated too far eastward in association with the overestimated cyclonic anomaly to the south of Japan relative to its observational counterpart. The northward expansion of the NPSH is not well simulated either, which may be one of the factors for the failure in reproducing the heavy rain. The anomalous moisture flux simulated over western Japan is westward rather than poleward in the reanalysis. As in the GOGA experiment, neither the ensemble-mean responses in the GOGA-H experiment nor the TOGA experiment (Fig. 2g) can reproduce the enhanced precipitation (Table 1). Meanwhile, as in the GOGA experiment, the cyclonic anomaly to the south of Japan was also simulated in the TOGA experiment, suggestive of the potential forcing by the tropical SST anomalies on the cyclonic anomaly. This cyclonic anomaly may reflect a deeper monsoon trough and frequent passages of tropical cyclones. Takaya (2019) argued that the cyclonic anomaly may be caused by warm SST anomalies over the tropical North Pacific associated with the Pacific meridional mode. By contrast, the corresponding responses in precipitation and lower-tropospheric circulation were very weak in the MOGA experiment (not shown).

In the mid-troposphere, horizontal warm advection anomaly is not simulated in the GOGA experiment due to the underestimated southerly component of the wind anomaly (Fig. 2e). This may be attributable to the northward shifted anticyclonic vorticity anomaly in the mid- and upper troposphere and slight overestimation of its westward extension relative to its observational counterpart (Fig. 2f). This anticyclonic vorticity anomaly was also simulated in the TOGA experiment (Fig. 2h), suggesting that the tropical SST anomalies forced this vorticity anomaly. The SST anomalies over the midlatitude North Pacific may also force such an anticyclonic vorticity anomaly (Fig. 2i), but the response was found to be much weaker than that in the GOGA and TOGA experiments.
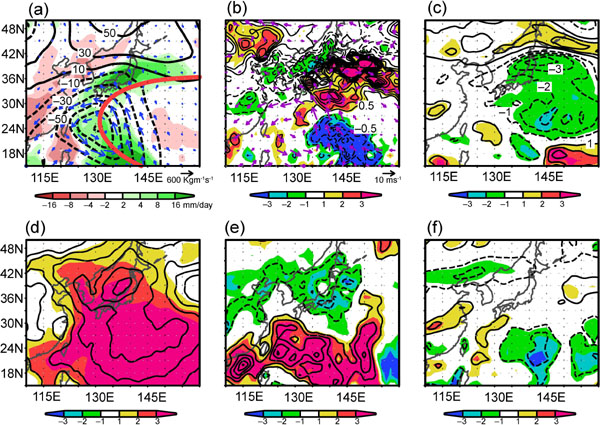
3.2 Forcings of the atmospheric circulation anomalies during the heavy rainfall eventHere, we focus on upper-tropospheric divergence in the tropics that could force the atmospheric circulation anomalies over the western North Pacific. During the heavy rainfall period, a negative anomaly of velocity potential and anomalous divergence wind were observed at the 150-hPa level over the tropical/subtropical western Pacific in association with locally enhanced precipitation (Figs. 3a, 3c). This anomalous divergence wind and the increased precipitation were also found as the ensemble-mean responses in the GOGA experiment (Figs. 3b, 3d) and TOGA experiment (not shown), suggestive of the forcing by the tropical SST anomalies. Over the Eurasian continent, a wave train similar to the Silk Road pattern was observed along the STJ, manifested as strong positive and negative anomalies in meridional wind velocity, including the anomalous southerlies over Japan (Fig. 3e). In the response in the GOGA experiment, there is a hint of such a wave train along the STJ, but the associated meridional wind anomalies are severely underestimated, and their geographical phase totally differs from what was observed in the reanalysis over Eurasia (Fig. 3f). Though substantially weaker, the anomalous southerlies over Japan and anomalous northerlies to the east in the GOGA response are nevertheless consistent with their observational counterpart. As suggested from Fig. 3h, they are associated with an anticyclonic response over northern Japan that appears to constitute a dipolar response with a cyclonic response northeast of the Philippines. The dipolar response is also simulated in the TOGA experiment, suggestive of the forcing by the tropical SST anomalies. Similar dipolar anomalies were actually observed (Fig. 3g), but the simulated anticyclonic anomaly is displaced slightly northward.

(a, c, e, g) Anomalies of (a) precipitation (contour for ±2, ±6, ±10… mm day−1), (c) 150-hPa velocity potential (±1, ±2, ±3… × 106 m2 s−1), (e) 200-hPa meridional wind (±2, ±6, ±10… m s−1). (g) 500-hPa geopotential height (±10, ±30, ±50… m) in the reanalysis during the heavy rainfall period. Colors indicate their normalized values. Red contours in (e) are for climatological zonal wind (15, 30 m s−1). Purple arrows in (c) indicate 150-hPa anomalous divergent wind (m s−1). Purple arrows in (g) indicate the 500-hPa wave-activity flux defined by Takaya and Nakamura (2001). (b, d, f, h) Reponses of (b) precipitation, (d) velocity potential, (f) 200-hPa meridional wind, and (h) 500-hPa geopotential height in the GOGA experiments. Significant positive (negative) anomalies at the 5 % level based on the t-statistics are indicated by yellow (blue) shading. Red contours in (f) indicate zonal wind (15, 30 m s−1) in the CLM experiment.
In the mid-troposphere, a chain of positive and negative height anomalies in association with eastward wave activity flux (Takaya and Nakamura 2001) was observed along the PFJ over the Siberian coast (Fig. 3g). This wave train is similar to the one that typically forms the surface Okhotsk High in July (Nakamura and Fukamachi 2004), as actually observed during the heavy rainfall period (Shimpo et al. 2019). Neither the wave train nor the surface Okhotsk high are simulated in the responses of the GOGA experiment (Fig. 3h), which suggests that those circulation anomalies are not forced by the SST anomalies. One of the factors for the failure to simulate the heavy rainfall event is likely the inability of the AGCM to simulate the two wave trains as observed along the STJ and PFJ, both of which may be internally generated in the atmosphere.
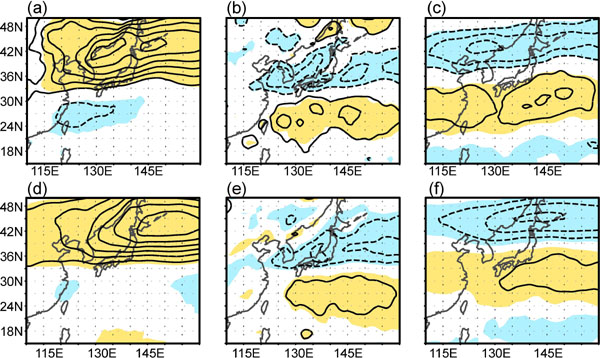
3.3 The heat wave event in mid- and late July 2018In mid- and late July 2018 (July 11–30), a temperature of 850 hPa based on the reanalysis averaged over the main islands of Japan (30–45°N, 130–145°E) was the highest in the same period over the last 61 years and higher than its climatology by as much as 2.1°C (Table 2). Associated with a low-level anticyclonic vorticity anomaly (Fig. 4b), the warm anomaly over the Far East centered on the western portion of the Sea of Japan was so strong that it exceeded two standard deviations (Fig. 4a). The GOGA experiment reproduces both the anomalous warmness and anticyclonic vorticity anomaly as the ensemble-mean responses (Figs. 4d, e). The ensemble-mean temperature response averaged over Japan is 1.0°C (Table 2), which accounts for nearly half of the observed anomaly. The anomalous warmness and anticyclonic anomaly around Japan were also simulated in both the TOGA and MOGA experiments (Figs. 4g, h, j, k). The warm anomaly averaged over Japan was slightly higher in the TOGA experiment (0.7°C) than in the MOGA experiment (0.5°C), whereas the temperature anomaly distribution in the MOGA experiment was more similar to that in the reanalysis than that in the TOGA experiment. In the TOGA experiment (Fig. 4g), the center of the warm anomaly was not over Japan; it was displaced southward. A similar warm anomaly maximum was also simulated in the GOGA experiment (Fig. 4d), which was located between the extreme warm anomaly just north of Japan and another warm anomaly around 15°N in the reanalysis. In the upper troposphere, an anticyclonic vorticity anomaly was also observed slightly to the north of its lower-tropospheric counterpart in the reanalysis and each of the ensemble responses in the AGCM experiments (Figs. 4c, f, i, l). As in the heavy rainfall period, the phase of these circulation anomalies was tilting northward with height, as a characteristic of the PJ pattern.


(a, b, c) Anomalies of (a) 850-hPa temperatures (0.5, 1.0, 1.5… K), (b) 850-hPa vorticity (±0.5, ±1.0, ±1.5… × 10−5 s−1), and (c) 200-hPa vorticity (±1, ±2, ±3… × 10−5 s−1) in the reanalysis averaged for the heat wave period (July 11–30, 2018). (d, e, f) As in (a, b, c), respectively, but for responses in the GOGA experiment. (g, h, i) As in (d, e, f), respectively, but in the TOGA experiment. (j, k, l) As in (d, e, f), respectively, but in the MOGA experiment.
In mid- and late July 2018, negative anomalies of upper-tropospheric velocity potential prevailed over the western North Pacific (Fig. 5c), which was accompanied by enhanced precipitation to the east of the Philippines (Fig. 5a). These observational features are well reproduced as the ensemble-mean responses in the GOGA (Figs. 5b, d) and TOGA experiments (not shown), suggestive of the importance of SST forcing. Over the Eurasian continent, an upper-tropospheric wave train similar to the Silk Road pattern was observed along the STJ (Fig. 5e) and another wave train along the Siberian coast, which was also evident in the mid-troposphere (Fig. 5g). Seemingly, the latter wave train originated from an anticyclonic anomaly over northern Europe, and this particular anomaly is simulated in the GOGA (Fig. 5h) and TOGA experiments (not shown). Nevertheless, those wave trains over Eurasia are reproduced in none of those experiments.

As in Fig. 3, but for average during the heat wave event.
For more discussions on the formation of the anticyclonic anomaly over northern Europe, we have conducted another ensemble experiment wherein the observed SSTs were prescribed only over the North Atlantic (between 25.5°N and 65.3°N). In the experiment, however, no such anticyclonic anomaly is simulated. Considering that the anomaly is simulated in the TOGA experiment, the anticyclonic anomaly was likely forced by the tropical SST anomalies, although a particular basin that contributed the most is not distinguishable. The mechanisms for the formation of the anticyclonic anomaly under the remote influence from the tropical SST anomalies will be addressed in our future work.
3.5 Leading atmospheric modes over the western North Pacific in mid- and late JulyFor further discussion on the atmospheric circulation anomalies that induced the heat wave, an empirical orthogonal function (EOF) analysis is applied to 200-hPa westerlies in the reanalysis over the western North Pacific (30–60°N, 110–160°E). The westerlies have been averaged for July 11–30 in the individual years, before the EOF analysis was applied to their interannual variability from 1958 through 2018. The first, second, and third EOFs explain 40.2, 16.9, and 11.0 % of the total variance, respectively. The normalized principal components (PCs) of the first, second, and third EOFs are 2.18, 1.07, and 0.98, respectively, for 2018. Obtained by regressing 850-hPa temperature anomalies onto the first PC, a warm anomaly associated with the first EOF is located around Japan between 33°N and 50°N (Fig. 6a). The warm anomaly is associated with anticyclonic vorticity anomalies both in the lower and upper troposphere (Figs. 6b, c), as actually observed during the heat wave event (Figs. 4a–c). Considering that the first PC in 2018 is substantially larger than the second and third PCs and that the second and third EOFs are both associated with cooling anomalies over Japan in 2018 (not shown), we conclude that the observed warmness during the heat wave event should be mostly caused by the dominance of the leading mode of the anomalous upper-level westerlies.
(a) Anomalies of 850-hPa temperature averaged for the heat wave period regressed onto the PC of the first EOF mode in the reanalysis (contour for ±0.2, ±0.4, ±0.6… K). (b) As in (a), but for 850-hPa vorticity (±0.2, ±0.4, ±0.6… × 10−5 s−1). (c) As in (a), but for 200-hPa vorticity (±0.5, ±1.0, ±1.5… × 10−5 s−1). Yellow and blue shading denotes the correlation coefficient being positively and negatively significant at the 5 % level, respectively. (d, e, f) As in (a, b, c), respectively, but for the AGCM experiments.
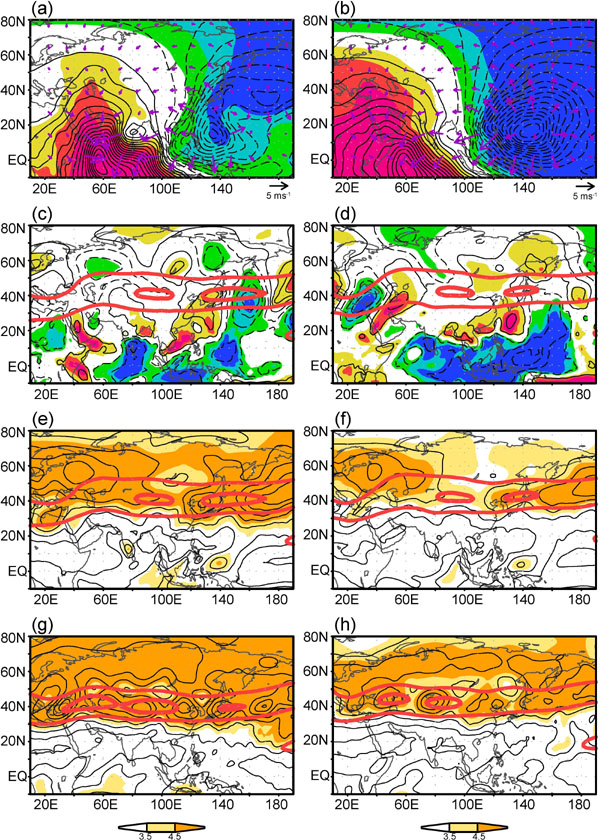
The first EOF of the variability of the upper-level westerlies accompanies meridional tripoles of anomalies in the 500-hPa height (Fig. 7g) and precipitation (Fig. 7a) over the western North Pacific. The first EOF thus basically represents the tripolar pattern (Hirota and Takahashi 2012) as the leading mode of atmospheric variability over the summertime western North Pacific, whose essential element is the PJ pattern. Unlike in the observed anomalies during the heat wave event, a wave train along the STJ is not represented by the first EOF (Figs. 7e, g), suggesting its independence from the tripolar pattern.

(a, c, e, g) As in Fig. 6a, but for (a) precipitation (contour for ±1, ±2, ±3… mm day−1), (c) 150-hPa velocity potential (±0.5, ±1.0, ±1.5… × 106 m2 s−1), (e) 200-hPa meridional wind (±2, ±6, ±10… m s−1), (g) 500-hPa geopotential height (±5, ±15, ±25… m) in the reanalysis. (b, d, f, h) As in (a, c, e, g), respectively, but for the AGCM experiments.
The positive PC of the first EOF also corresponds to a negative anomaly of upper-tropospheric velocity potential to the northeast of the Philippines (Fig. 7c), onto which the anomalous velocity potential observed during the heat wave event (Fig. 5c) has some projection. Still, the observed negative anomaly of velocity potential near the Philippines was displaced slightly to the south of its counterpart in the first EOF. This latitudinal displacement seems consistent with the corresponding displacement in precipitation anomalies between the EOF and reanalysis (Figs. 5a, 7a). The apparent discrepancy is likely caused by the contribution from the third EOF that accompanies a negative anomaly of velocity potential near the Philippines (not shown). Over the Indian Ocean, a positive anomaly of velocity potential is observed, whereas the corresponding anomaly is negative for the first EOF. The SST anomalies in the Tropics may force the observed positive anomaly over the Indian Ocean, which may dominate over the contribution from the first EOF.
The same EOF analysis as above has also been applied to the AGCM experiments. We used 200 ensemble members in total (i.e., 50 ensemble members for each of the four experiments). The first, second, and third EOFs of the 200-hPa westerlies explain 40.3, 20.4, and 11.1 % of the total variance, respectively. The patterns of circulation anomalies associated with the first EOF for the AGCM are overall similar to those of their counterpart for the reanalysis (Figs. 6, 7). The normalized value of the first PC averaged among the 50 members of the GOGA experiment is greater than the corresponding value for the CLM experiment by 0.82. This difference is statistically significant at the 5 % level, based on the Student's t-test, under the assumption that the probability distribution of the first PCs is the standard normal distribution. This significant difference in the first PC suggests that the global SST anomalies in 2018 were likely to contribute to the occurrence of the heat wave through the development of the first mode that resembles the PJ pattern. Likewise, the first PCs averaged among the ensembles for the TOGA and MOGA experiments are also greater than that of the CLM experiments by +0.33 and +0.55, respectively, but only the latter is statistically significant. This suggests that the SST anomalies both in the Tropics and extratropical North Pacific could trigger the first EOF in 2018, and the latter was likely a bit more efficient.
We have shown that observed circulation anomalies over the western North Pacific may also be forced by the SST anomalies over the extratropical North Pacific, as suggested by the MOGA experiment (Figs. 4j–l). In that experiment, precipitation is slightly enhanced and suppressed (Fig. 5b) over warm and cool SST anomalies to the southeast and southwest, respectively, of Japan (Fig. 1b). The associated anomalous vertical motion may force vorticity anomalies in both the lower and upper troposphere (not shown). In addition, anomalous transient eddy activity may reinforce the zonal wind response over the western North Pacific in the MOGA experiment (not shown). However, the specific mechanisms through which the extratropical SST anomalies can force the observed atmospheric anomalies remain to be investigated in our future study.
It should be noted that the increase in the mean PC by the global SST anomalies is at most +0.82 in the AGCM, whereas the PC observed in 2018 in the reanalysis is 2.18. This suggests that the observed first mode in 2018 was not solely forced by the SST anomalies but also contributed to by internal atmospheric dynamics.
In the heavy rainfall and heat wave periods, the STJ axis, defined as a meridional maximum of 200-hPa westerly intensity averaged zonally across the western North Pacific (120–160°E), was located poleward of its climatological-mean position by 4.3° and 5.4° in latitude, respectively, corresponding to the 3rd and 2nd highest values among the last 61 years (Tables 1, 2). Though underestimated, the GOGA experiment reproduces the poleward shift of the STJ axis relative to the CLM experiment by 2.6° in the heavy rainfall event (Table 1) and 2.0° in the heat wave event (Table 2) as the ensemble-mean responses. These poleward shifts of the STJ axis are also simulated in the GOGA-H experiment, although the jet shift is not statistically significant if averaged over the heat wave event. As presented in Tables 1 and 2, tropical SST anomalies contribute significantly to the poleward STJ shift in both periods, whereas the extratropical SST anomalies over the North Pacific contribute significantly only during the heat wave event.
According to the reanalysis, the STJ axis defined by the westerlies averaged across the western North Pacific tended to be shifted poleward relative to its climatological position in June through July 2018, except for mid-June (Fig. 8a). Both the GOGA and GOGA-H experiments overall reproduce this tendency of the poleward STJ shift as the ensemble-mean responses (Figs. 8b, e). Particularly, the response in the GOGA-H experiment is somewhat weaker in mid-June, which seems consistent with the reduced northward shift of the STJ as actually observed in that period. The TOGA experiment also simulates this northward shift (Fig. 8c), although the simulated wind anomalies are somewhat weaker than in the GOGA experiment. The MOGA experiment also simulates the northward shift, but the simulated wind anomalies are generally so weak that the simulated shift is significant only during the heat wave period, especially around mid-July (Fig. 8d). This means that the forcing on the poleward STJ shift was mainly caused by SST anomalies in the Tropics, and SST anomalies in the midlatitude North Pacific may also contribute especially to the heat wave in mid-July.

(a) Anomalies of 200-hPa zonal wind zonally (colored) averaged for 120–160°E (m s−1) from June 1 through July 31, 2018, in the reanalysis and its climatological-mean (black contours with intervals of 5 m s−1, and zero line is thickened). These fields are subjected to 5-day running mean. (b) As in (a), but for the response of the GOGA experiment (red and blue contours are for 2, 4, 6… m s−1 and −2, −4, −6… m s−1, respectively.) and zonal wind of the CLM experiment (black contour). (c, d, e) As in (b), but for (c) the TOGA, (d) MOGA, and (e) GOGA-H experiments.
We have also checked contributions to the poleward shift of the STJ axis from sub-weekly eddies through their meridional momentum transport. However, their contribution is generally weak or out of phase relative to the anomalous westerlies in the reanalysis (not shown). This suggests that the observed circulation anomalies during the summer are mostly dominated by low-frequency dynamics.
4.2 Tropospheric warmness in the midlatitude Northern HemisphereKobayashi and Ishikawa (2019) have reported that the zonal-mean tropospheric temperatures in the mid-latitude Northern Hemisphere was extremely warmer than the climatology persistently from autumn 2017 to summer 2018. They argued that this zonal-mean anomalous warmness was forced by zonal-mean anomalous convective activity in the northern subtropics (around 15°N) and contributed to the anomalous warmness over Japan in summer 2018. This persistent midlatitude warmness in the troposphere is indeed evident in zonally averaged 500-hPa temperatures in the reanalysis (Fig. 9a). As its ensemble response, the GOGA experiment simulates the warm anomaly over the midlatitude Northern Hemisphere in June and July 2018, with its maximum about 1.2°C (Fig. 9b). The TOGA experiment also simulates this midlatitude warm anomaly, although its magnitude is only 0.8°C or less (Fig. 9c). Though even weaker, the corresponding warm response in the MOGA experiment is still significant and clearly exhibits a midlatitude maximum (Fig. 9d). These results suggest that the SST anomalies not only in the Tropics but also in the midlatitude North Pacific were likely to contribute to the persistent warm anomaly in the midlatitude troposphere in summer 2018. In our future study, we will investigate whether the corresponding SST anomalies observed over the extratropical North Atlantic contribute to the persistent anomalous warmness.

(a) Anomalies of zonally averaged 500-hPa temperatures in the reanalysis (K, colored). (b, c, d) As in (a), but for the response in the (b) GOGA, (c), TOGA, and (d) MOGA experiments (interval: 0.2 K and contours equal to or larger than 1.0 K are thickened).
In the preceding sections, we have focused mainly on ensemble-mean fields to discuss forced components of atmospheric variability. In this subsection, we select two members among the ensemble members: one simulates the largest precipitation over the Chugoku area during the heavy rainfall period (22.9 mm day−1) and the other the highest temperature anomalies over Japan during the heat wave event (+2.3 K). The former is from the TOGA experiment and the latter from the GOGA experiment.
The member with the largest precipitation accompanies a positive precipitation anomaly, not only over western Japan but also over eastern Japan (Fig. 10a). A cyclonic anomaly is evident to the southwest of Japan as in the reanalysis and ensemble-mean response in the GOGA experiment (Figs. 2a, d). Unlike in the ensemble-mean response, the cyclonic anomaly accompanies a strong northward moisture flux toward western Japan. Although no anticyclonic anomaly is simulated to the east of Japan, there is an anticyclonic anomaly to the north of Japan. As in the reanalysis, this anticyclonic anomaly seems be associated with the amplification of the Okhotsk high. In the midtroposphere, the anomalous horizontal temperature advection is positive in association with the anomalous southeasterlies (Fig. 10b) as in the reanalysis (Fig. 2b). An anticyclonic vorticity anomaly is also simulated over the northern part of Japan as in the reanalysis. Those circulation anomalies should set a favorable condition for more precipitation in this particular member than in the ensemble-mean responses. This member accompanies a negative anomaly of velocity potential to the south of Japan (Fig. 11a), which is also evident in the reanalysis and ensemble-mean responses (Figs. 3c, d). Meanwhile, the wave train observed along the STJ in the reanalysis (Fig. 3e) is not reproduced in the particular member (Fig. 11c).
(a, b, c) As in Figs. 2a–c, respectively, but for anomalies in a particular member with the largest precipitation within western Japan among the ensemble members. (d, e, f) As in Figs. 4a–c, respectively, but for anomalies simulated in a particular member with the highest temperatures over Japan.
(a, c) As in Figs. 3c, e, respectively, but for anomalies of a particular member with the largest precipitation within western Japan among the ensemble members. (b, d) As in Figs. 5c, e, respectively, but for anomalies of a particular member with the highest temperatures over Japan. (e, f) Standard deviation of 200-hPa meridional wind velocity among all the ensemble members (e) during the heavy rainfall period and (f) during the heat wave period. (g, h) Standard deviation of 200-hPa meridional wind velocity associated with year-to-year variability in the reanalysis for the corresponding periods of (g) the heavy rainfall and (h) the heat wave events.
The particular member with the strongest warm anomaly over Japan during the heat wave event simulates a lower-tropospheric warm anomaly and anticyclonic vorticity anomaly both over Japan (Figs. 10d, e), as in the reanalysis and ensemble-mean response (Figs. 4a, b, g, h). An anticyclonic anomaly is also observed in the upper troposphere to the north of its lower-tropospheric counterpart (Fig. 10f), which is accompanied by a negative anomaly of velocity potential to the south of Japan (Fig. 11b), as in the reanalysis (Fig. 5c). The wave train is also simulated along the STJ (Fig. 11d), though weaker than in the reanalysis (Fig. 5e).
The wave train signature along the STJ in each of the two extreme events among the ensemble members (Figs. 11c, d) tends to be weaker than in the reanalysis (Figs. 3e, 5e). In fact, the variance of upper-tropospheric meridional wind among the ensemble members of our AGCM experiments is smaller (Figs. 11e, f) than the corresponding variance of year-to-year fluctuations in the reanalysis in both the heavy rainfall and heat wave periods (Figs. 11g, h). In the reanalysis, the zonally extended maxima of the variance are observed over the southern and northern portions of Eurasia, which are likely to correspond to Rossby waves propagating along the STJ and PFJ, respectively. Our model can simulate the wave propagation to some extent as internal variability, but their amplitudes tend to be underestimated than in the reanalysis.
We have investigated atmospheric circulation anomalies that caused the two extreme events observed over Japan in July 2018. The heavy rainfall event in early July was caused mainly by the extremely large moisture flux from the Tropics in conjunction with a cyclonic anomaly to the southwest of Japan and an anticyclonic anomaly to the east of Japan both in the lower troposphere. Our AGCM experiments with observed SSTs prescribed cannot simulate the anomalous northward moisture flux and enhanced precipitation over western Japan as the ensemble-mean response, arising in part from the failure to reproduce the anticyclonic anomaly. This failure is not related to the horizontal resolution of the AGCM but rather attributable to the underestimation of two stationary Rossby wave trains over Eurasia in the model: one is observed along the PFJ over the Siberian coast, and the other is the Silk Road teleconnection along the STJ. Those wave trains were unlikely to be forced by SST anomalies but rather manifestations of internal atmospheric variability.
Our AGCM experiments with observed SSTs prescribed were able to simulate the anomalous warmness over Japan during the heat wave event in mid- and late July, suggesting that the observed heat wave was, at least in part, forced by SST anomalies. The tropical SST anomalies activated cumulus convection to the east of the Philippines and could thereby force anticyclonic anomalies over Japan by triggering the PJ pattern, which is the essential element of the leading mode of the atmospheric circulation variability over the western North Pacific, both in the observations and in our AGCM simulations. The SST anomalies over the extratropical North Pacific have the potential to contribute to the amplification of the first mode and thereby to the anomalous warmness. Thus, our ensemble AGCM experiment with prescribed global SST has revealed a certain level of potential predictability of the heat wave event. Nevertheless, the experiment still underestimates the extreme warmness observed over Japan. One of the reasons for this underestimation may be that the AGCM resolution is not sufficiently high. In fact, the area-averaged temperature anomaly over Japan in the GOGA-H experiment (nearly 50 km resolution) is 1.6°C, which is higher than that in the GOGA experiment (nearly 100 km resolution) (Table 2). Another reason may be that the wave train observed along the STJ that also contributed to the extreme warmness is not simulated in our experiments as ensemble responses, which is consistent with the study by Imada et al. (2019), but inconsistent with that by Liu et al. (2019). The mechanisms for triggering the wave train and its influence on the heat wave event require further investigation.
Our AGCM experiments have also revealed that the persistent poleward shift of the STJ axis over the western North Pacific and the persistent tropospheric warmness in the midlatitude Northern Hemisphere in early summer 2018 were likely to be forced by SST anomalies mainly in the Tropics and also partly by those in the midlatitude North Pacific. The results obtained in this study suggest the necessity to evaluate the role of SST anomalies in the extratropics in addition to the Tropics for better seasonal prediction of the midlatitude climate.
This study is supported in part by the Japanese Ministry of Education, Culture, Sports, Science and Technology (MEXT) through the Arctic Challenge for Sustainability (ArCS) Program and by the Japanese Ministry of Environment through the Environment Research and Technology Development Fund 2-1904. This work is also supported by the Japan Society for the Promotion of Science (JSPS) through a Grant-in-Aid for Scientific Research in Innovative Area 6102 (KAKENHI Grant No. JP19H05702) and through KAKENHI Grants JP16H01844, JP18K19951, and JP20H01970 and by the Japan Science and Technology Agency through Belmont Forum CRA “InterDec”. K. N. is also supported by KAKENHI Grants JP17H02958 and JP19H01964. The Earth Simulator was utilized in support of JAMSTEC. The JRA-55 reanalysis dataset is provided through the JMA Data Consortium, and the NOAA Optimum Interpolation SST data (OISST) are provided by the NOAA-CIRES Climate Diagnostics Center, Boulder, Colorado, from their website (https://www.cdc.noaa.gov/). The Grid Analysis and Display System (GrADS) was used for drawing figures.