Abstract
Objective: In the present study an attempt was made to estimate coefficients of dose response curves for PCC aberrations induced by CalyculinA and Okadaic acid, using 60Co gamma radiation and 8 MeV pulsed electron beam for biodosimetry application. Materials and Methods: The modified method outlined by Puig et al. 2013 was used to conduct Calyculin A and Okadaic acid induced PCC assay in human blood lymphocytes.Chemical treatment was given for the last 1 h of a 48 h culture. The study was carried out in the dose range 2.5 to 20 Gy using 60Co gamma rays and 8 MeV pulsed electron beam. Results and Conclusions: Results show a linear dose dependent increase with a slope of 0.047 ± 0.001 from Calycalin A PCC and 0.048 ± 0.002 form Okadaic acid PCC. The slope of the fragments curve was 0.327 ± 0.006 from Calyculin A and 0.328 ± 0.006 from Okadaic acid PCC. Further, dose calibration studies were carried out for 8 MeV electron using Calyculin A PCC assay and the obtained slope from ring yield was 0.054 ± 0.002 and 0.427 ± 0.009 from fragment yield.
Introduction
The conventional cytogenetic dosimetry, the gold standard chromosomal aberration assay, fails to estimate high radiation dose exposure due to mitotic delay and severe leukopenia. Therefore, it is not always possible to make chromosome preparations containing a sufficient number of metaphase cells necessary for the dose estimation. Hence, there is a need to establish a reliable, easier, and quicker method for biodosimetry, which depends on interphase chromosomes. When cycling cells enter mitosis, the chromatin condenses into chromosomes. Techniques have been developed to cause chromatin to condense at earlier stages in the cell cycle (before mitosis) and dose estimation can be done by measuring ring frequency. The technique is termed as the Premature Chromosome Condensation (PCC) assay. The PCC assay was first reported by Johnson and Rao in 19701). The premature condensation was induced by fusing the interphase cells to mitotic CHO or HeLa cells using Sendai virus or polyethylene glycol (PEG) as fusing agents. Fusion by means of Sendai virus requires cells with membranes, especially receptive to the virus particles. G0lymphocytes cannot be satisfactorily fused using Sendai virus. This difficulty was overcome for the purpose of biological dosimetry with the use of PEG for PCC induction. However, this fusion method has several disadvantages, such as complicated operation, low PCC index, and the requirement of mitotic and fusing cells. In 1993, Dyban et al.2) reported that Okadaic acid, a specific inhibitor of PP1 and PP2A phosphoprotein phosphatases, induced PCC in mouse embryo cells. Furthermore, Gotoh et al.3) reported that PCC was also inducible by the protein phosphatise Calyculin A in many types of cells with high efficiency. In addition, Kanda et al.4) reported the dose response relationship of PCC rings in lymphocytes and proposed an easy method of scoring PCC rings in Giemsa stained PCC spreads induced by Okadaic acid (OA). They also estimated the doses in three Tokaimura criticality accident victims using this assay5). Recently, many groups used chemically induced PCC assay for dose estimation6-10). The present study deals with standardization of CalyculinA and Okadaic acid induced PCC assay, and dose response studies with 60Co gamma rays in the dose range 0 to 20 Gy. The study also involves standardization CalyculinA induced PCC assay for 8 MeV pulsed electron beam.
Materials and Methods
Chemicals
Phytohaemagglutinin (PHA), CalyculinA, and Okadaic acid were purchased from Sigma chemicals (St. Louis, Mo, USA). Roswell Park Memorial Institute medium (RPMI) and Fetal Bovine Serum (FCS) were purchased from Gibco chemicals. The rest of the chemicals were analytical grade and purchased from HiMedia.
Radiation source and Dosimetry
In the present study, the dose response studies were carried out using 60Co-gamma radiation and 8 MeV pulsed electron beam. The gamma radiation was taken from 60Co-gamma chamber-1200 supplied by the Isotope Division, Bhabha Atomic Research Center, and 8 MeV pulsed electron beam from Microtron Accelerator at Mangalore University. The details of the Microtron are given elsewhere11). Fricke dosimeter was used to calibrate and optimize the absorbed dose as described elsewhere12-17). The dose rate of the gamma chamber and Microtron accelerator was determined by the same method and was found to be 1.5 Gy.min-1 and 100 Gy.min-1 respectively.
Blood collection and Irradiation
Peripheral blood samples were collected by venipuncture in heparinized vials from healthy male donors having no pre-history of radiation. Immediately after the collection of blood, the vials were gently agitated to mix the blood with heparin to avoid coagulation. Aliquots of heparinized blood were irradiated to different doses of 0, 2.5, 5, 7.5, 10, 15, 20 Gy of gamma radiation and electron beam.
Cell culture and PCC assay
PCC assay employed in the present study is a modified technique described by Puig et al10). The peripheral blood lymphocytes were incubated for 2 h at 37°C before and after irradiation for repair. Ficoll Histopaque density gradient method was used to separate lymphocytes from whole blood cells. Blood lymphocyte cultures were set up with RPMI 1640 medium supplemented with 20% FCS and 0.2 ml of PHA (final concentration of 20 μg/ml) and incubated 37°C for 48 h. One hour before harvesting i.e., after 47 h of incubation, cultures were centrifuged, culture volume was adjusted to 2.5 cm3, and Calyculin A (50 nM) or Okadaic acid (500 nM) was added to the culture. After about 1 h of incubation with the drug, cultures were harvested and centrifuged at 900 rpm for 8 min to get a firm pellet with a clear supernatant. Supernatant was discarded and a pellet was disturbed and mixed thoroughly using a vertex. Pre-warmed (37°C) hypotonic solution (0.075 M KCl) was added to the pellet with constant vortex mixing. The pellets in the hypotonic solution were incubated at 37°C for 6 min in a pre-warmed water bath and then centrifuged at 900 rpm for 8 min. The cells were fixed by cold fixative solution with 1: 3 mixtures of acetic acid and methanol after removing the supernatant and gentle agitation. To prepare the chromosome spread on slides, the cells were mixed thoroughly and dropped on a pre-cleaned frozen slide from a certain height (~30 cm) followed by quick warm and air blow on the slide surface to get better spread of metaphase chromosomes. The slides were stained using giemsa stain for 10 to 12 min by dipping in staining solution and washing 3 to 4 times with a d.d.w. The slides were mounted with a cover slip using Deepex before scoring. PCC spreads were analyzed at 100X magnification with an Olympus BX 51 fluorescent microscope coupled to a Jenoptik C5 cooled CCD camera with ProgRes Capture Pro 2.8 software. 100rings per dose were scored. Two scoring criteria were used; one as suggested by Kanda et al.4), which includes all spherical shaped PCC rings, and another suggested by Lamadrid et al.18), which strictly limits ring evaluation to those which clearly defined open space. Extra fragments were recorded as those exceeding 46 pieces in G2/M PCC cells and 92 pieces in case of M/A PCC cells. For each ring, one fragment was not considered as extra fragment. For curve fitting, the minimum Chi-square method using Origin package was used. The distribution of PCC rings were analyzed by Papworth's u test19). The detailed statistical analysis is given elsewhere20). Briefly, the mean number of observed rings per cell (y) is given for each dose (D) along with relative variance (σ2/y) and the dispersion index (u). The u values are calculated using the relation;

where, N is the number of cells scored. σ2is the variance calculated by the relation;

where, N0, N1, N2…Ni refer to the number of cells carrying 0, 1, 2…i rings, respectively. The positive and negative 'u' value indicates overdispersion and underdispersion respectively, as compared to perfect Poisson distribution (u = 0). If the value of u is greater than ± 1.96, then the dispersion is significant at 95% confidence level. Only a 5% probability exists that the magnitude of u will be greater than 1.96 when the underlying distribution follows Poisson statistics19). The yield y was calculated using the relation;

The Poisson error in yield was calculated using the relation;

Results and Discussion
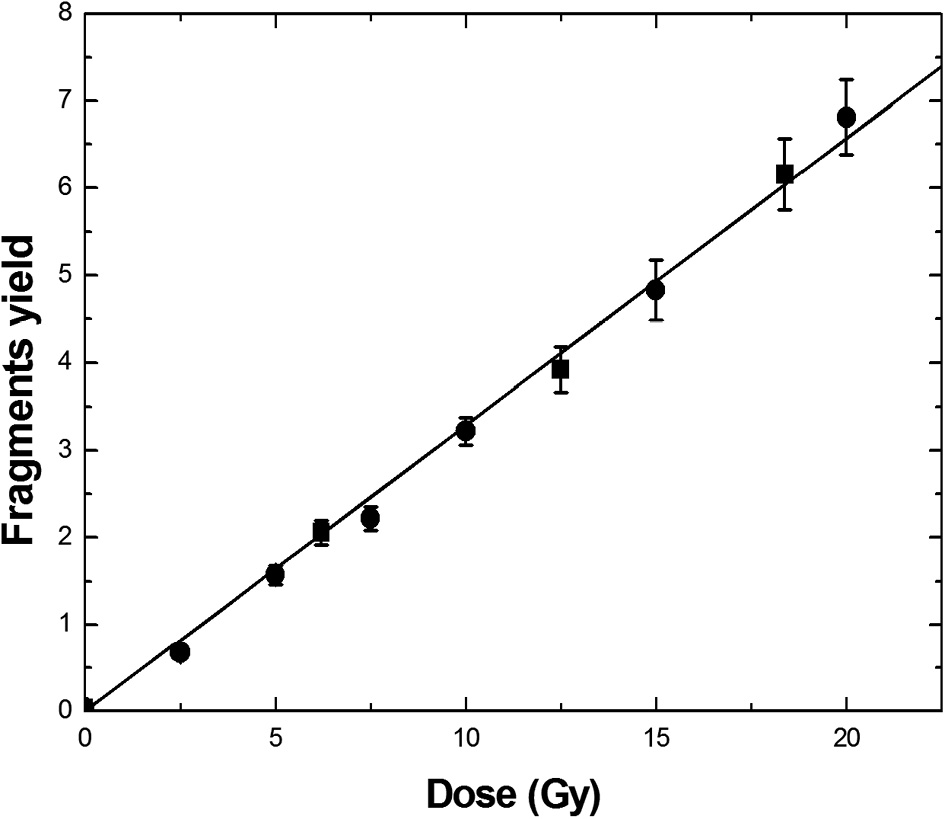
The ring frequency and their distribution are summarized in Table 1, 2 after the gamma radiation treatment. Fig. 1 shows the Giemsa stained G2/M PCC spread with 2 centric rings. Cells with attached sister chromatid are G2/M PCC and cells with separate sister chromatid are G2/A PCC. The dose response of the centric rings and excess fragments induction after gamma and electron beam treatment is shown in Fig. 2 to 5.
Table 1.
Frequencies and ring distribution after irradiating with gamma radiation in human lymphocytes assessed using Calyculin A PCC assay
| Dose (Gy) |
No. of cells |
Centric rings frequency |
No. of Centric rings |
Centric rings yield |
S.D |
u-value |
| 1 |
2 |
3 |
4 |
| 0 |
1000 |
0 |
0 |
0 |
0 |
0 |
0 |
0 |
― |
| 2.5 |
1500 |
104 |
0 |
0 |
0 |
104 |
0.069 |
0.007 |
–1.88 |
| 5 |
520 |
99 |
1 |
0 |
0 |
101 |
0.194 |
0.019 |
–1.53 |
| 7.5 |
370 |
97 |
3 |
1 |
0 |
106 |
0.286 |
0.028 |
1.34 |
| 10 |
208 |
85 |
6 |
1 |
0 |
100 |
0.481 |
0.048 |
1.49 |
| 15 |
152 |
80 |
7 |
3 |
1 |
107 |
0.704 |
0.068 |
1.002 |
| 20 |
110 |
66 |
13 |
3 |
2 |
109 |
0.991 |
0.095 |
0.98 |
Table 2.
Frequencies and ring distribution after irradiating with gamma radiation in human lymphocytes assessed using Okadaic acid PCC assay
| Dose (Gy) |
No. of cells |
Centric rings frequency |
No. of Centric rings |
Centric rings yield |
S.D |
u-value |
| 1 |
2 |
3 |
4 |
5 |
| 0 |
1000 |
0 |
0 |
0 |
0 |
0 |
0 |
0 |
0 |
― |
| 2.5 |
1499 |
105 |
0 |
0 |
0 |
105 |
105 |
0.07 |
0.007 |
–1.90 |
| 5 |
515 |
102 |
1 |
0 |
0 |
102 |
104 |
0.202 |
0.019 |
–1.70 |
| 7.5 |
374 |
99 |
3 |
1 |
0 |
99 |
108 |
0.289 |
0.028 |
1.219 |
| 10 |
204 |
88 |
6 |
2 |
0 |
88 |
106 |
0.520 |
0.050 |
1.75 |
| 15 |
145 |
83 |
6 |
3 |
1 |
83 |
108 |
0.745 |
0.072 |
–0.09 |
| 20 |
114 |
71 |
11 |
3 |
2 |
71 |
110 |
0.965 |
0.092 |
0.08 |


The results show a linear dose dependent increase in centric rings, excess fragments frequency for gamma radiation in Calyculin A and Okadaic acid induced premature chromosomes. From Table 1, 2, it may be noted that the u-values for the studied doses are between ± 1.96, which confirms that the ring frequency follows a Poisson distribution. The Poisson distribution is a characteristic feature of low LET radiation exposure. Many investigators have reported perfect Poisson distribution of ring frequency for low LET radiation in vitro6,7,9,10,21). Since ring and fragment yield varies linearly with the dose, results were fit to a linear model and the coefficients of the linear model are shown in Table 3. The obtained α value, when rings are considered, were found to be 0.047 ± 0.001 Gy-1 from Calycalin A PCC and 0.048 ± 0.002 Gy-1 form Okadaic acid PCC, which are comparable with the reported results. Recently, Romero et al.9) obtained an α value of 0.044 ± 0.0012 Gy-1 from Calycalin A PCC, which is comparable with the present results. The α value reported by Puig et al.10) and Lindhom et al.7) was 0.027 ± 0.003 Gy-1 and 0.021 ± 0.01 Gy-1, respectively, which are lower values compared to the present study. The less α value in their case may be because of the combined treatment of colcemid and Calyculin A. In the present study, the obtained α value from Okadaic acid PCC was 0.048 ± 0.002 Gy-1, which is comparable with the α value reported by Daniela et al.6) (0.0489 ± 0.006 Gy-1), Lindhom et al.7) (0.049 ± 0.01 Gy-1) and Balakrishnan et al.8) (0.054 ± 0.01 Gy-1).
Table 3.
Coefficients of the linear model after irradiation of blood lymphocytes with
60Co gamma radiation
| Parameter |
Centric rings |
Fragments |
| PCC (Calyculin A) |
PCC (Okadaic acid) |
PCC (Calyculin A) |
PCC (Okadaic acid) |
| Slope (α) (Gy–1) |
0.047 ± 0.001 |
0.048 ± 0.002 |
0.327±0.006 |
0.328 ± 0.006 |
| R2 |
0.99 |
0.99 |
0.999 |
0.999 |
| P |
<0.0001 |
<0.0001 |
<0.0001 |
<0.0001 |
From Fig. 1 and 2, it is clear that there is no significant difference between Calyculin A and Okadaic acid PCC curves. The slope of the fragments curve is 0.327 ± 0.006 Gy-1from Calyculin A and 0.328 ± 0.006 Gy-1 from Okadaic acid PCC. The fragments curve slopes are slightly less compared to the reported results, 0.41 ± 0.04 Gy-1 by Puig et al.10) and 0.45 ± 0.03 Gy-1 by Balakrishnan et al8). The fragments slope may be less because of more G2/M PCC cells observed in this study.
The percentage of PCC spreads induced by Calyculin A and Okadaic acid at various doses of gamma radiation was calculated and presented in Table 4. The percentage of PCC spread was calculated using following equation.
Table 4.
PCC spreads (%) after irradiating with gamma radiation
| Donor 1 |
Dose (Gy) |
0 |
2.5 |
5 |
7.5 |
10 |
15 |
20 |
| No. of cells |
1013 |
1002 |
1006 |
1005 |
1018 |
1002 |
1004 |
| G2/M |
913 |
926 |
948 |
978 |
974 |
977 |
975 |
| M/A |
100 |
76 |
58 |
27 |
44 |
25 |
29 |
| PCC Spreads (%) |
(Calyculin A) |
48 |
47 |
56 |
68 |
64 |
57 |
54 |
| (Okadaic acid) |
17 |
19 |
21 |
16 |
13 |
11 |
7 |
| Donor 2 |
No. of cells |
1007 |
1003 |
1006 |
1008 |
1008 |
1012 |
1001 |
| G2/M |
847 |
867 |
904 |
921 |
914 |
927 |
912 |
| M/A |
160 |
136 |
102 |
87 |
94 |
85 |
89 |
| PCC Spreads (%) |
(Calyculin A) |
36 |
38 |
42 |
47 |
41 |
43 |
32 |
| (Okadaic acid) |
12 |
14 |
14 |
9 |
10 |
11 |
6 |
Table 5.
Frequency and ring distribution after irradiating with 8 MeV electron radiation in human lymphocytes assessed using Calyculin A PCC assay
| Dose (Gy) |
No. of cells |
Centric rings frequency |
No. of Centric rings |
Centric rings yield |
S.D |
u-value |
| 1 |
2 |
3 |
4 |
| 0 |
1000 |
0 |
0 |
0 |
0 |
0 |
0 |
0 |
― |
| 2.5 |
1523 |
110 |
1 |
0 |
0 |
112 |
0.074 |
0.007 |
0.59 |
| 5 |
502 |
108 |
3 |
0 |
0 |
114 |
0.23 |
0.021 |
0.47 |
| 7.5 |
370 |
104 |
3 |
1 |
0 |
113 |
0.31 |
0.029 |
0.72 |
| 10 |
203 |
93 |
6 |
3 |
0 |
114 |
0.56 |
0.053 |
1.77 |
| 15 |
141 |
88 |
6 |
3 |
1 |
110 |
0.78 |
0.075 |
–0.71 |
| 20 |
101 |
75 |
10 |
4 |
2 |
115 |
1.139 |
0.106 |
–1.54 |

The observed PCC spread (%) was much higher in Calyculin A compared to Okadaic acid PCC assay. From Table 4, it may be noted that the increase in G2/M PCC spreads until 7.5 Gy followed by a plateau, whereas decrease in M/A PCC spreads with the radiation dose. A similar observation was reported by Miura et al.22), who observed an increase in G2/M PCC spread until 8 Gy and thereafter it attained a plateau and decrease in M/A PCC cells. A higher PCC index was observed for Calyculin A compare to Okadaic acid, which restricted 8 MeV electron studies on Calyculin A. The results show a linear dose dependent increase in centric rings and excess fragments frequency, and the ring distribution follows the Possion distribution (Figure 4, 5). A similar dose response relation was observed in gamma radiation studies. The dose response relation can be represented as, Ycentric rings = (0.054 ± 0.002) D (with R2 = 0.99 and P <0.0001) and Yfragments = (0.427 ± 0.009) D (with R2 = 0.99 and P <0.0001). From Figure 4, 5, it is clear that there is a significant difference in ring yield and fragment yield between 8 MeV electrons and 60Co-gamma radiation. The obtained α value for ring yield is 0.047 ± 0.001 Gy-1 for gamma radiation and 0.054 ± 0.002 Gy-1 for 8 MeV electrons. The α values from fragment yield is 0.327 ± 0.006 Gy-1 for gamma radiation and 0.427 ± 0.009 Gy-1 for 8 MeV electrons. The obtained higher α values for electron beam may be because of higher RBE value of the radiation. The higher RBE values of the 8 MeV electron beam have been reported elsewhere15,20,23).
Conclusions
The present study reveals that the CalyculinA and Okadaic acid induces similar ring and fragment yield. But PCC spreads percentage is higher in CalyculinA PCC assay, which is an important parameter in biodosimetry. Dose calibration studies confirm that the ring and fragment yield increases linearly with the doses and slightly higher yields were obtained for 8 MeV pulsed electron beam compared to gamma radiation.
Acknowledgments: The authors are grateful to Board of Research in Nuclear Sciences, Department of Atomic Energy, Government of India, for the financial support. Authors are thankful to Dr. Pradeep Kumar, Director, HSE & G, BARC, Mr. D.A.R. Babu, Head, RP & AD, BARC, India for technical discussions, support, and help. Technical assistance during the experiments by Mr. U. B. Thorat, Mr. S. Jagtap, and Mr. P. Tondlekar are thankfully acknowledged.
Conflicts of interest: The authors declare that there are no conflicts of interest.
References
- 1) Johnson RT, Rao P N. Mammalian cell fusion: induction of premature chromosome condensation in interphase nuclei. Nature 1970; 226: 717-722.
- 2) Dyban AP, De Sutter P, Verlinsky Y. Okadaic acid induces premature chromosome condensation reflecting the cell cycle progression in one-cell stage mouse embryos. Mol Reprod Dev 1993; 34: 402-415.
- 3) Gotoh E, Asakawa Y, Kosaka H. Inhibition of protein serine/threonine phosphatases directly induces premature chromosome condensation in mammalian somatic cells. Biomed Res 1995; 16: 63-68.
- 4) Kanda R, Eguchi-Kasai K, Itsukaichi H, Mori M, Hayata I. Chemically induced premature chromosome condensation in human fibroblast cell lines: fundamental study for applications to the biodosimetry of local exposure. Somat Cell Mol Genet 1999; 25: 317-325.
- 5) Kanda R, Minamihisamatsu M, Hayata I. Dynamic analysis of chromosome aberrations in three victims of the Tokaimura criticality accident. Int J Radiat Biol 2002; 78: 857-862.
- 6) Daniela S, Carita L, Alicja J. Development and application of the PCC biodosimetry method in emergency preparedness. Final report of the NKS-B project Biodosimetry Applications in Emergency Preparedness-BioDos. 2006-2007 NKS-173 (2008) ISBN 978-87-7893-239-6
- 7) Lindhom C, Stricklin D, Jaworska A, et al. Premature chromosome condensation (PCC) assay for dose assessment in mass casualty accidents. Radiat Res 2010; 173: 71-78.
- 8) Balakrishnan S, Shirsath K, Bhat N, Anjaria K. Biodosimetry for high dose accidental exposures by drug induced premature chromosome condensation (PCC) assay. Mutat Res 2010; 699: 11-16.
- 9) Romero I, García O, Lamadrid AI, et al. Assessment of simulated high-dose partial-body irradiation by PCC-R assay. J Radiat Res 2013; 54: 863-871.
- 10) Puig R, Barrios L, Pujol M, Caballín MR, Barquinero JF. Suitability of scoring PCC rings and fragments for dose assessment after high-dose exposures to ionizing radiation. Mutat Res 2013; 757: 1-7.
- 11) Siddappa K, Balakrishna KM, Ramamurthi SS, et al. Variable energy microtron for R & D work. Radiat Phys Chem 1998; 51: 441-442.
- 12) Fricke H, Hart EJ. Radiation Dosimetry, Vol II. In: Allix FH, SC, editors. New York: Academy Press, WC; 1968.
- 13) Nairy R, Bhat NN, Anjaria KB, Sreedevi B, Sapra BK, Narayana Y. Study of gamma radiation induced damages and variation of oxygen enhancement ratio with radiation dose using Saccharomyces cerevisiae. J Radioanal Nucl Chem 2014; 302: 1027-1033.
- 14) Joseph P, Nairy R, Acharya S, Ganesh S, Narayana Y. Chemical dosimeters for electron beam dosimetry of microtron accelerator. J Radioanal Nucl Chem 2014; 302: 1013-1019.
- 15) Joseph P, Narayana Y, Nairy R, Ganesh S, Bhat NN. Assessment of electron and gammainduced DNA damage in human peripheral blood by Alkaline comet assay. Radiation Protection and Environment 2011; 34: 221-224.
- 16) Chaurasiaa KR, Balakrishnana S, Kunwarb A, et al. Cyto-genotoxicity assessment of potential radioprotector,3,3-diselenodipropionic acid (DSePA) in Chinese Hamster Ovary (CHO) cells and human peripheral blood lymphocytes. Mutat Res 2014; 774: 8-16.
- 17) Joseph P, Acharya S, Sanjeev G, Bhat NN, Narayana Y. Cell inactivation studies on yeast cells under euoxic and hypoxic condition using electron beam from microtron accelerator. J Radioanal Nucl Chem 2011; 290: 209-214.
- 18) Lamadrid AI, García O, Delbos M, Voisin P, Roy L. PCC-ring induction in human lymphocytes exposed to gamma and neutron irradiation. J Radiat Res 2007; 48: 1-6.
- 19) Papworth DG. Appendix to paper by Savage JRK Sites of Radiation Induced Chromosome Exchanges. Curr Top Radiat Res 1970; 6: 129-194.
- 20) Nairy RK, Bhat NN, Sanjeev G, Yerol N. Dose response study using Micronuclueus cytome assay-A tool for biodosimtry application. Radiat Prot Dosimetry 2016.
- 21) Lamadrid Boada AI, Romero Aguilera I, Terzoudi GI, González Mesa JE, Pantelias G, García O. Rapid assessment of high-dose radiation exposures through scoring of cell-fusion-induced premature chromosome condensation and ring chromosomes. Mutat Res 2013; 757: 45-51.
- 22) Miura T, Nakata A, Kasai K, et al. A novel parameter, cell-cycle progression index, for radiation dose absorbed estimation in the premature chromosome condensation assay. Radiat Prot Dosimetry 2014; 159: 52-60.
- 23) Nairy RK, Bhat NN, Joseph P, Sanjeev G, Yerol N. Studies on electron beam induced DNA damage and repair kinetics in lymphocytes by alkaline comet assay. Int J Radiat Res 2015; 13: 213-220.
