Review
Development of Analytical Methods and Nutritional Studies Using Synthetic Fatty Acids and Triacylglycerols
2021 Volume 70 Issue 1 Pages 1-9
Details
2021 Volume 70 Issue 1 Pages 1-9
The metabolism of fatty acids or triacylglycerol (TAG) is affected by their molecular structures. Several methods to separate and quantify TAG isomers in natural fats and oils were developed. For instance, an analytical method of TAG molecular species using a gas chromatograph-flame ionization detector and the analytical method to separate and quantify TAG positional isomers and enantiomers using a high performance liquid chromatograph-mass spectrometer were established. Furthermore, using these analytical methods, the relationship between molecular structure and metabolism of fatty acid and TAG were investigated. Using the CO2 breath test in ddY mice revealed that saturated fatty acids such as palmitic acid bound to the sn-2 (β) position of TAG were highly catabolized in the presence of calcium, whereas saturated fatty acids bound to the sn-1, 3 (α) position of TAG were not well catabolized. Recently, the distribution of dietary fatty acids in the body were visualized by combining a stable isotope labeling technique with imaging mass spectrometry, which revealed that the administered arachidonic and docosahexaenoic acid accumulated as phospholipid in the mouse brain. The methods developed can assess food quality and create new functional foods.
Triacylglycerol(TAG) is the primary component of edible fats and oils in plant and animals. TAG is comprised of a glycerol backbone and three fatty acids 1) . According to the Fischer projection 2) , the binding positions on the glycerol backbone are distinguished as sn-1 (α), sn-2 (β), and sn-3 (α) positions, as shown in Fig. 1. The specific position to which fatty acids bind affects their absorption and function in both animals and humans. For instance, palmitic acid (P) is predominantly found at the β position on TAG in human milk, as this allows infants to get energy more easily 3) , 4) . Likewise, n-3 series of polyunsaturated fatty acids (PUFAs) in fish oil, including eicosapentaenoic acid (EPA) and docosahexaenoic acid (DHA), were mainly esterified at the β position; however, n-3 PUFAs in seal oil were primarily located at the α position 5) . Previously, the effects of binding position of EPA and DHA to TAG were compared with respect to the lipid metabolism in C57BL/6J mice 6) and it was revealed that DHA bound to the β position more effectively reduced TAG and cholesterol concentrations in the liver than DHA bound to the α position, whereas EPA bound to the α-position of TAG, but not EPA bound to the β-position of TAG, significantly decreased the cholesterol concentration in the liver. In this way, the binding positions of fatty acids have considerable effects on the human health. Therefore, the analytical methods to determine TAG structures and compositions in fats and oils have been developed and applied on the investigation of TAG absorption and metabolism in the human body by several researchers. However, these studies required a large amount of pure TAG standards and it is difficult to obtain the standards because of their cost and the limited number of suppliers. To overcome these limitations, pure fatty acids and TAG standards were synthesized, a new analytical method for separation and quantification of TAG isomers in fats and oils developed, and the relationship between the molecular structure and function of lipids investigated.
This review is limited to a brief overview of the following three topics based on results from our studies using synthetic fatty acid and TAG standards: (1) analysis of TAG isomers, (2) metabolism of fatty acids bound to different position of TAG, and (3) visualization of administrated PUFA in the brain.
TAG isomers containing three different fatty acids, A, B, and C, are categorized into three types: TAG molecular species, TAG positional isomers, and TAG enantiomers, as illustrated in Fig. 1. Firstly, the TAG only considering the combination of three fatty acid types is named the TAG molecular species, indicated as ABC. Secondly, in the case of two possible binding positions, the α position (primary alcohol group of the glycerol) and β position (secondary alcohol group of the glycerol), three isomers are possible: β-ABC, β-ACB, and β-BAC (the β prefix means that the fatty acids bound at the β position is fixed). These isomers are called TAG positional isomers. Lastly, the sn-1, sn-2, and sn-3 positions can be distinguished when the central glycerol carbon is a chiral center. In this case, the TAG consisting of A, B, and C has six possible isomers: sn-ABC, sn-ACB, sn-BAC, sn-BCA, sn-CAB, and sn-CBA. The TAG pairs of sn-ABC and sn-CBA, sn-ACB and sn-BCA, or sn-BAC and sn-CAB are called TAG enantiomers. As described above, natural fats and oils are aggregations of these TAG isomers. The physical, chemical, and nutritional properties of fats and oils largely depend on the TAG composition 7) , 8) , 9) . Therefore, a method to quantify the contents of TAG isomers is needed to characterize fats and oils in foods.

Structures of TAG molecular species, positional isomers, and enantiomers.
So far, several analytical methods using high performance liquid chromatograph (HPLC) with a refractive index detector or an ultraviolet detector 10) , 11) , 12) , 13) , or gas chromatograph-flame ionization detector (GC-FID) 14) , 15) , 16) , 17) , 18) were developed to quantify TAG in fats and oils. TAG molecular species can be separated by GC or reversed-phase HPLC. HPLC can separate the respective TAG molecular species by their partition number (PN) 19) or equivalent carbon number (ECN) 20) . The PN (or ECN) is defined by the equation PN=TCN-2×DB, where TCN is the total acyl carbon number and DB is the total double bond number in the three fatty acids esterified on the TAG molecule. TAG molecular species elute in the order of the PN 10) , 11) , 12) , 13) . In addition, TAG molecular species having the same PN, called critical pairs, elute in descending DB order. For example, the TAG molecular species consisting of P and/or oleic acid (O) elute in the following order: OOO<OPO<POP<PPP. In contrast, GC methods result in simple resolution patterns of TAG molecular species. In general, nonpolar capillary columns coated with polysiloxane separate only according to the TCN of TAG molecular species. For example, when TAGs consisting of P, stearic acid (S), O, and/or linoleic acid (L) are analyzed, the TCN52 peak contains SPS, POS, OPO, and POL 14) , 15) , 16) . Furthermore, polar capillary columns coated with high contents of phenyl groups (50–60%) separate TAGs by their TCN in addition to their degree of unsaturation 21) , 22) . However, when TAG molecular species are analyzed by GC-FID, points to consider during analysis are the discrimination 23) , 24) and the thermal decomposition 25) .Therefore, discrimination and thermal decomposition are to be avoided during analysis, and the peak areas of TAGs need to be corrected using factors calculated from TAG standards to obtain high accuracy and precision. Recently, we developed a new GC method using correction factors that reduces the influence of the discrimination and thermal degradation during TAG analysis 26) . Our method using a more polar capillary column coated with 65% diphenyldimethyl polysiloxane separates TAGs by their TCN in addition to their unsaturation degree. In the case that the TCN52 peak described above is analyzed with a polar capillary column, the fully saturated SPS is eluted first, followed by POS, OPO, and finally POL (Fig. 2A). Consequently, our developed method is suitable to quantify TAG molecular species in natural fats and oils.

Chromatograms obtained by GC and HPLC methods. (A) Gas chromatogram of TAG molecular species (TCN:DB) 26) . Column: Ultra ALLOY+-65 (30 m×0.25 mm i.d., 0.10 μm) ; column temperature: 250°C→ (4°C/min) →360°C (25 min hold) ; carrier gas: helium (1.0 mL/min). C10, C12, C14, C15, P, Po, S, O, L represent capric, lauric, myristic, pentadecanoic, palmitic, palmitoleic, stearic, oleic, and linoleic acid, respectively. TCN and DB represent the total acyl carbon number and the total double bond number in the three fatty acids esterified on the TAG molecule, respectively. (B) HPLC chromatogram of TAG positional isomers such as β-POP/β-PPO 31) . Column: Sunrise C28 (4.6 mm i.d.×250 mm, 5 μm) ; column temperature: 15°C; mobile phase: acetone; flow rate: 1.0 mL/min; detection: APCI-MS (Positive, MRM mode, m/z 834 [M+H]+>m/z 578 [M-RCOO]+). (C) HPLC chromatogram of TAG positional isomers and enantiomers such as sn-OPP/sn-PPO/sn-POP and sn-OOP/sn-POO/sn-OPO 37) . Column: CHIRALPAK IF-3 (4.6 mm i.d.×250 mm, 3 μm) ; column temperature: 25°C; mobile phase: acetonitrile; flow rate: 1.0 mL/min; detection: ESI-MS (Positive, Scan mode, m/z 300-1000).
HPLC with a mass spectrometer (MS) is widely used to analyze TAG positional isomers or TAG enantiomers in natural fats and oils. Silver-ion HPLC is the most well-known and popular method to separate TAG positional isomer pairs 27) , 28) , 29) . However, the disadvantage of silver-ion HPLC is the low reproducibility 30) . We developed another HPLC method using an octacosyl (C28) column 31) , 32) , 33) , as shown in Fig. 2B. A C28 column can separate TAG positional isomer pairs with two long-chain saturated fatty acids such as P and S, and one unsaturated fatty acid such as O, L, EPA, and DHA. It can also separate TAG positional isomer pairs with two long-chain saturated fatty acids and one short- or medium-chain fatty acid. Neither silver-ion nor C28 columns separate pairs of TAG enantiomers, such as sn-OPP/sn-PPO. In recent years, studies reported the separation of TAG enantiomers by HPLC using a chiral column. In 2011, we developed a chiral HPLC method using a CHIRALCEL OD-RH (Daicel Corporation, Osaka, Japan) column separating TAG enantiomers containing P and O, such as sn-OPP/sn-PPO and sn-OOP/sn-POO in edible fats and oils 34) , 35) . However, this method required a recycling HPLC system, which allows the unresolved components to pass through the same column repeatedly, the analysis was therefore time-consuming and complex. In 2013, Lisa et al. reported the simultaneous separation of TAG positional isomers and enantiomers with chiral HPLC without using a recycling HPLC system 36) . Their method separated TAG isomers consisting of unsaturated fatty acids such as sn-OLO/sn-LOO/sn-OLL, but incompletely isolated TAG isomers containing P and O, such as sn-OPP/sn-PPO/sn-POP. In 2019, we developed a new simultaneous separation of these TAG positional isomers and enantiomers using a chiral HPLC without recycling 37) . Our method using a CHIRALPAK IF-3 (Daicel Corporation, Osaka, Japan) column can separate TAG isomers, including sn-OPP/sn-PPO/sn-POP, sn-OOP/sn-POO/sn-OPO, sn-LPP/sn-PPL/sn-PLP, sn-LPL/sn-LLP/sn-PLL, sn-OSS/sn-SSO/sn-SOS, sn-OSO/sn-OOS/sn-SOO, sn-LSS/sn-SSL/sn-SLS, and sn-LSL/sn-LLS/sn-SLL, as shown in Fig. 2C. However, TAG isomers consisting of only saturated or unsaturated fatty acids are not isolated. Our HPLC method is especially suitable to analyze the TAG composition of semi-solid fats such as palm oil.
It is known that fatty acids in TAG are catabolized after digestion. Fatty acids in TAG are converted to acyl-coenzyme A (CoA) and the acyl-CoA is catabolized to acetyl-CoA by beta-oxidation in a mitochondria matrix. The acetyl-CoA is then converted to CO2 in the tricarboxylic acid cycle, providing accessible energy 38) . The carbon located in the carboxyl group of the fatty acid is first converted to CO2. Therefore, the 13CO2 formation rates from 1-13C-labeled fatty acids reflect the fatty acid catabolism rates. Thus far, we have synthesized several types of 1-13C-labeled fatty acids and analyzed 13CO2 by isotope ratio mass spectrometer (IRMS) after administering 1-13C-labeled fatty acids to mice to estimate their catabolic rates. For example, the catabolic rates between caprylic acid (C8), pentadecanoic acid (C15), P (C16), and heptadecanoic acid (C17) 39) , and amongst trans-octadecenoic acid isomers 40) and P, O, L, Ln, EPA, and DHA were compared 41) . It was observed that the catabolic rates of fatty acids differed depending on the fatty acid species. In addition, the effect of the binding position of fatty acids in TAG on their catabolic rates using a CO2 breath test in mice was investigated. The catabolic rates of 1-13C-labeled P or O at the sn-1, sn-2, and sn-3 positions of TAG were compared in our previous study 42) . Differences were observed between the α-(sn-1 and sn-3) and β-(sn-2) position, and the fatty acids at the α position were for a short while catabolized faster than those at the β position after administration. In contrast, no significant difference was observed between the sn-1 and sn-3 positions. These results indicated that the catabolic rates of fatty acids are strongly affected by their binding positions in TAG. As part of studies on infant nutrition, we recently investigated the effect of calcium treatment on catabolic rates of 1-13C-labeled fatty acids bound to the α and β positions of TAG using a CO2 breath test in mice 43) . It is known that the presence of calcium affects the absorption efficacy of fatty acids into the body. In general, during TAG digestion, the fatty acids bound to the α position of TAG are hydrolyzed by pancreatic lipase to form 2-monoacylglycerol (2-MAG) and two free fatty acids (FFAs) 44) . In the presence of calcium the 2-MAG is easily absorbed, but FFA that is free of saturated fatty acid, is converted into insoluble calcium soap, which is secreted into the feces 45) . Human milk and infant formulas contain a large amount of calcium ions and saturated fatty acids. Therefore, these are important issues with respect to infant nutrition. However, it is unclear whether absorbed fatty acids are used for energy production. To resolve these issues, we compared the catabolic rates of 1-13C-labeled P(*P), O(*O), and L(*L) bound to the α and β positions of TAG (i.e., β-OO*P, β-O*PO, β-OO*O, β-O*OO, β-OO*L, and β-O*LO, as shown in Fig. 3) in the presence of high amounts of calcium chloride using a CO2 breath test in ddY mice 43) . Figure 4 shows the time course of 13C-labeled CO2 expiration from mice after administration of six TAG positional isomers. As a result, the catabolic rate of P bound to the α position (i.e., β-OO*P) was significantly lower than that of P bound to the β position of TAG (i.e., β-O*PO). The rates of 13CO2 formation from P at the β position remained higher for a long time. In contrast, O and L at the α position (i.e., β-OO*O and β-OO*L) were as well catabolized as were those at the β position (i.e., β-O*OO and β-O*LO). These results indicate that the saturated fatty acid bound to the β position is highly catabolized, whereas saturated fatty acids bound to the α position were not well catabolized in the presence of calcium. The main cause for this low catabolism of saturated fatty acids bound to the α position is their low absorption of saturated fatty acid complexes with calcium. Our study concluded that the most suitable position of palmitic acid as energy source is the β position of TAG. Calcium absorption was improved by avoiding calcium soap formation. This study is expected to further improve infant formulas.

Structures of 13C-labeled TAG used in this study 43) .
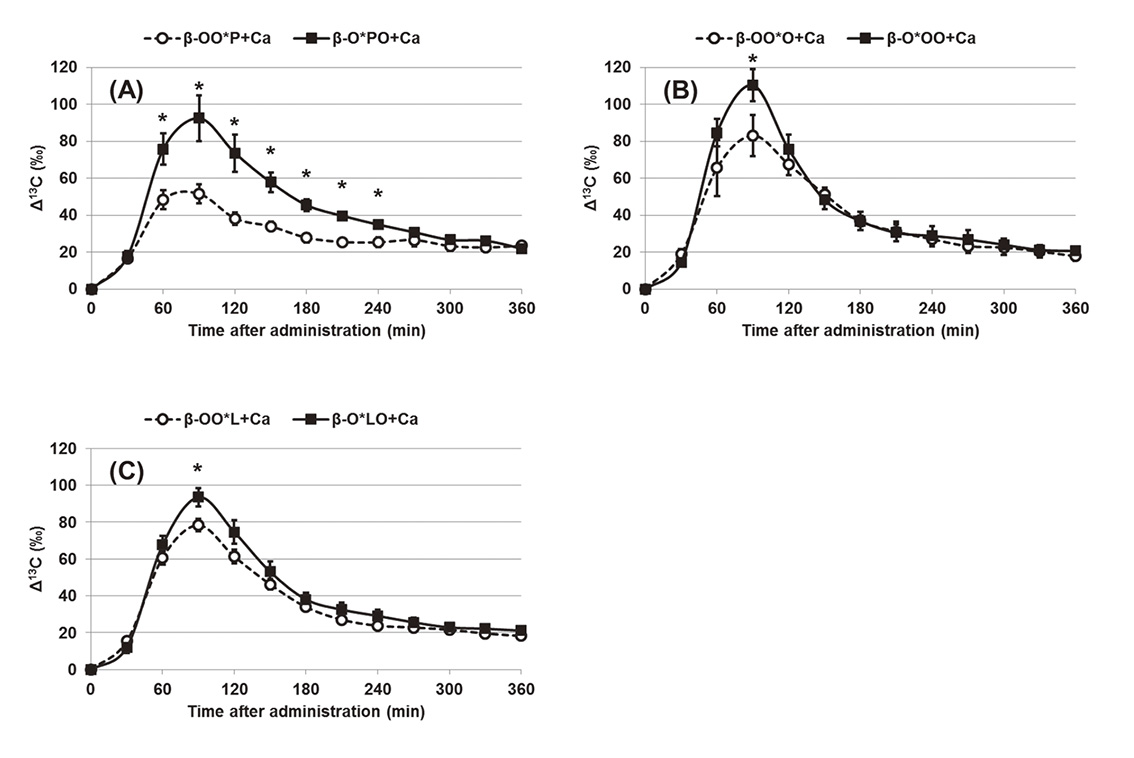
Comparison of Δ13C in CO2 expired from mice after administration of TAG binding 1-13C-labeled fatty acids 43) . (A) : β-OO*P vs. β-O*PO, (B) : β-OO*O vs. β-O*OO, and (C) : β-OO*L vs. β-O*LO. Values are means±SE; n=5. Asterisks indicate significant differences (p<0.05) at the respective sampling time.
The brain contains high levels of PUFAs consisting mainly of DHA (10-16% of total fatty acids) and arachidonic acid (AA, 5-13% of total fatty acids) 46) . These PUFAs cannot be synthesized de novo by mammals and thus must be obtained through diet. Previous studies investigating the relationship between the distribution of PUFA in the brain and the brain function revealed that the decline of cognitive function in aged animals was improved by increasing DHA levels in the hippocampus 47) , 48) . Therefore, information about the distribution of PUFA in the brain is important for human health. Imaging mass spectrometry (IMS) is a technique that visualizes the distribution of target molecules in tissue sections and was used to picture the distribution of PUFAs in the brain, showing that phosphatidylcholine (PC) binds to AA or DHA in hippocampal neurons and the cerebellar cortex 49) , 50) . However, this approach does not determine how much dietary PUFAs accumulate as PC in the brain because dietary and endogenous PUFAs are identical in structure. Stable isotope labeled fatty acids have a higher molecular weight compared to the original ones and both types of acids were distinguished in the brain using IMS. We recently developed a new method for monitoring the distribution of administrated fatty acids in the body by combining stable isotope labeling with IMS 51) . Figure 5 shows the structure of deuterium-labeled AA ((+2) AA) and DHA ((+2) DHA) used and the synthesis scheme. The mice were administered the emulsion containing (+2) AA and (+2) DHA ethyl ester for eight days and the mice brain section was scanned by a matrix-assisted laser desorption/ionization (MALDI) time-of-flight (TOF) mass spectrometer (RapifleX, Bruker Daltonik GmbH, Bremen, Germany). Figure 6A shows the IMS results for the primary PCs. PCs are major components of the brain, and AA and DHA are selectively esterified at the sn-2 position of the glycerol backbone of PC 52) . Therefore, the focus was on representative PCs consisting of P at the sn-1 position and PUFA at the sn-2 position; the potassium adducts [M+K]+ of PC (P/(+2) AA) and PC (P/(+2) DHA) were m/z 822.6 and 846.6, respectively. PC (P/(+2) AA) was specifically observed in the hippocampus and cerebellar cortex in both groups that were administered (+2) AA (Fig. 6A, arrowheads). Moreover, PC (P/(+2) DHA) was enriched in the hippocampus and cerebellar cortex of mice administered for 2 and 8 days. Further, a semiquantitative analysis was performed by correlating the MS intensities (Fig. 6B). This figure shows that PC (P/(+2) AA) and PC (P/(+2) DHA) increased with time. These results suggested that the combination of IMS and stable isotope labeling developed in this study can prove that dietary AA or DHA accumulate as PC in the brain.

Structure and synthetic scheme of deuterium (D) labeled PUFA ((2+) PUFA) 51) . Each reaction represents hydrogen-deuterium exchange (i), hydrolysis (ii), and transesterification (iii). R-CH2-COOCH3, R-CD2-COOCH3, R-CD2-COOH, R-CD2-COOCH2CH3 represent PUFA methyl esters, ((+2) PUFA) methyl ester, (+2) PUFA, (+2) PUFA ethyl esters, respectively.
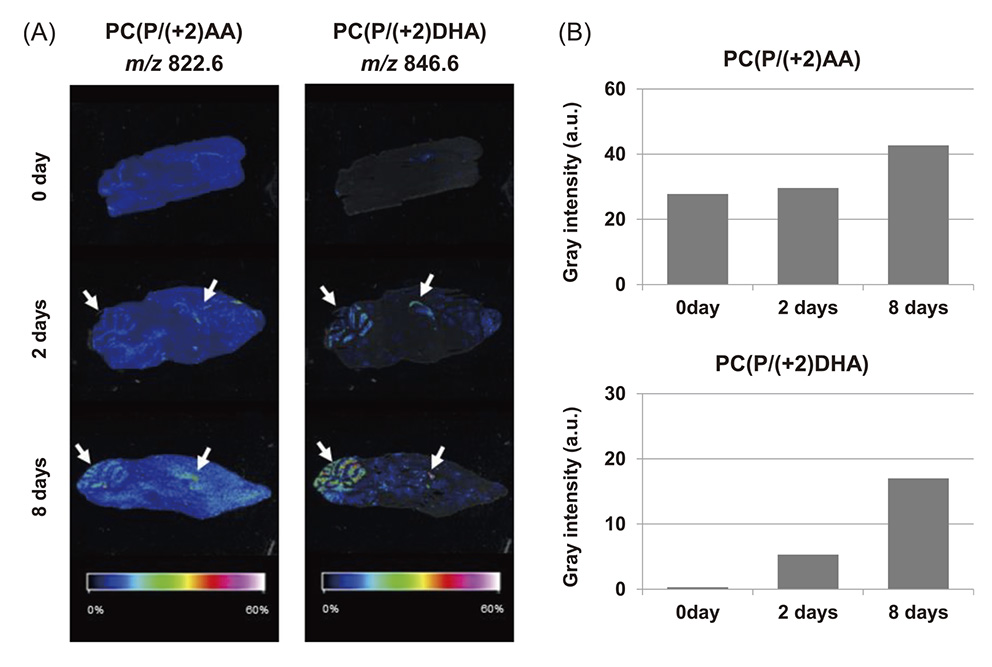
Distribution of dietary (+2) PUFA in mouse brain 51) . (A) MALDI image of lipids in the mouse brain section. m/z 822.6 [M+K]+ for PC (P/(+2) AA) and m/z 846.6 [M+K]+ for PC (P/(+2) DHA). (B) Semi-quantitative analysis of PCs in mouse brain using IMS. The average gray intensity (arbitrary units, a.u.) of PC (P/(+2) AA) and PC (P/(+2) DHA) were determined from MS intensities.
Our studies provided the following information: (1) TAG molecular species can be analyzed by GC-FID and TAG positional isomers and enantiomers can be determined by HPLC-MS, (2) the catabolic rates of fatty acids bound to TAG can be estimated combining 1-13C-labeled fatty acids and IRMS, (3) the accumulation of dietary PUFA in the body can be visualized by combination of stable isotope labeling and IMS. These techniques can assess food quality and support to develop new functional foods. The synthesis of fatty acids and TAG will be further developed together with analytical methods to study their functions contributing to the progress in the food industry.
The research works presented in this review have been performed with help of collaborators and students in our research group. The author thanks Prof. Naohiro Gotoh (Tokyo University of Marine Science and Technology), Prof. Fumiaki Beppu (Hokkaido University), and Dr. Toshiharu Nagai (Tsukishima Foods Industry Co., Ltd.) for their guidance and support.