Original Article
Assessment of a highly-filled flowable composite for the repair of indirect composites
2024 年 66 巻 1 号 p. 42-49
詳細
2024 年 66 巻 1 号 p. 42-49
Purpose: To compare the shear-bond-strength (SBS) of a highly-filled-flowable composite (HFFC) and a paste-type composite for indirect composite repair and to evaluate the effect of different surface treatments (ST), concerning the composite repair protocol.
Methods: Eighty-four 5 × 5 × 2 mm cylindrical specimens were prepared using Gradia Plus and SR Nexco indirect composite materials. The samples were thermocycled 5,000 times. According to the ST, the samples were divided into three groups (control, bur, and air-abrasion). After ST, the sample subgroups were divided into two sub-groups according to the repair material: paste-type composite and HFFC (n = 7). Another 5,000 cycles of aging were performed. SBS values were measured with a universal testing machine (Shimadzu, Japan). Shapiro-Wilk, 3-way ANOVA, and Tukey HSD test were used to evaluate data (P < 0.05).
Results: ST was considered significant for SBS (P < 0.001). The mean values were (13.9 ± 5.7), (17.0 ± 6.4), (20.4 ± 4.9) MPa for the control, bur and phosphoric acid, and air-abrasion groups, respectively. The surface treatment and repair material interaction was considered significant for SBS (P = 0.044). The highest mean bond strength (24.5 ± 4.5 MPa) was observed for the interaction of SR Nexco, air-abrasion ST, and HFFC repair.
Conclusion: Repairing with HFFC following air abrasion might enhance the SBS for indirect composite restorations.
Composite resin restorations are frequently included in clinical routines with enhanced optical and mechanical properties. Most recently, highly filled flowable composites (HFFCs), including 65-75% fillers by weight, have been introduced for direct restorations and indirect cementation. Besides maintaining low viscosity, these materials have relatively comparable mechanical and optical properties with paste-type composites, including when used on the top restoration layer. In-vitro studies presented lower polymerization shrinkage, better marginal adaptation, higher flexural properties, and higher wear resistance for these contemporary restorative materials than conventional paste-type composites [1,2,3].
In the production of indirect restorations, in addition to conventional light curing and heat-curing for polymerization, laboratory processes may also employ heat, pressure, and a nitrogen atmosphere [4]. These techniques enhance the physical properties of the materials, improve wear resistance, and result in a more advanced level of restoration quality. However, the degree of conversion is influenced by the composition of the materials and especially by properties such as initiators of polymerization, monomer structure and copolymerization, cross-linking and cyclisation, inhibitor and catalyst, and cure temperature versus glass transition temperature [Miletic, V et al., Dental Composite Materials for Direct Restorations, Springer Int., 64-67, 2018]. Therefore, the manufacturer’s instructions must be followed during their production. The degree of conversion affects mechanical properties, biocompatibility, water sorption, solubility, degradation and color stability in the long term [5].
According to the literature, indirect restorations have better long-term clinical success than direct restorations [6]. In addition, they provide natural proximal contacts and occlusal morphologies even in large cavities, and a good marginal adaptation can be achieved by using the low polymerization shrinkage of the luting cement in indirect restorations [7]. However, problems such as microleakage, surface abrasion, fracture, discoloration, and marginal chipping may still be detected in clinical mid-term and long-term follow-ups [8]. In this case, there may be a need to rehabilitate an indirect restoration with direct composite resins in a minimally invasive approach. After assessing the clinical conditions, the operator must decide whether to replace or repair the restoration.
Studies have shown a significant increase in cavity volume when restoration replacement is selected [9]. Removing substantial tissue may reduce the fracture strength of the remaining tooth structure [10]. Total restoration replacement may also result in disadvantages such as loss of intact dental structures and pulpal injury [11]. Researchers have recently revisited one of the primary benefits of resin-based composite restorations, which is re-evaluating the repair procedure as non-indicative of failure[6]. As an alternative and more minimally invasive approach to replacing the entire restoration, selectively repairing the failed restoration area may increase the survival of the restoration by preserving dental tissues. Moreover, this approach may reduce clinician and patient time, as well as treatment costs.
Regarding the composite repair protocol, various surface treatment (ST) methods have been recommended to improve the shear bond strength (SBS), such as surface roughening with diamond burs, phosphoric acid etching, air-abrasion with aluminum-oxide (Al2O3) particles, and Al2O3 particles coated with silica [12,13]. Studies have shown that utilizing Al2O3 particle air abrasion on the surface significantly increases repair strength [14,15]. Al2O3 particles generate micro-mechanical interlocking between the substrate and the resin material by creating irregularities on the repair surface [16,17,18,19,20]. Following the air abrasion, most related studies recommend silane application due to the enhanced surface wettability and chemical adhesion between the resin and the substrate [13,21]. However, there are not enough long-term clinical data for indirect composite repair. One significant deficiency is that the efficacy of flowable composite resins with increased filler ratio (by weight), which is claimed to be used on the top surface of restoration by the manufacturers, has not been investigated for use in repair procedures for indirect composites. However, the use of HFFCs on the top surface can provide simplicity for the repair procedure due to the ease of application. On the other hand, there is a lack of information in the literature regarding the novel HFFCs and no long-term studies on their use at the top surface have been carried out. Additionally, the focus of composite repair studies on computer-aided design-computer-aided manufacturing (CAD-CAM) composites has resulted in a gap in the literature on the repair of conventional indirect composites.
This study aimed to examine the effect of different STs on the repair of indirect composite restorations, and also to compare the effect of the restorative repair material (RM) (HFFC or paste-type composite) on the shear bond strength (SBS).
The tested null hypotheses were: (1) there is no difference for SBS between the ST groups, (2) there is no difference for SBS between the restorative RMs regarding the indirect composite repair.
This in vitro study, based on the sample research [22], relied on a 95% confidence, 95% test power, d = 2.386 effect size, and a minimum sample size six for each group. A total of 84 samples were prepared, half with Gradia Plus HB-DA2 (GC Corp., Tokyo, Japan) and the other half with SR Nexco D2 (Ivoclar Vivadent, Scaan, Lichtenstein). A 5 × 5 × 2 mm commercially available green silicone mold was used to fabricate 84 indirect composite resin blocks. The top surface of each specimen was pressed perpendicular to the long axis of the silicone mold with a Mylar strip and glass slide to obtain a flat surface and remove excess material. The glass slide was removed, and the specimens were cured for 20 s with a LED light (Elipar Deep Cure-S, 3M ESPE, St. Paul, MN, USA) with an irradiance of 1,470 mw/cm². After demolding, the specimens were polymerized from the bottom surfaces for 20 s.
Gradia HB and SR Nexco materials have different recommended curing times and instruments. Therefore, the polymerization procedure of both materials was carried out following the manufacturer’s instructions for each material.
The Gradia HB specimens were heat-cured for 3 min [23] with a pressure oven (Labolight Duo, GC Europe, Leuven, Belgium) in full mode, following the pre-light-curing for 10 s to all sample surfaces, in gradual mode. Indirect composite specimens of SR Nexco were heat cured with a pressure oven (Lumamat 100, Ivoclar Vivadent) for 11 min [24], according to the manufacturer’s instructions.
The polymerized specimens were immersed in distilled water and aged with a thermal cycle for 5,000 cycles, at 5ºC to 55ºC, with 20 s of dwelling time and 10 s transfer time, using a thermocycling instrument (SD Mechatronik, Feldkirchen-Westerham, Germany). Then, the test surface of the composite samples was polished with 600-grit silicon carbide paper under water cooling for 30 s.
All samples were embedded in cold acrylic with 2 mm of it remaining on the surface (Fig. 1). Each base material (BM) was divided into three groups according to the ST and then divided into two sub-groups for RM (n = 7).
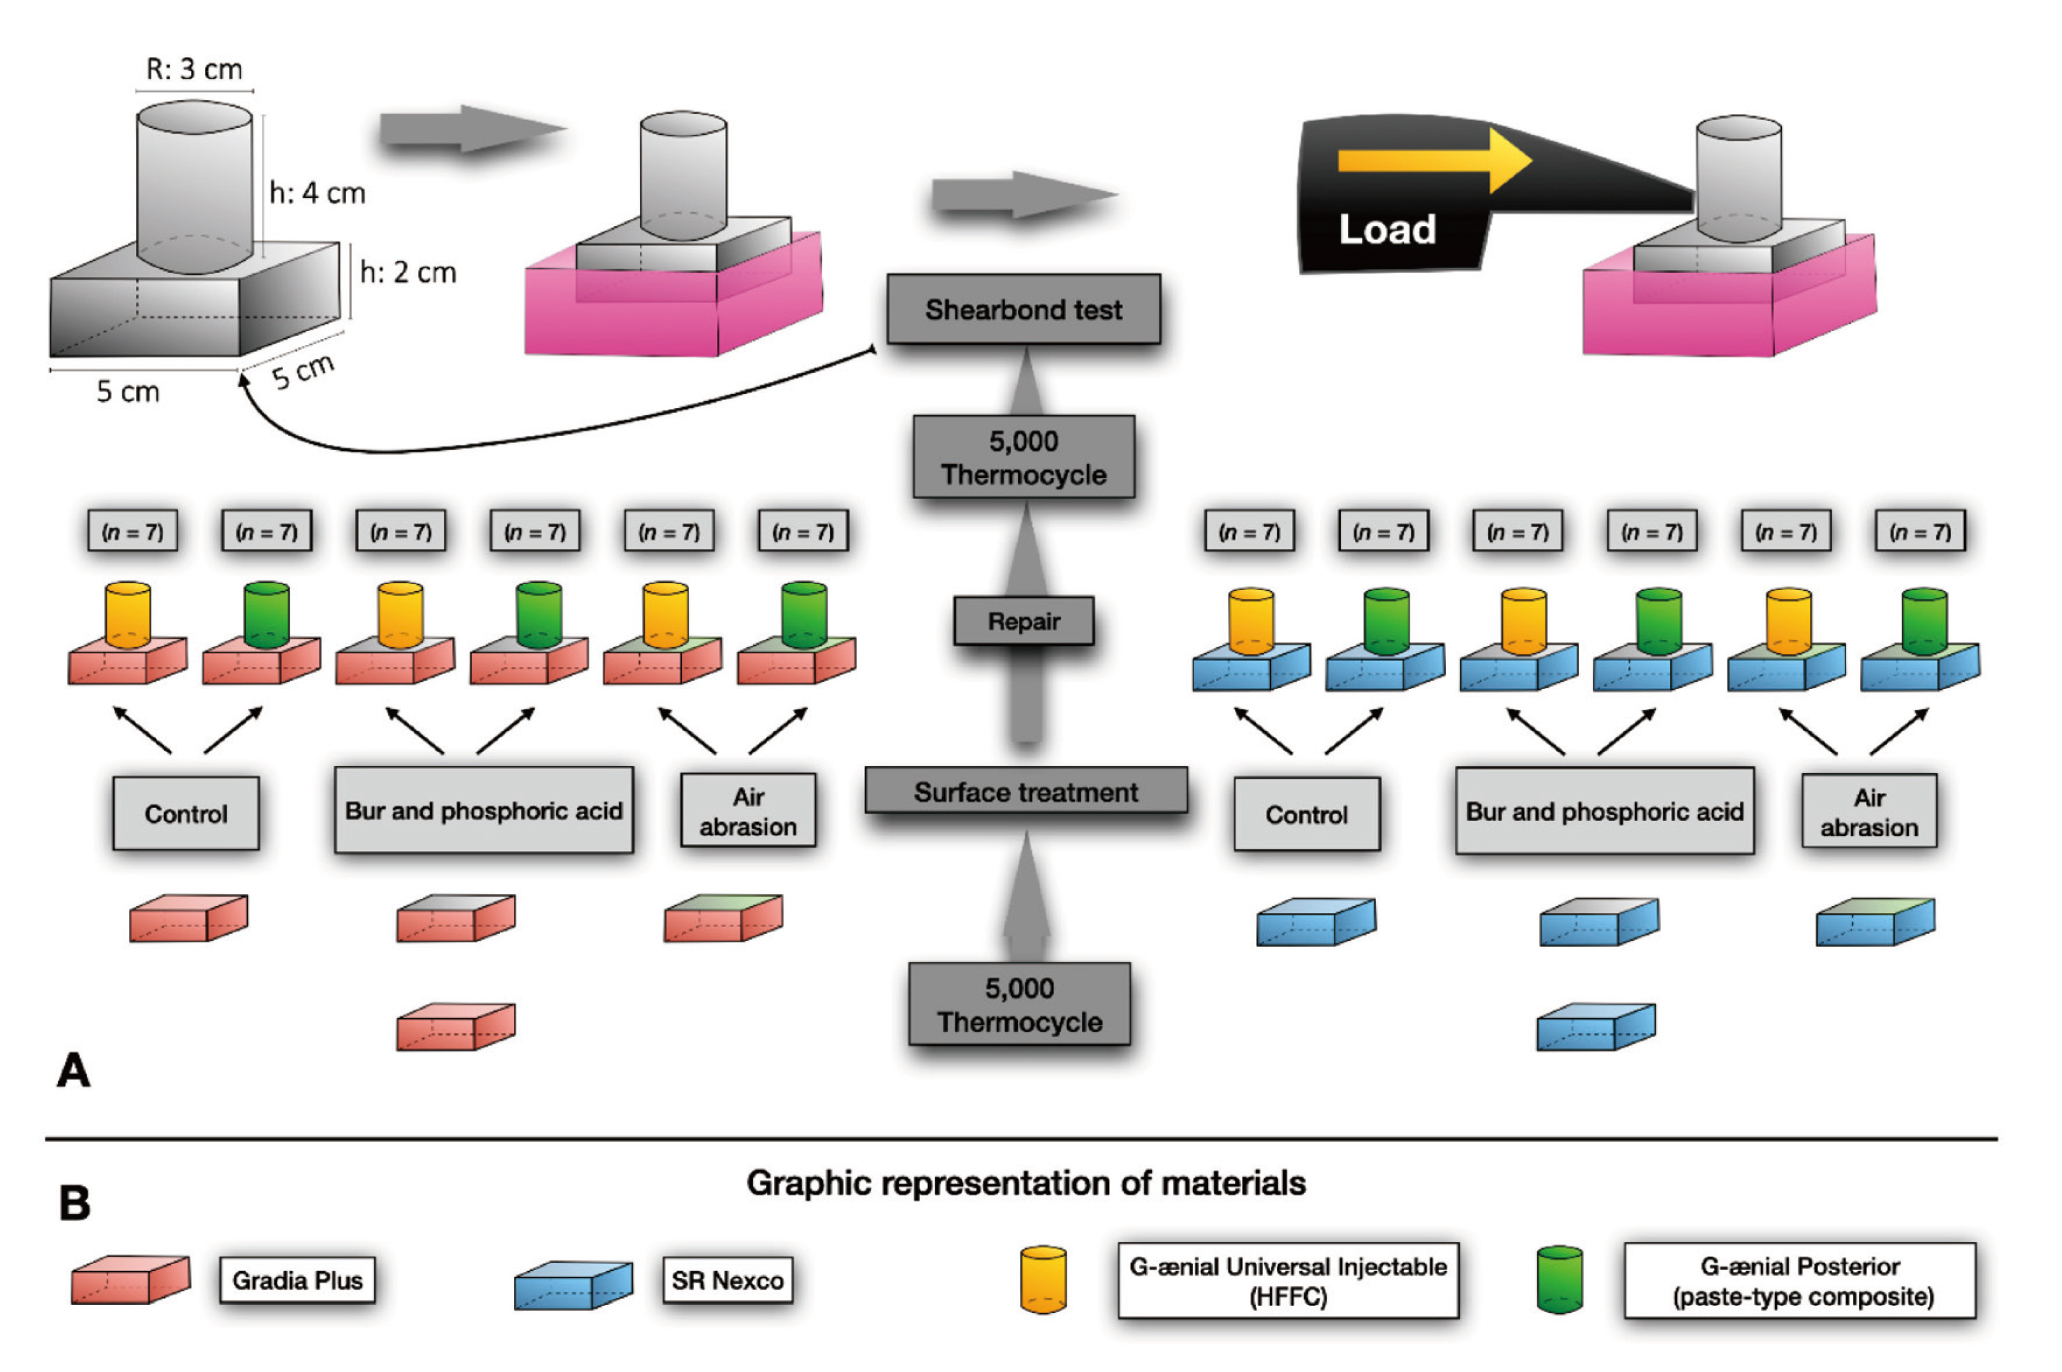
All specimens were randomly divided into three groups (control group, bur group, air abrasion group) following the ST type. In the first (control) group, no ST was performed. In the second (bur) group, specimen surfaces were milled with chamfer-edged coarse grit diamond bur (Sorensen, Cotia, Brasil) coupled to a low-speed dental turbine under water cooling, by moving forward five times with its long axis in contact with the sample surface, then etched with 37% phosphoric acid for 20 s. The bur was changed in every five specimens to ensure milling standardization. In the third (air abrasion) group, ST was performed using an air abrasion unit (Aquacare Twin, Velopex, UK). Samples were air abraded with 29 µm Al2O3 particles (Aquacare, Velopex) for 15 s, by positioning the device’s tip 10 mm to the surface [25].
Surface roughness measurementFollowing the ST, each specimen’s surface roughness (Ra) was measured four times with a contact profilometer (MarSurf PS 10, Mahr, Czech Republic). The probe was placed in the middle of the specimen surface, and measurements were made in different directions with a traversing length of 1.75 mm and a constant measuring speed of 1 mm/s. The arithmetic absolute average surface roughness (Ra) values of 4 measurements for each sample were calculated.
Repair procedureFollowing the ST, the specimen surfaces were coated with G-Multi Primer and G-Premio Bond (GC Corp.) according to the manufacturer’s instructions. All materials, compositions and application protocols are given in Table 1. Then the specimens were randomly divided into two subgroups according to the selected resin-based RM. While the half of the specimens were repaired with an HFFC, (G- ænial Universal Injectable, A2 shade, GC Corp.), and another half of the specimens were repaired with a paste-type composite (G-ænial Posterior, GC Corp.). A 3 mm diameter and 4 mm height rubber gasket was used for the repair procedure. Composite resin materials were placed in 2 mm layers and light‐cured for 20 s using the curing unit (Elipar Deep Cure-S, 3M ESPE). Secondary thermal aging was applied to the repaired samples with the same parameters. The SBS of the aged specimens was measured as MPa (N/mm²) with a universal testing machine (Shimadzu, Kyoto, Japan) at a 1 mm/min frequency.
| Material | Composition | Application protocol |
|---|---|---|
| SR Nexco (Ivoclar Vivadent, Scaan, Lichtenstein) (LOT: Y33759) |
Dimethacrylates (17-19 wt%); copolymer and silicon dioxide (82-83 wt %). Additional contents are stabilizers, catalysts and pigments (<1 wt%). The total content of inorganic fillers is 64-65 wt% / 46-47 vol%. Particle size: 10-100 nm | 42 specimens were light‐cured for 20 s using an LED curing unit (Elipar Deep Cure-S, 3M ESPE, St. Paul, MN, USA). Indirect composite specimens were heat-cured with a pressure oven for 11 min (Lumamat 100, Ivoclar Vivadent). |
| Gradia Plus (GC Corp., Tokyo, Japan) (LOT: 1905271) |
Barium glass (300 nm particle size), pre-polimerized fillers (10 μm particle size) (50-70%), UDMA (25-50%) | 42 specimens were light‐cured for 20 s using an LED curing unit (Elipar Deep Cure-S, 3M ESPE). Then, polymerized for 3 min with a pressure oven (Labolight Duo, GC Europe, Leuven, Belgium) in full mode, following the pre-curing for 10 s in gradual mode. |
| G-aenial Universal Posterior (GC Corp.) (LOT: 2010141) |
Methacrylate monomers, pre-polimerized fillers, fluoroaluminosilicate, fumed silica, pigments, catalysts | Resin composite was applied as 2‐mm thickness for the repair and light‐cured for 20 s. |
| G-aenial Universal Injectable (GC Corp.) (LOT: 1907232- 2010061) |
Methacrylate monomer, silica, barium glass, pigments, photo initiator | Resin composite was applied as 2‐mm‐thickness for the repair and light‐cured for 20 s. |
| G-Premio Bond (GC Corp.) (LOT: 1904041) |
4-MET, MDP, MDTP | Applied on the samples surfaces with rubbing for 20 s. Air-dried for 5 s with high air pressure and light-cured for 10 s. |
| G-Multiprimer (GC Corp.) (LOT: 2010091) |
Silane, MDP, MDTP | Applied for 20 s and dried with mild air pressure. |
UDMA, uretan di methacrylate; MDP, methacryloyloxydecyl dihydrogen phosphate; MDTP, merthacryloyloxydecyl dihydrogen thiophosphate; 4-MET, 4-methacryloxyethyl trimethyl anhydrate
Failure type analysis
The failure surfaces of the samples were examined under a stereomicroscope at 2× magnification (Leica MZ 75, Mannheim, Germany). Three types of failure were defined: adhesive failure, in which RM wholly separated from the BM surface; cohesive failure, in which BM or RM completely fractured; and, mixed failure, in which both adhesive and cohesive failure were jointly observed.
Scanning Electron Microscopy (SEM) AnalysisAdditional samples were prepared, aged and processed to observe the surface topography by SEM. Specimens were coated with gold in a vacuum cold sputter (SC7620, Laughton, Sussex, UK). The failure types were examined under 100× and 500× magnifications, and the surface topography was examined under 500× , 1000× and 3000× magnifications.
Statistically analysisStatistical analysis was performed using the IBM SPSS Statistics V23 for Windows (IBM, Armonk, NY, USA) software. Conformity to normal distribution was evaluated with the Shapiro-Wilk test. The homogeneity of variances was examined with Leven’s test. Two-way ANOVA was used to compare surface roughness according to BM and ST, and multiple comparisons were reviewed with the Tukey HSD test. Three-way ANOVA was used to compare the shear bond strength (MPa) according to the BM, ST and RM (RM).
Multiple comparisons were analyzed with the Tukey HSD test. Analysis results were presented as mean ± standard deviation for quantitative data. The P values were considered less than 0.05 in all tests.
Shapiro-Wilk results for the normality of data and kurtosis for the three-way ANOVA test are given in Table 2. Homogeneity of variances, another assumption for ANOVA, was examined with Leven’s test, and the resulting P-value was 0.915, meaning that it was insignificant. According to this result, it is assumed that the variances are homogeneous (Table 3).
ST and ST- RM interactions were compared with a three-way ANOVA test. The test results revealed that the ST (F = 10.301, P < 0.001) and ST-RM interaction (F = 3.266, P = 0.044) exhibited a significant influence on repair SBS values (Table 4). The base material (BM) was not considered an effective factor for SBS (P = 0.557). Regardless of the RM and ST, SBS values for SR Nexco and Gradia Plus BMs were 17.4 ± 7.1 and 16.7 ± 5.3, respectively. The mean plot of the main effects of BM, RM and ST are given in Fig. 2.
In addition, the interaction among the three factors was significant (Table 4, P = 0.013). The mean graph of interactions is given in Fig. 3.
According to the Tukey HSD test, air abrasion significantly increased SBS values compared to the control group, regardless of the BMs (Table 5).
SBS values repaired with HFFC were significantly higher in the air abrasion group than in the control and bur groups. This difference was not observed between the control group and the bur ST, in the group repaired with paste-type composite.
Regarding the interaction between the ST and the RM, the highest SBS was observed for the air-abrasion group repaired with HFFC (21.4 ± 5.3). The minimum mean value was observed in the control group repaired with paste-type composite (12.8 ± 5.5). According to the interaction between the ST, RM, and BM, the highest SBS was observed for air-abraded SR Nexco BM, repaired with HFFC (24.5 ± 4.5). In contrast, the lowest was for the control group with SR Nexco base restored with paste-type composite 11.0 ± 4.3 (Table 5).
In this study, the values of failure modes in the samples are given in Table 8 as percentages (%). All groups had adhesive and cohesive failures, and the most adhesive failures were observed in control groups.
| BM | ST | RM | Shapiro-Wilk | kurtosis | skewness | ||
|---|---|---|---|---|---|---|---|
| Test stat. | P | ||||||
| Gradia Plus | control | HFFC | shear bond strength | 0.972 | 0.909 | 0.228 | 0.631 |
| paste-type | shear bond strength | 0.915 | 0.433 | 1.453 | −0.674 | ||
| bur and phosphoric acid | HFFC | shear bond strength | 0.887 | 0.259 | 1.440 | 1.108 | |
| paste-type | shear bond strength | 0.964 | 0.851 | −0.840 | 0.380 | ||
| air abrasion | HFFC | shear bond strength | 0.977 | 0.941 | −0.034 | −0.129 | |
| paste-type | shear bond strength | 0.935 | 0.593 | 2.098 | −0.333 | ||
| SR Nexco | control | HFFC | shear bond strength | 0.982 | 0.971 | −0.801 | 0.062 |
| paste-type | shear bond strength | 0.788 | 0.031 | −0.915 | 1.030 | ||
| bur and phosphoric acid | HFFC | shear bond strength | 0.813 | 0.055 | 3.988 | 1.534 | |
| paste-type | shear bond strength | 0.887 | 0.260 | 0.700 | 1.159 | ||
| air abrasion | HFFC | shear bond strength | 0.905 | 0.363 | −1.741 | −0.063 | |
| paste-type | shear bond strength | 0.973 | 0.920 | 0.482 | 0.460 | ||
BM, base material; ST, surface treatment; RM, repair material; HFFC, highly-filled flowable composite
| Levene statistic | df1 | df2 | Sig. | ||
|---|---|---|---|---|---|
| Shear bond strength | based on mean | 0.471 | 11 | 72 | 0.915 |
| based on median | 0.440 | 11 | 72 | 0.933 | |
| based on the median and with adjusted df | 0.440 | 11 | 61.889 | 0.932 | |
| based on trimmed mean | 0.473 | 11 | 72 | 0.914 | |
Tests the null hypothesis that the error variance of the dependent variable is equal across groups. a. dependent variable: bond strength
b. design: intercept + d1 + d2 + d3 + d1 * d2 + d1 * d3 + d2 * d3 + d1 * d2 * d3
| Sum of square | Mean square | DF | F | P | Partial eta squared | |
|---|---|---|---|---|---|---|
| BM | 9.993 | 1 | 9.993 | 0.348 | 0.557 | 0.005 |
| ST | 592.024 | 2 | 296.012 | 10.301 | <0.001 | 0.222 |
| RM | 0.090 | 1 | 0.090 | 0.003 | 0.956 | 0.000 |
| BM*ST | 89.339 | 2 | 44.670 | 1.554 | 0.218 | 0.041 |
| BM*RM | 0.019 | 1 | 0.019 | 0.001 | 0.979 | 0.000 |
| ST*RM | 187.712 | 2 | 93.856 | 3.266 | 0.044 | 0.083 |
| BM*ST*RM | 266.527 | 2 | 133.263 | 4.637 | 0.013 | 0.114 |
BM, base material; ST, surface treatment; RM, repair material; DF, degree of freedom; F, analysis of variance test statistics; R2 = 0.356; adjusted R2 = 0.258
| ST | RM | BM | Total | |
|---|---|---|---|---|
| Gradia Plus | SR Nexco | |||
| Control (no treatment) | HFFC | 14.5 ± 4.8AB | 15.3 ± 7.0ABC | 14.9 ± 5.8AB |
| paste-type | 14.7 ± 6.4AB | 11.0 ± 4.3A | 12.8 ± 5.5A | |
| Total | 14.6 ± 5.4 | 13.1 ± 6.0 | 13.9 ± 5.7a | |
| Bur and phosphoric acid | HFFC | 17.3 ± 5.0ABC | 12.3 ± 49AB | 14.8 ± 5.4AB |
| paste-type | 16.6 ± 5.9ABC | 21.6 ± 6.9BC | 19.1 ± 6.7BC | |
| Total | 17.0 ± 5.3 | 17.0 ± 7.5 | 17.0 ± 6.4ab | |
| Air abrasion | HFFC | 18.3 ± 4.3ABC | 24.5 ± 4.5C | 21.4 ± 5.3C |
| paste-type | 19.0 ± 5.5ABC | 19.7 ± 3.5ABC | 19.3 ± 4.5BC | |
| Total | 18.6 ± 4.8 | 22.1 ± 4.6 | 20.4 ± 4.9b | |
| Total | HFFC | 16.7 ± 4.8 | 17.4 ± 7.5 | 17.0 ± 6.2 |
| paste-type | 16.7 ± 5.9 | 17.5 ± 6.8 | 17.1 ± 6.3 | |
| Total | 16.7 ± 5.3 | 17.4 ± 7.1 | 17.1 ± 6.2 | |
BM, base material; ST, surface treatment; RM, repair material; HFFC, highly-filled flowable composite. a-b, no difference between surface treatments with the same letter. A-C, no difference between interactions with the same letter


SEM analysis revealed that surface treatments bring various surface properties.
SEM images of the failure types are given in Fig. 4, which are cohesive failure in BM (Fig. 4a , b), cohesive failure in RM (Fig. 4c, d), adhesive failure (Fig. 4e, f), and mixed failure (Fig. 4g, h), respectively.
The control group (no treatment) presented a smoother surface than bur and air-abraded surfaces (Fig.5a, b). Bur ST revealed widespread cracks along the surface with shallower roughness (Fig. 5c, d). Air abrasion with 29 µm Al2O3 particles (Fig. 5e, f) produced substantial surface irregularities, which could be supported by the highest shear bond strength.

(a, b) cohesive failure in the base material. (c, d) cohesive failure in the repair material. (e, f) adhesive failure. (g, h) mixed failure

(a, b) control. (c, d) bur and phosphoric acid. (e, f) air abrasion
Ra mean values did not differ according to the BM, regardless of ST (P = 0,255). The mean Ra is considered significant according to the ST regardless of the BM (P < 0.001) (Table 6). Each surface treatment differed from the other, and the mean Ra values were 0.19, 2.45, and 2.72 for control, bur and phosphoric acid, and air abrasion ST groups, respectively (Table 7). Ra mean values did not differ according to BM and ST interaction (P = 0.847). The mean Ra plot for the main effects is given in Fig. 6.
| Df | Sum of squares | Mean squares | F | P | Partial eta squared | |
|---|---|---|---|---|---|---|
| BM | 1 | 0.048 | 0.048 | 1.310 | 0.255 | 0.017 |
| ST | 2 | 107.827 | 53.914 | 1487.740 | <0.001 | 0.974 |
| BM *ST | 2 | 0.012 | 0.006 | 0.170 | 0.847 | 0.004 |
BM, base material; ST, surface treatment; Df, degree of freedom. F, analysis of variance test statistic. R2 = 97.45%. Adjusted R2 = 97.28%
| ST | BM | Total | |
|---|---|---|---|
| Gradia Plus | SR Nexco | ||
| Control | 0.18 ± 0.05 | 0.20 ± 0.05 | 0.19 ± 0.05a |
| Bur and phosphoric acid | 2.42 ± 0.29 | 2.47 ± 0.26 | 2.45 ± 0.27b |
| Air abrasion | 2.68 ± 0.17 | 2.75 ± 0.18 | 2.72 ± 0.17c |
| Total | 1.76 ± 1.15 | 1.81 ± 1.17 | 1.78 ± 1.15 |
BM, base material; ST, surface treatment; a-c, no difference between surface treatments with the same letter. Mean ± standard deviation

The degree of conversion varies depending on the content, composition and curing procedure of indirect composite materials. The conversion of double carbon bonds during curing is affected by the polymerization process. Different SBS values may occur in bonding after ST on different indirect materials [26]. Consequently, we selected two different BMs with different compositions and curing procedures in the present study.
Failure of indirect restorative materials usually occurs after a period of time in the oral conditions. Although no gold standard exists for the indirect ageing of materials, thermal aging is the most commonly used method to mimic the thermal changes that materials undergo in the oral environment. Since the repairability of composite materials is directly related to the time they are in an oral environment, in the present study, a total of 10,000 cycles of aging process was applied to indirect composite specimens, 5,000 cycles before repair and 5,000 cycles after repair.
Although there are many publications on direct composite repair, most current publications on indirect composite repair are about CAD-CAM materials. However, indirect conventional composite restorations are still produced from past to present and their repair is an important issue for clinical practice. On the contrary, the preference for HFFC over conventional direct paste-type composites was based on a comparative evaluation of the widely used paste-type composites in clinical practice. This comparison focused on the SBS of the new generation of flowable composite resin, which features an increased filler content by weight, ease of application, and compatibility with finishing [27]. Additionally, chosen HFFC is claimed to have improved mechanical properties that are not different from those of paste-type composite restorative materials [28,29]. The idea of repairing indirect composite materials with HFFC, whose repair procedure is less featured in the literature, shows the novelty of the present study.
The present study examined the effect of different STs on the composite resin-composite adhesion for paste-type and highly filled flowable composite resin repair with a shear bond strength test. To ensure standardization of the initial roughness, the test surfaces of all specimens were roughened with 600-grid silicone paper. According to the results of this study, STs and SBS values did not differ according to the BMs (Table 5). Consistently, Ra values did not differ based on BM (Table 6).
In some studies, a bond strength between 15 and 25 MPa is suggested for composite resin repairs, which is typical of the bond strength of composite resin to dentin and can be clinically accepted [30,31]. Accordingly, this study showed that values could be reached except in the control group (Table 5). The mean SBSs obtained in the bur and phosphoric acid and the air abrasion ST groups were acceptable values and were 17.0 ± 6.4 and 20.4 ± 4.9 MPa, respectively.
Considering the mechanical ST, among all specimens, roughening with diamond bur and phosphoric acid resulted in similar SBS to the air-abrasion group. However, when HFFC was used as a repair material, air abrasion ST showed significantly higher bond strength than bur ST. As the statistical analyses revealed significant differences among the tested composites concerning ST, the first null hypothesis was rejected. When the surface roughness values are analyzed, both ST groups are significantly higher than the control group (Table 7). These results are proportional to SBS. However, although bur and phosphoric acid and air abrasion STs showed similar SBS, surface roughness analysis showed that Ra was significantly higher in the air abrasion group. A significant increase in Ra did not directly affect the SBS of the paste-type composite. This result may be due to the difference in viscosity of the two materials. It is possible that the macroretentive areas created by the bur limit the performance of the HFFC, while the HFFC is more likely to spread to the rougher and microretentive surface provided by air abrasion, which has a different geometric character than the bur ST.
Micromechanical retention on aged surfaces has been reported as one of the key mechanisms to achieving reliable repair bond strength [32]. In the present study, bur and air abrasion STs were examined in SEM (Fig. 5). It was observed that there were finer and irregular indentations on the air-abraded surface compared to bur ST, which may have contributed to the higher SBS (Fig. 5). Similarly, Palasuk et al. reported that in ST procedures of composite repair, bur ST showed lower bond strength than Al2O3 ST [33]. Şişmanoğlu et al. investigated the repair bond strength of various surface treatments with self-adhering flowable composite. Conversely, in that study, no significant difference was found between air abrasion with Al2O3 particles, air abrasion with silica-coated Al2O3 particles, and acid etching groups with universal adhesive application [34]. This difference may be because in the aforementioned study the negative control group without adhesive constituted half of the tested specimens, resulting in low bond strength data and affecting the statistical analyses.
Wendler et al. compared the bond strength of bur ST and 30 μm Al2O3 ST and found similar values in both groups without an adhesive application [32]. Although their results regarding the bonding coincided with the present findings, the results regarding the surface roughness were different. They reported significantly higher Ra values for the bur group. This difference in surface roughness results might be due to the limited application time of air abrasion and the distance the air abrasion was applied. The most likely reason for the difference in bonding values of the present results and the results of Wendler et al. might be that, the silane primer factor was not considered as a variable and was therefore applied to all the specimens, whereas Wendler et al. did not use silane primer in the bur ST group but used it in the air abrasion ST group which caused an advanced chemical adhesion.
Costa et al. showed that coarse grit bur caused less roughness than air abrasion with aluminum oxide particles [35]. Correlated with surface roughness, they stated that the group roughened with aluminum oxide provided better adhesive integrity and exhibited a higher bond strength after six months of aging. They attributed this result to the fact that the bur ST might have created a smear layer. This may have differed from our results due to the removal of the smear layer by the acid application after the bur ST. Costa et al. also argued that Al2O3 particles create a more retentive surface area which may be the reason for the higher bond strength. Considering the interaction of HFFC and air abrasion, the increased SBS, as well as the increased surface roughness might be due to the better spreading of HFFC on the surface. Moreover, the adhesive agent used in this study has a very thin film layer with a thickness of (3 µm), which might provide a better surface contact for the resin-based composites applied above. Accordingly, better adhesive integrity might have been obtained by combining low viscosity flowable composite material (HFFC) with this adhesive agent and air abrasion application.
Mechanical and chemical factors influence adhesion to composite resin-resin interface [36]. Air abrasion ST may have contributed to adhesion by exposing the large diameter particles in the indirect composite materials, allowing the adhesive material to diffuse into the irregularities created and across the treated surfaces. On the other hand, as a result of the present study, similar SBS was observed in paste-type and high-filled flowable composite resins (Table 5). However, the similar SBS of HFFC as paste-type composite indicates that composite repair can be finished with these new materials thanks to easy application, low viscosity, and high filler ratio. The lower the composite viscosity is, the higher its wettability is, and the larger the free surface formation, thus representing a minor restriction to shrinkage and reducing shrinkage stress [37]. When interpreting the results of the present study, the successes and potential failures at two surfaces, the “BM-adhesive interface and the RM-adhesive interface”, should be taken into account. Better penetration of the adhesive material into the micro-formations formed on the surface by air abrasion may have contributed to the bonding at the BM-adhesive interface, which could lead to better bonding with the RM. Although flowable composite resins create more polymerization stress than conventional paste-type composites [38], the positive results obtained with air abrasion ST might indicate the importance of surface preparation for the composite repair procedure.
Although HFFC shows comparable results to paste-type composites in terms of adhesion (Fig. 2), the second hypothesis may be partially rejected due to the higher SBS obtained from the air-abrasion and HFFC group (Table 4). Still, the HFFC in the bur and phosphoric acid ST group exhibited comparable SBS to the paste-type composite (Fig. 2). Similarly, another study included HFFC, and paste-type composites reported the same clinical performance on NCCL after two years of follow-up [39]. Other clinical research assessed the success of Class II restorations restored with HFFC and paste-type composite regarding the FDI criteria. At the end of 36 months of clinical follow-up, it was reported that HFFC and paste-type composites exhibited similar performance [27]. Zhang et al. compared the clinical performance of HFFC and paste-type composites on non-caries cervical lesions (NCCL). According to FDI criteria, both materials presented comparable results after three years of clinical evaluation, but HFFC showed better marginal adaptation on NCCL [40]. Based on these clinical studies and the present findings consistent with these results, it might be assumed that there is no limitation for using HFFCs as a finishing material in the composite repair protocol, without requiring a top material, according to the manufacturer’s instructions.
The cohesive failure was mainly observed in the groups with higher SBS (Table 8); conversely, the adhesive rupture was commonly seen at low SBS (control group). The cohesive fractures of most of the air abrasion ST and bur ST groups may highlight the higher bond strength. Furthermore, the prevalence of cohesive failures in the BM suggests that the bond strength might surpass the flexural strength of the BM. Microtensile and shear bond tests are usually preferred in studies aiming to assess the bond strength. Microtensile tests are mostly preferred to examine specific and small areas such as affected dentin. Due to the homogeneous force distribution during the test, more adhesive breaks occur, and the adhesive interface can be evaluated more accurately. Despite its favorable aspects, a time-consuming, significant standard deviation is still problematic in interpreting microtensile testing data. Moreover, because the forces in the oral environment are multidirectional, these tests may not fully reflect clinical success. Shear bond tests offer a relatively easy specimen preparation and allow a faster assessment of the bond strength. However, although the angle of approach of the blade is standardized, unlike the microtensile testing, it is not possible to be sure that all the force is concentrated at the interface. A recent methodological assessment of the resin-resin interface revealed that the test method influences the failure types and bond strength [31].Therefore, the point where the force is applied may have determined the surface where cohesive failure will occur. Hence, using only the shear bond test can be considered one of the limitations of this study, while the use of a single universal adhesive in this study is another limitation. Different RMs and surface treatments may exhibit varying bond strengths whereas different adhesive agents are applied. Consequently, further studies should be performed with adhesives with different ingredients.
Within the limitations of this study, the following conclusions could be drawn:
| Failure modes | Adhesive | Cohesive within BM | Cohesive within RM | Mixed |
|---|---|---|---|---|
| Groups of control | (68%) 19 | (21%) 6 | (0%) 0 | (11%) 3 |
| Bur and phosphoric acid | (32%) 9 | (43%) 12 | (7%) 2 | (18%) 5 |
| Air abrasion (Aquacare) | (25%) 7 | (43%) 12 | (11%) 3 | (21%) 6 |
| Total | (42%) 35 | (36%) 30 | (6%) 5 | (16%) 14 |
The authors declare that they have no conflicts of interest related to the present study.
This study was not supported by any commercial institution. The entire study budget was provided by the researchers. There is no role of the funding body in the design of the study, the collection, analysis, and interpretation of data or in the writing of the manuscript.
The authors would like to thank the Optimal Dental laboratory for preparing the indirect composite samples.