Original Articles
Effects of organic carbon quality on the sorption behavior of pesticides in Japanese soils
2014 Volume 39 Issue 2 Pages 105-114

Details
2014 Volume 39 Issue 2 Pages 105-114
Soil sorption is one of the important processes in the fate and behavior of pesticides in the environment. The soil–water distribution coefficient, Kd, and the organic carbon (OC)-normalized sorption coefficient, Koc, are widely used to predict pesticide contamination of groundwater1,2) and run-off properties from paddy fields into rivers.3,4) Furthermore, sorption behavior affects the phyto- and bio-availability of pesticides in soils.5–7) The pesticide regulatory system in Japan requires sorption studies prior to the registration of newly developed pesticides. However, most data in registration dossiers are not disclosed in detail.
Japan is a typical volcanic country. Although volcanic ash soils are widely distributed throughout Japan and cover approximately half of all upland fields,8) there is little available information on the sorption behavior of pesticides in Japanese volcanic ash soils.
Nonionic pesticides generally sorb to soil particles via hydrophobic interactions. Hence, soil sorption is strongly influenced by OC content in soil. However, the Koc values of a pesticide are highly variable, depending on the soil type.9–13) Soil OC is considered to comprise polysaccharides, lignin, tannins, amino acids, and lipids as well as modified substances arising from the abiotic and biotic degradation of plant, microbial, and animal remains in soils.14–16) Recent studies11–13) suggest that the variable physicochemical nature of soil OC is one reason for the variability of Koc values. These studies investigated the relationship between Koc values and the chemical composition of OC by solid-state 13C cross-polarization magic angle spinning nuclear magnetic resonance (CPMAS NMR) spectroscopy, which provides the basic structural information of OC.17) The results of these studies demonstrate that Koc variability can be explained by the difference in the OC quality of soils, i.e., the proportions of aryl carbon, alkyl carbon, O-alkyl carbon, and carboxyl carbon in soil OC. Japanese arable land has a wide range of organic carbon (up to 15%) because volcanic ash soil (i.e., Andosol) contains a large amount of organic carbon.18) Therefore, the variety of OC quality and variability of Koc values may be higher in Japanese soils than in non-Japanese soils.
In addition, recent studies report OC in soils includes black carbon (BC) such as char and soot, which are products of the incomplete combustion of vegetation by wildfires or human activity.19–22) BC strongly sorbs organic chemicals, including pesticides. Yang et al.23) investigated the sorption of diuron on soils amended with ash from the burning of crop residues; they found that diuron sorption increases with increasing soil wheat ash content and is dominated by ash in soil with at least 0.05% ash content. Likewise, Loganathan et al.24) show that the presence of 1% wheat char applied to soils controls the overall sorption of atrazine on soils. Although no quantification methods for BC in soils have been established,25) Shindo et al.21) isolated the charred plant fragments from Japanese Andosols by a specific gravity method and reported the percentage of OC content of charred plant fragments in whole soil ranges from 3.4–33%. However, there are no reports about the effect of BC-like materials present in Japanese Andosol on the sorption properties of pesticides.
The objectives of this study are as follows: (i) to measure the Kd values of 17 pesticides in 8 typical Japanese soils; (ii) to assess the relationships between Kd values and soil properties, particularly the contribution of OC to sorption properties and the extent of Koc variability in Japanese soils; and (iii) to investigate the effects of the molecular nature of OC on Koc variability.
Seventeen pesticides with varying hydrophobicity were used in sorption tests (Table 1). The chemical structures and dissociation constants (pKa) of the test pesticides are shown in Supplemental Table S1. The predicted octanol–water partition coefficients (log Kow), pKa, and octanol–water distribution coefficients (log D) between pH 4.5 and 7.5 were calculated using ACD/ChemSketch 10.0 (ACD/Labs, Toronto, Canada) with ACD/logP DB 10.0, ACD/pKa 10.0, and ACD/logD 10.0, respectively. The log D values of all pesticides except imidacloprid and clothianidin calculated within the pH range showed the same predicted log Kow value. Thus, it appears that almost all pesticides exist in a neutral form within the above-mentioned pH range. All analytical standards (purity >97%) were purchased from Wako Pure Chemical Industries, Ltd. (Osaka, Japan), Kanto Chemicals (Tokyo, Japan), and Dr. Ehrenstorfer GmbH (Augsburg, Germany). The pesticides were divided into 3 analytical groups on the basis of the analytical methods described in section 4 below. Stock solutions (100 µg/mL) of the pesticides were prepared in acetone for each group.
| Compound | log Kowa) | log Kowb) | log Kowc) | log Kowd) | Analytical group |
|---|---|---|---|---|---|
| Imidacloprid | 0.57 | 0.57 | 0.57 | −0.43, 0.20 | A |
| Dimethoate | 0.70 | 0.70 | 0.98 | 0.48 | A |
| Clothianidin | 0.91 | 0.70 | 0.70 | −0.15, 0.40, 0.40 | A |
| Thiacloprid | 1.26 | 0.74 | 1.26 | 0.55 | A |
| Metalaxyl | 1.65 | 1.75 | 1.75 | 2.15 | A |
| Fosthiazate | 1.68 | 1.68 | 1.68 | 0.94 | A |
| Methidathion | 2.57 | 2.20 | 2.20 | 2.03 | A |
| Fenobucarb | 2.78 | 2.67 | 2.67 | 3.04 | B |
| Flutolanil | 3.17 | 3.17 | 3.77 | 3.70 | B |
| Procymidone | 3.30 | 3.14 | 3.30 | 2.67 | B |
| Fenitrothion | 3.32 | 3.43 | 3.43 | 3.24 | C |
| Tetraconazole | 3.56 | 3.56 | 3.53 | 3.19 | C |
| Chloroneb | 3.58 | —e) | 1.90 | 3.58 | B |
| Diazinon | 3.69 | 3.30 | 3.42 | 3.81 | C |
| Cadusafos | 3.85 | 3.90 | 4.08 | 4.28 | B |
| Tolclofos-methyl | 4.56 | 4.56 | 4.56 | 4.03 | C |
| Tetradifon | 4.61 | 4.61 | 3.95 | 5.52 | C |
a) log Kow values were obtained from the Footprint Pesticide Properties Database of IUPAC.26) b) log Kow values were obtained from The Pesticide Manual (16th ed.).27) c) log Kow values were obtained from The 2011 Pesticide Handbook.28) d) Predicted log Kow values using ACD/ChemSketch 10.0 with ACD/logP DB 10.0. The chemical structures of imidacloprid and clothianidin have 2 and 3 possible tautomeric forms, respectively. e) No data.
Eight Japanese soils with various physicochemical properties were used (Table 2). Soil samples were air-dried and passed through a 2.0-mm sieve. The pH and electrical conductivity (EC) of soils were measured in a soil/water (1 : 5 w/v) mixture by a multifunction water quality meter (MM-60R; DKK-TOA, Tokyo, Japan). The OC content was determined by the dry combustion method with a CN coder (MT-700; Yanaco, Kyoto, Japan). The cation exchange capacity (CEC) was determined by a shaking extraction method.29) The particle size distribution was analyzed by the pipette method with a pipette apparatus (DIK-2020; Daiki Rika, Saitama, Japan).30) Meanwhile, soil texture was determined according to the standards developed by the International Society of Soil Science31); soils were classified according to the criteria adopted by the Cultivated Soil Classification Committee.32)
| Soil | Classification | Texture | OCa) (%) | CECb) (cmol(+)/kg) | Clay (%) | pH (H2O) | ECc) (mS/cm) |
|---|---|---|---|---|---|---|---|
| S1 | Sand-dune Regosol | sand | 0.06 | 3.4 | 2.4 | 7.5 | 0.04 |
| S2 | Gray lowland soil | sandy loam | 0.85 | 12.2 | 14.6 | 4.8 | 0.26 |
| S3 | Yellow soil | light clay | 1.02 | 11.4 | 39.0 | 5.3 | 0.09 |
| S4 | Brown forest soil | light clay | 1.15 | 17.2 | 35.5 | 4.7 | 0.09 |
| S5 | Gray lowland soil | silty clay | 1.46 | 18.2 | 25.3 | 5.8 | 0.17 |
| S6 | Andosol | loam | 4.32 | 26.3 | 11.3 | 6.4 | 0.28 |
| S7 | Andosol | loam | 5.21 | 33.8 | 10.8 | 5.5 | 0.15 |
| S8 | Andosol | silty loam | 8.65 | 35.4 | 1.8 | 5.8 | 0.05 |
a) Organic carbon content. b) Cation exchange capacity. c) Electrical conductivity.
Sorption experiments were carried out using a batch equilibration technique.33) CaCl2 (25 mL, 0.01 M) in distilled water was added to 5 g of soil in a 50-mL glass centrifuge tube. The openings of the tubes were covered with Teflon sheets and closed with screw-caps. The tubes were agitated on a thermostat shaker (Taitec, Saitama, Japan) in the dark for 24 hr at 25±2°C. After shaking, 25 µL of acetone stock solution was added to the tubes. The final concentration of each pesticide in the aqueous phase was 0.1 µg/mL. The soil–solution mixtures were shaken again for 24 hr under the same conditions. After equilibration, the mixtures were centrifuged at 1,200×g for 30 min. A 15-mL aliquot of the supernatant was taken and used to analyze the concentrations of pesticides to determine Kd values. In addition, the masses of pesticides in the remaining samples were analyzed to calculate mass balance. All sorption experiments were performed in duplicate except for experiments involving group B pesticides on soil S7, which were performed in triplicate.
The mass fraction of pesticides sorbed on the soil phase at equilibrium, x/m (µg/g), was calculated by subtracting the mass concentration of pesticides in the aqueous phase at equilibrium, Ce (µg/mL), from the initial mass concentration of pesticides in aqueous phase, Ci (µg/mL), as follows:
 | (1) |
where V is the solution volume (mL) and M is the soil mass (g). The soil–water distribution coefficient, Kd (mL/g), was calculated using the following equation:
 | (2) |
The OC-normalized sorption coefficient, Koc (mL/g), was determined by dividing the Kd values by OC content in soil as follows:
 | (3) |
where %OC is the percentage of OC in the soil sample (g/g).
The mass balance (MB, %) was calculated as follows:
 | (4) |
where Valiq is the volume of the aliquot taken from the supernatant (mL) and mE is the mass of pesticides extracted from the remaining sample after removal of the aliquot of supernatant (µg).
4. Pesticide analysisAn aliquot of approximately 15 mL taken from the supernatant was analyzed to quantify pesticides using 3 different methods for each analytical group (Supplemental Figures S1–S3). The aliquots were cleaned with a diatomite column (Inertsep K-solute 20 mL; GL Sciences, Tokyo, Japan) followed by the following mini-columns: a PSA column (500 mg; Supelco, Bellefonte, USA), an Accell CM column (500 mg; Waters, Milford, USA), and an ENVI-Carb II/PSA column (500 mg/500 mg; Supelco) for groups A, B, and C, respectively. The cleaned samples were analyzed by liquid chromatography-tandem mass spectrometry (LC-MS/MS) for group A (Supplemental Tables S2 and S3) and gas chromatography-mass spectrometry (GC-MS) for groups B and C (Supplemental Tables S4 and S5).
The pesticides in the remaining sample were extracted by acetone after the supernatant was removed, and acetone (30 mL) was added to the remaining sample. The tubes were shaken in a thermostat shaker for 20 min at 25±2°C and subsequently centrifuged at 1,200×g for 10 min. The supernatant was carefully removed. This extraction procedure was repeated twice. The collected supernatant was evaporated to approximately 10 mL with a rotary evaporator and analyzed using the same corresponding method as mentioned in the above methods for each analytical group.
A recovery test of the pesticides was performed with deionized water and test soils. Deionized water (15 mL) spiked at 1 ng/mL for all group pesticides and each soil (5 g) spiked at 5 and 3 ng/g for group A and groups B and C, respectively, were analyzed using the above-mentioned methods; however, 10 mL of deionized water was added to soil samples prior to acetone extraction. The mean recovery from the 4 replicates for group A and 5 replicates for groups B and C ranged from 71.1 to 117.0% for all compounds; the coefficients of variation (CVs) were below 16.7% for all compounds (Supplemental Tables S6 and S7). The limits of quantification (LOQs) for pesticide analysis were calculated according to Japanese Industrial Standard (JIS) K 0312.34) The LOQs for all compounds in deionized water and all soil samples ranged from 0.27 to 0.87 ng/mL and 0.19 to 5.48 ng/g, respectively (Supplemental Tables S6 and S7).
5. Sorption experiment for carbonaceous materialsIn order to investigate the effect of the chemical structure of pesticides on activated carbon (AC) and graphite (GP) sorption, which was employed as a model substance for BC,35,36) the AC-acetone and GP-acetone distribution coefficients (KAC and KGP, respectively) of cadusafos, chloroneb, and procymidone, which have different chemical structures, were measured by a batch equilibration technique. Acetone solutions (5 mL, 1 µg/mL) of each pesticide were added to 50 mg of AC (SS1; Ajinomoto Fine-Techno Company, Kanagawa, Japan) and 0.5 g of GP (ENVI-Carb; Supelco) in a 10-mL glass centrifuge tube. The tubes were agitated on a thermostat shaker in the dark for 24 hr at 25±2°C. After shaking, the mixtures were centrifuged at 1,200×g for 30 min. Aliquots of the supernatant (500 µL) were spiked with 200 µL of acetone solution (2.5 µg/mL) of the internal standard (13C6-labeled fenthion), filtered through a 0.45-µm PTFE filter, and analyzed by GC-MS (Supplemental Tables S4 and S5). KAC and KGP were calculated from formulas (1) and (2) in the same way as Kd. All sorption experiments were performed in triplicate.
6. Solid-state 13C NMR analysisIn order to perform solid-state 13C NMR analysis, 7 test soils (except soil S1, for which it seemed difficult to characterize OC because of low OC content) were passed through a 0.2-mm sieve and treated with hydrofluoric acid (HF) to concentrate the OC and remove paramagnetic minerals. Although HF is a strong agent, Rumbel et al.37) report that the chemical composition of soil organic matter does not change after 10% HF treatment. Thirty milliliters of 8% (w/w) aqueous HF solution was added to 10 g of soil in a polyethylene tube. The tubes were shaken for 2 hr at room temperature and centrifuged at 3,800×g for 15 min, and the supernatant was discarded. The treatment was repeated 7 times using different shaking times (5×2 hr and 2×16 hr). After the final treatment, 30 mL of deionized water was added to the residues. The tubes were shaken for 30 min at room temperature and centrifuged at 3,800×g for 15 min, and the supernatant was discarded. The residues were washed an additional 7 times and dried at 50°C for 2 days. The dried samples were subsequently powdered using a mortar and pestle.
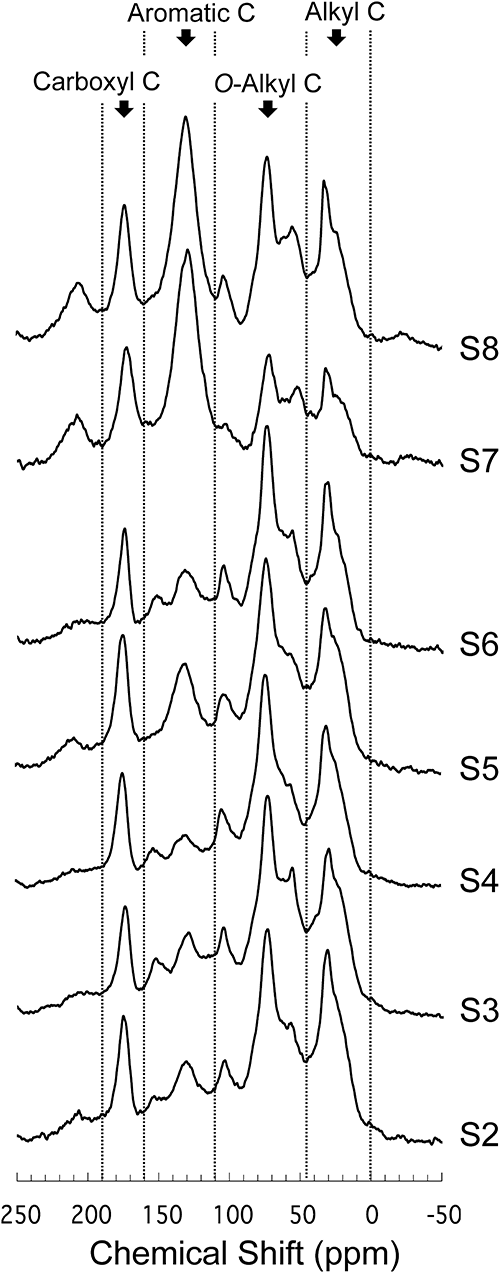
The solid-state 13C NMR spectra of the powdered samples were collected using the CPMAS technique by an FT NMR system (Alpha 300; JEOL, Tokyo, Japan); the analytical conditions of NMR have been described previously.38) The powdered samples were transferred into a zirconia rotor (6 mm i.d.) with a KEL-F cap (JEOL, Tokyo, Japan), and the 13C NMR signals were measured at 75.45 MHz with magic angle spinning of 6 kHz, a contact time of 1 msec, and a 3-sec pulse interval. Fourier transformation was conducted using a broadening factor of 100 Hz. The 13C chemical shift scale was referenced to that of tetramethylsilane (0 ppm) calibrated using adamantane (29.5 ppm). The 13C NMR spectra were integrated into 4 chemical shift regions: 0–45 ppm, alkyl carbon; 45–110 ppm, O-alkyl carbon; 110–160 ppm, aromatic carbon; and 160–190 ppm, carboxyl carbon.39) The relative proportions of each carbon type were calculated on the basis of the total carbon signal between 0 and 190 ppm.
7. Molecular modelingThe molecular structures of pesticides were geometrically optimized using the PM7 semi-empirical Hamiltonian function (keywords: EF, PRECISE, GNORM=0.05, GRAPHF, MMOK) in the MOPAC 2012 package40) using the Winmostar program (X-Ability, Tokyo, Japan).
The Kd and MB values of the 17 pesticides with 8 soils are shown in Supplemental Table S8. The MB of the sorption test ranged from 70.0 to 114.6% for all experiments. The MB of some sorption tests, particularly methidathion, was less than 80%. Similarly, the mean recovery of methidathion on 4 soil samples was less than 80%. Therefore, it is possible that the extraction of methidathion from the soil samples was insufficient. However, Kd values were calculated using quantitative values in the aqueous phase, and the mean recovery of methidathion from deionized water was 88.8%; therefore, there is no effect of extraction efficacy from soil samples on the variability of Kd values. The Kd values varied considerably with respect to the soil type for a given pesticide, ranging from 1.41 to 582 mL/g for tolclofos-methyl, which had the highest ratio between minimum and maximum values.
In order to determine which soil properties influence the variability of Kd values, linear regression analysis between Kd values and soil properties was performed (Table 3). The Kd values of almost all pesticides were more strongly correlated with OC content or CEC than other soil properties such as pH, clay content, and EC. Hydrophobic interactions are generally known to play an important role in the sorption of nonionic pesticides in soils; furthermore, OC content is positively correlated with the Kd values of nonionic pesticides.10) On the other hand, little is known about the relationship between CEC and the Kd values of nonionic pesticides. Although the strength of CEC in soils is closely associated with negatively charged sites of OC and clay minerals, several studies show that the contribution of OC to CEC in soils is greater than that in clay minerals.41,42) Indeed, the OC content of test soils in the present study was positively correlated with CEC (r=0.93, p<0.001); therefore, Kd values appear to be positively correlated with CEC.
| Compound | No. soils | r | ||||
|---|---|---|---|---|---|---|
| OC | CEC | Clay | pH | EC | ||
| Imidacloprid | 8 | 0.69 | 0.77* | −0.39 | −0.06 | −0.10 |
| Dimethoate | 4 | 0.39 | 0.70 | −0.46 | 0.11 | −0.05 |
| Clothianidin | 7 | 0.77* | 0.87* | −0.63 | 0.27 | −0.29 |
| Thiacloprid | 7 | 0.73 | 0.85* | −0.61 | 0.26 | −0.26 |
| Metalaxyl | 7 | 0.53 | 0.68 | −0.20 | −0.08 | −0.08 |
| Fosthiazate | 6 | 0.59 | 0.80 | −0.46 | 0.26 | −0.26 |
| Methidathion | 8 | 0.92** | 0.87** | −0.52 | −0.02 | −0.24 |
| Fenobucarb | 5 | 0.52 | 0.75 | −0.57 | −0.14 | −0.05 |
| Flutolanil | 7 | 0.56 | 0.74 | −0.52 | 0.27 | −0.04 |
| Procymidone | 7 | 0.52 | 0.72 | −0.47 | 0.25 | −0.05 |
| Fenitrothion | 8 | 0.73* | 0.82* | −0.41 | −0.06 | −0.01 |
| Tetraconazole | 8 | 0.69 | 0.83* | −0.32 | −0.05 | 0.07 |
| Chloroneb | 7 | 0.60 | 0.77* | −0.52 | 0.21 | −0.17 |
| Diazinon | 7 | 0.72 | 0.88* | −0.70 | 0.38 | 0.02 |
| Cadusafos | 7 | 0.57 | 0.76* | −0.52 | 0.31 | −0.03 |
| Tolclofos-methyl | 8 | 0.68 | 0.81* | −0.35 | −0.07 | 0.11 |
| Tetradifon | 8 | 0.81* | 0.91** | −0.36 | −0.06 | 0.23 |
* Significant at p<0.05; ** significant at p<0.01.
Figure 1 shows the variability of the log Koc values of all experiments; numerical values of Koc are shown in Supplemental Table S8. As mentioned above, the sorption process of test pesticides in soils was clearly dominated by OC. However, the Koc values of a given pesticide exhibited high variability among soils. The CVs of Koc values of a pesticide ranged from 36.6% for tetradifon to 173% for metalaxyl. Gerstl et al.9,43) show that the Koc values of pesticides on soils with low organic matter content (<0.5%) are appreciably high because of the contribution of the mineral fraction to the sorption process. In particular, the Koc value of soil S1 (OC content=0.06%) for metalaxyl tended to be higher than those of other soils. Nevertheless, the reason for the variability in Koc values remains unknown even though the Koc value of soil S1 was excluded; this is because the CVs of the Koc values of a pesticide ranged from 29.5% for tetradifon to 125% for imidacloprid. Wauchope et al.10) reviewed the variability of Koc values in the literature and report the typical CV of the Koc values of a given pesticide ranges from 40 to 60%. In the present study, even though the Koc value of soil S1 was excluded, the CVs of the Koc values for 11 pesticides exceeded 60%. The Koc values of soil S7 for almost all pesticides were higher than those of other test soils. Hence, it is clear that the contribution of soil S7 to Koc variability is high.

On the other hand, when Koc properties were analyzed with respect to the type of pesticide, the Koc values of tolclofos-methyl and tetradifon, which are highly lipophilic (log Kow=4.03–4.56 and 3.95–5.52, respectively), were higher than those of other pesticides. These results suggest that log Koc values increase with the increasing log Kow of pesticides.43–45) However, cadusafos (log Kow=3.83–4.28) had low Koc values for lipophilicity. Cadusafos is aliphatic, i.e., it has non-aromatic rings. Similarly, the Koc values of dimethoate and fosthiazate, which have non-aromatic rings, were relatively low. These results imply that the interactions involving aromatic rings are important in the soil sorption of pesticides.
3. Molecular nature of soil OCThe 13C NMR spectra and relative proportions of each carbon type for 7 test soils are shown Figure 2 and Table 4, respectively. O-Alkyl carbons (45–110 ppm), which include various polar components (e.g., polysaccharides, amino acids, lipids, etc.), were the most prevalent carbon type in all soil samples except soils S7 and S8, which is concordant with previous studies.12,13,46) On the other hand, aromatic carbons (110–160 ppm), which correspond to lignin, tannin, and aromatic amino acids, were the carbon type exhibiting the greatest variability among test soils, ranging from 12.6 to 41.3%. Two test Andosols (soils S7 and S8) particularly exhibited greater proportions of aromatic carbon than other soils. Mahieu et al.46) collected 13C CPMAS NMR data on 311 soils from the literature and reported that the mean, maximum, and minimum proportions of aromatic carbon were 20.0±6.0%, 44.5%, and 6.8%, respectively. Therefore, the proportions of aromatic carbon in soils S7 and S8 (41.3% and 33.9%, respectively) are considerably higher than those of soils in the literature.
| Soil | Alkyl (0–45 ppm) | O-Alkyl (45–110 ppm) | Aromatic (110–160 ppm) | Carboxyl (160–190 ppm) |
|---|---|---|---|---|
| S2 | 28.7 | 46.0 | 15.2 | 10.1 |
| S3 | 26.0 | 48.0 | 17.3 | 8.7 |
| S4 | 27.4 | 49.8 | 12.6 | 10.2 |
| S5 | 24.8 | 44.7 | 18.6 | 11.8 |
| S6 | 23.8 | 47.4 | 18.2 | 10.5 |
| S7 | 16.9 | 27.3 | 41.3 | 14.5 |
| S8 | 19.7 | 33.7 | 33.9 | 12.7 |
Aromatic carbon content is generally considered to increase as a result of the decomposition of OC. Inber et al.47) investigated changes in the OC structure of cattle manure during the composting process and found that the proportions of aromatic, alkyl, and carboxyl carbon increase, whereas that of O-alkyl carbon decreases. Similarly, the proportions of carboxyl carbon in soils S7 and S8, which contained abundant aromatic carbon, were higher than those in other soils, whereas the proportion of O-alkyl carbon was lower. However, the proportions of alkyl carbon in soils S7 and S8 were lower than those in other soils. These results imply that the degree of decomposition of OC alone is insufficient to explain the difference in OC quality among test soils.
Golchin et al.19) investigated the effects of artificial burning on the chemical nature of OC in soils; they found that a grassland site with a long history of annual burning had lower alkyl and O-alkyl carbon contents but higher aromatic and carboxyl carbon contents than forest sites that had no burning for many decades. In addition, Sultana et al.48) report that the 13C NMR spectra of charred plant materials isolated from Japanese Andosols using a specific gravity method exhibited a dominant peak of aromatic carbon with the proportion of aromatic carbon ranging from 61 to 74%. There is no record that the present test soils have been burned in the last several decades. However, grasslands containing Japanese Andosol, in which the dominant vegetation is Japanese pampas grass, which was necessary for traditional daily life, are thought to have been maintained by burning activity.19,21,49,50) These studies suggest that BC arising from the burning of vegetation may be partly responsible for the high proportion of aromatic carbon in soils S7 and S8 in the present study.
4. Effect of organic carbon quality on Koc variability of pesticidesThe correlation coefficients between the log Koc values of pesticides and the proportions of each carbon type are shown in Table 5. The log Koc values for almost all pesticides were positively correlated with aromatic and carboxyl carbon contents and negatively correlated with O-alkyl and alkyl carbon contents. The absolute values of r increased with increasing CVs (%) of Koc values for a given pesticide. The correlation coefficients between the r values and CVs (%) for alkyl, O-alkyl, aromatic, and carboxyl carbon were −0.88 (p<0.001), −0.90 (p<0.001), 0.89 (p<0.001), and 0.90 (p<0.001), respectively.
| Compound | No. soils | CV (%) of Koc values | r | |||
|---|---|---|---|---|---|---|
| Alkyl | O-Alkyl | Aromatic | Carboxyl | |||
| Imidacloprid | 7 | 124.9 | −0.91** | −0.95** | 0.93** | 0.97** |
| Dimethoate | 4 | 82.4 | −0.57 | −0.63 | 0.60 | 0.73 |
| Clothianidin | 7 | 113.8 | −0.99** | −0.94** | 0.97** | 0.91** |
| Thiacloprid | 7 | 115.4 | −0.92** | −0.95** | 0.94** | 0.97** |
| Metalaxyl | 6 | 70.2 | −0.28 | −0.32 | 0.28 | 0.54 |
| Fosthiazate | 6 | 46.9 | −0.05 | −0.12 | 0.07 | 0.27 |
| Methidathion | 7 | 93.8 | −0.97** | −0.97** | 0.98** | 0.91** |
| Fenobucarb | 5 | 92.2 | −0.80 | −0.73 | 0.76 | 0.67 |
| Flutolanil | 7 | 65.9 | −0.30 | −0.41 | 0.39 | 0.29 |
| Procymidone | 7 | 84.9 | −0.58 | −0.55 | 0.57 | 0.52 |
| Fenitrothion | 7 | 76.3 | −0.66 | −0.80* | 0.75 | 0.78* |
| Tetraconazole | 7 | 50.2 | −0.42 | −0.25 | 0.30 | 0.30 |
| Chloroneb | 7 | 117.0 | −0.86* | −0.91** | 0.89** | 0.92** |
| Diazinon | 7 | 48.7 | 0.51 | 0.31 | −0.40 | −0.23 |
| Cadusafos | 7 | 59.9 | −0.38 | −0.41 | 0.40 | 0.40 |
| Tolclofos-methyl | 7 | 45.8 | −0.19 | −0.30 | 0.26 | 0.28 |
| Tetradifon | 7 | 29.5 | 0.40 | 0.34 | −0.36 | −0.37 |
* Significant at p<0.05; ** significant at p<0.01.
Similar to the present results, several reports demonstrate negative correlations between O-alkyl carbon content, which includes many polar components, and the Koc values of some pesticides such as atrazine,11) carbaryl,12) diuron,11,13) and phosalone.12) In addition, Mitchell et al.11) show that the Koc values of atrazine and diuron in soils from which the O-alkyl carbon components were removed by acid-hydrolysis are higher than those in untreated soils. They suggest that the hydrolyzable O-alkyl carbon component in soil might block affinity sorption sites such as aromatic and/or alkyl domains.
In contrast to O-alkyl carbon, these previous studies also show that aromatic carbon content is positively correlated with the Koc values of these pesticides, which is concordant with the present results. As discussed above, the aromatic carbon contents of test soils exhibited the greatest variability among carbon types, and the high aromatic carbon contents in soils S7 and S8 were involved in the presence of BC. Because the Koc values of almost all pesticides on soil S7, which had the greatest aromatic carbon content, were substantially higher than those on other soils, it is possible the BC contained in soil S7 greatly affects the sorption behavior of pesticides. The sorption of organic chemicals on BC is influenced by hydrophobicity, the presence of aromatic rings, and the planarity of the molecular structure.51–53) In other words, given the same log Kow value, the sorption of planar aromatics on BC is higher than that of aliphatics.52) In addition, even if a compound has aromatic rings, non-planar aromatics such as ortho-substituted polychlorinated biphenyls (PCBs) with a torsional structure between the 2 ring planes exhibit lower sorption than planar aromatics such as non-ortho PCBs.51,52) This is because planar aromatics can strongly adsorb to planar graphene surfaces of BC via π–π interactions. Focusing on the molecular structures of the test compounds (Fig. 3), the Kd values of chloroneb (a planar aromatic) on soil S7 were higher than those of cadusafos (aliphatic) and procymidone (non-planar aromatic with a torsional structure); this is in spite of the fact that the Kow value of chloroneb (log Kow=1.90–3.58) is of the same order of magnitude as that of procymidone (log Kow=2.67–3.30) and lower than that of cadusafos (log Kow=3.83–4.28) (Fig. 4). Figure 4 also shows the KAC and the KGP of chloroneb, cadusafos, and procymidone, verifying the effects of the chemical structures of the pesticides on BC sorption. Similar to the results for soil S7, the sorption of chloroneb to AC and GP was significantly greater than that of the other 2 compounds. Although AC and GP differ with respect to surface area, porosity, and the presence of an acid functional group, they have common structure—a graphene layer—from a molecular perspective.36) Sultana et al.48) also report that charred plant materials isolated from Japanese Andosols by a specific gravity method have 14- to 52-ring condensed aromatic structures. This implies that the graphene layer of carbonaceous materials is involved in the different sorption properties of the 3 compounds. Although the KAC and KGP values were measured using acetone as a liquid phase, the results of the sorption test of PCBs using activated carbon and acetone52) exhibited a similar trend to those using soot and water.51) In other words, the sorption strength of planar PCBs is higher than that of non-planar PCBs. On the other hand, although the overall structures of some pesticides such as imidacloprid and thiacloprid are non-planar, these pesticides exhibited relatively high Koc values (Fig. 1). This is probably because these pesticides can take on a planar conformation on the surface of one part of their molecular structures (as shown in Fig. 3) that can sorb to the planar graphene layer of BC via π–π interaction with parallel-displaced orientation.54–56) These results support the hypothesis that BC in soil strongly contributes to the Koc variability of pesticides on soil S7 if the conformation of the pesticide can be planar.
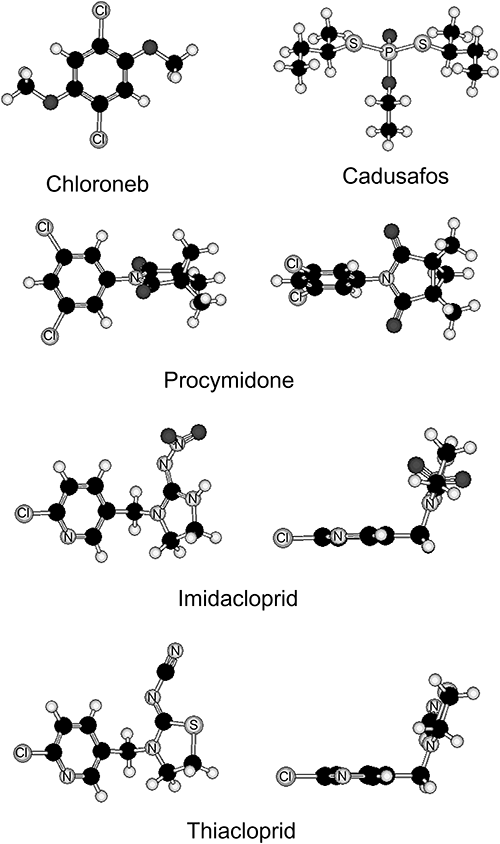
 : chlorine atom, Ⓝ: nitrogen atom, Ⓢ: sulfur atom.
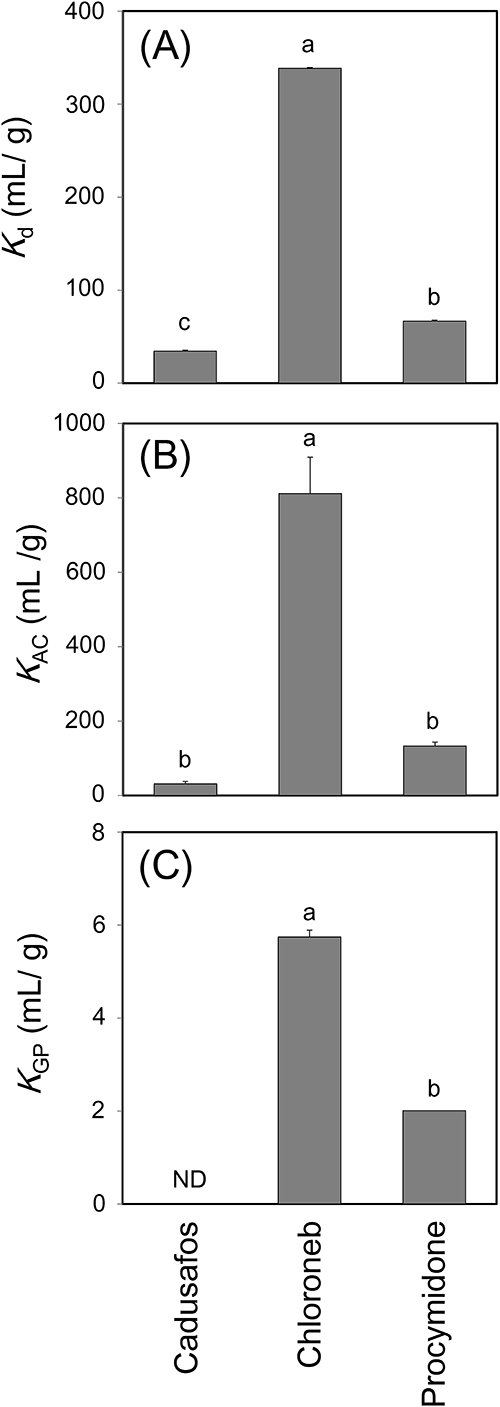
The present study suggests that the Koc values of Japanese soils are highly variable, because aromatic carbon content differed greatly among soils, especially Andosols. The log Koc values of some pesticides were positively correlated with aromatic carbon content measured by solid-state 13C NMR. However, because 13C NMR is a qualitative technique, the prediction of log Koc on the basis of aromatic carbon contents is inadequate. On the other hand, because the sorption properties of pesticides in Andosols with the greatest aromatic carbon contents exhibited trends similar to those in AC and GP, it is possible that BC in soil affects the sorption properties of pesticides. Several studies report that quantifying soot content in sediments and determining soot–water distribution coefficients accurately predicts the sorption of polycyclic aromatic hydrocarbons (PAHs) on sediments.35,57–59) These results imply that the sorption of pesticides on soils can also be predicted if it is possible to quantify BC in soils and assess the sorption of isolated BC. Unfortunately, no methods for quantifying BC in soils have been established.25) Therefore, further studies are required to isolate and precisely quantify BC in soil contributing to the sorption behavior of pesticides.
The authors thank Dr. S. Hiradate of the National Institute for Agro-Environmental Sciences for technical support in NMR analysis. The test soils were kindly supplied by Aichi Agricultural Research Center, Fukushima Agricultural Technology Centre, Tochigi Prefectural Agricultural Experiment Station, and NARO Agricultural Research Center. This study was financially supported by a Grant-in-Aid from the Ministry of the Environment (MOE), Japan. The opinions expressed in this paper are solely those of the authors and do not necessarily reflect the views of MOE.