Original Article
種の感受性分布を用いた68種の水稲用農薬の生態影響評価
2016 年 41 巻 1 号 p. 6-14

詳細
2016 年 41 巻 1 号 p. 6-14
In this study, the species sensitivity distributions (SSDs) of 68 pesticides commonly used in Japanese paddy fields were analyzed based on collected acute toxicity data as a higher-tier ecological effect assessment. Then, based on each SSD, the 5% hazardous concentration (HC5) values were calculated as the predicted no-effect concentrations for aquatic ecosystems. The differences between HC5 and registration criteria were small (within 10-fold) for 50 of the 68 pesticides. However, there were more than 10-fold differences for 9 insecticides and 9 herbicides of specific modes of action. These results suggest that the current effect assessment scheme could underestimate the effect of such pesticides. This is caused by the mode of action specific properties of species sensitivity difference.
In Japan, pesticide registration criteria concerning toxicity to aquatic organisms are set by Japan’s Ministry of Environment under the Pesticide Regulation Law.1) To determine the criteria, acute toxicity tests are conducted for fish (basically, Cyprinus carpio), daphnids (Daphnia magna), and algae (Pseudokirchneriella subcapitata), and then the minimum value of the 50% effect concentration (EC50) or 50% lethal concentration (LC50) is divided by an uncertainty factor that considers the species sensitivity difference (default 10, but depends on the data number for fish and crustaceans and 1 for algae). Subsequently, the predicted environmental concentration, which is the peak concentration in river water at the time of pesticide application, is calculated using an environmental model based on a standard scenario in a model basin.2) Finally, if the predicted environmental concentration is less than the registration criteria, the short-term aquatic risk is deemed insignificant and the pesticide is considered to meet the criteria.
Uncertainty factors have been used for considering species sensitivity differences to derive registration criteria. However, the scientific evidence for these values has not been clearly shown. Moreover, the species sensitivity differences are specific to the mode of action (MoA) of pesticides.3) Therefore, uniform values of the uncertainty factor may lead to underestimation or overestimation of the ecological effect. Instead, the species sensitivity distribution (SSD)4) has been used as a key concept for higher-tier ecological effect assessment. Species sensitivity to environmental contaminants varies markedly, and this variation can be described by the statistical distribution (often a log-normal distribution) estimated from sampled toxicity data (EC50s or LC50s) and visualized as a cumulative distribution function (Fig. 1).
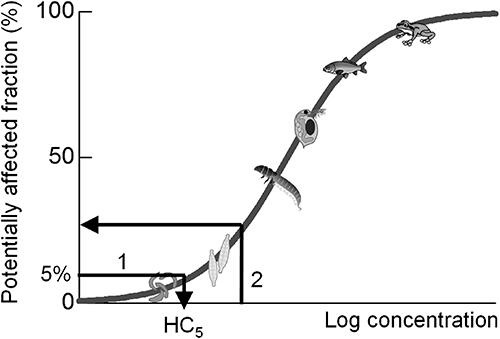
SSD has been used to determine hazardous concentrations for the protection of ecosystems and to reveal ecological risks. The 5th percentile of a distribution (called the 5% hazardous concentration, HC5) has been used in the United States,5) Europe,6,7) and Australia8) for deriving threshold concentrations that protect most species in a community (Fig. 1, arrow 1). Semi-field experiments (microcosm/mesocosm) have provided more realistic ecological effects of pesticides than single-species toxicity experiments in the laboratory. Several studies9–13) showed that the values of HC5 based on acute toxicity were protective against adverse ecological effects under single short-term exposure in freshwater microcosm/mesocosm experiments. Their results indicate the validity of HC5 values as predicted no-effect concentrations in aquatic ecosystems. SSD has also been used for quantitative ecological risk assessment of pesticides, such as diazinon14) and aldicarb15) insecticides, atrazine herbicide,16) and pesticide mixtures.17) Our previous studies9,18,19) also conducted probabilistic ecological risk assessment of several paddy insecticides and herbicides. The potentially affected fraction (PAF) is an index of the magnitude of ecological risk (Fig. 1, arrow 2). PAF represents the effect on species diversity, which is a quantitative index of the biodiversity effect.
The SSD approach is now adopted by a tier system in the European pesticide risk assessment scheme.20) However, the SSD application to pesticides in Japan has been very limited. The novelty of the present study is the application of SSD to a wide range of Japanese paddy pesticides. The acute SSDs of 68 pesticides that are commonly used in Japanese paddy fields were analyzed in this study as a higher-tier ecological effect assessment. Then HC5 values and registration criteria were compared to check the validity of the registration criteria. Moreover, the characteristics of SSD and the relationships between SSD and registration criteria are discussed with a particular focus on pesticide MoA.
SSDs for 68 pesticides (26 insecticides, 9 fungicides, and 33 herbicides) were analyzed (Tables 1–3). They are, or were previously, used in Japanese paddy fields. Although carbofuran has not been registered in Japan, it was included in analyses because it is a main metabolite of carbosulfan and benfuracarb and is often detected in river water.21) The MoAs (Tables 1–3) were derived from the Insecticide Resistance Action Committee,22) the Fungicide Resistance Action Committee,23) and the Herbicide Resistance Action Committee.24) However, other literature was used to derive the MoAs of propyrisulfuron,25) pyrimisulfan,26) tefuryltrione,27) and indanofan.1) The pesticide registration criteria concerning toxicity to aquatic organisms were derived from Japan’s Ministry of Environment1) (Tables 1–3). When registration criteria were not yet developed, the equivalent values for comparison purposes were calculated based on EC50s for the water flea D. magna (for insecticides) and green alga P. subcapitata (for herbicides).
| Insecticides | MoA*1 | Registration criteria (µg/L) | Arthropods | HC5 (µg/L) | HC50 (µg/L) | ||
|---|---|---|---|---|---|---|---|
| ln Mean | ln SD | n | |||||
| Fenobucarb | 1A | 1.9 | 4.04 | 1.81 | 22 | 2.9 (0.81–6.6) | 57 (29–110) |
| Carbosulfan | 1A | 0.1*2 | 0.18 | 0.80 | 8 | 0.32 (0.093–0.56) | 1.2 (0.70–2.0) |
| Benfuracarb | 1A | 0.99 | 1.79 | 1.06 | 5 | 1.1 (0.070–2.5) | 6.0 (2.2–16) |
| Carbofuran | 1A | 0.94*2 | 3.50 | 1.84 | 9 | 1.6 (0.13–5.4) | 33 (11–100) |
| Fenitrothion | 1B | 0.76*2 | 2.98 | 1.63 | 37 | 1.4 (0.59–2.4) | 20 (13–31) |
| Fenthion | 1B | 0.13*2 | 2.49 | 2.06 | 31 | 0.41 (0.13–0.91) | 12 (6.4–23) |
| Phenthoate | 1B | 0.077 | 1.60 | 1.88 | 11 | 0.22 (0.025–0.70) | 4.9 (1.8–14) |
| Diazinon | 1B | 0.077 | 2.98 | 1.66 | 23 | 1.3 (0.41–2.7) | 20 (11–36) |
| Fipronil | 2B | 19 | 1.29 | 2.17 | 21 | 0.10 (0.021–0.28) | 3.6 (1.6–8.2) |
| Ethiprole | 2B | 690 | 5.17 | 2.65 | 5 | 2.3 (0.0026–20) | 180 (14–2200) |
| Etofenprox | 3A | 0.67 | 0.35 | 1.71 | 10 | 0.085 (0.0098–0.25) | 1.4 (0.53–3.8) |
| Silafluofen | 3A | 0.067 | 0.35 | 2.18 | 5 | 0.039 (0.00015–0.24) | 1.4 (0.18–11) |
| Imidacloprid | 4A | 8500 | 3.58 | 2.59 | 16 | 0.51 (0.039–1.7) | 36 (9.5–100) |
| Clothianidin | 4A | 4000*2 | 4.37 | 3.01 | 6 | 0.56 (0.0011–5.7) | 79 (6.6–940) |
| Dinotefuran | 4A | 24000 | 8.00 | 4.06 | 7 | 3.8 (0.0030–71) | 3000 (150–59000) |
| Thiacloprid | 4A | 840 | 7.01 | 3.96 | 8 | 1.6 (0.0037–25) | 1100 (78–16000) |
| Thiamethoxam | 4A | 40000*2 | 7.68 | 3.47 | 7 | 7.1 (0.016–89) | 2200 (170–28000) |
| Nitenpyram | 4A | 9900 | 7.39 | 2.88 | 5 | 14 (0.0090–150) | 1600 (100–25000) |
| Spinosad | 5 | 14.8*2 | 5.49 | 3.52 | 7 | 0.74 (0.0018–10) | 240 (19–3200) |
| Pymetrozine | 9B | 9300 | 12.58 | 0.98 | 5 | 58000 (4700–130000) | 290000 (110000–740000) |
| Cartap | 14 | 1.0*2 | 5.78 | 2.85 | 13 | 3.0 (0.16–15) | 320 (79–1300) |
| Thiocyclam | 14 | 1.9 | 4.98 | 1.93 | 7 | 6.1 (0.21–25) | 150 (35–600) |
| diflubenzuron | 15 | 0.43 | 4.30 | 4.49 | 16 | 0.046 (0.00088–0.47) | 74 (10–530) |
| Bupurofezin | 16 | 80 | 6.39 | 0.72 | 5 | 180 (29–330) | 590 (300–1200) |
| Tebufenozide | 18 | 83 | 7.22 | 1.11 | 8 | 220 (40–470) | 1400 (650–2900) |
| Chlorantraniliprole | 28 | 2.9 | 4.83 | 1.90 | 11 | 5.5 (0.60–17) | 130 (44–350) |
*1 1A, 1B: Acetylcholinesterase inhibitors; 2B: GABA-gated chloride channel blockers; 3A: Sodium channel modulators; 4A: Nicotinic acetylcholine receptor competitive modulators; 5: Nicotinic acetylcholine receptor allosteric modulators; 9B: Modulators of chordotonal organs; 14: Nicotinic acetylcholine receptor channel blockers; 15: Inhibitors of chitin biosynthesis, type 0; 16: Inhibitors of chitin biosynthesis, type 1; 18: Ecdysone receptor agonists; and 28: Ryanodine receptor modulators. *2 Registration criteria are not yet developed, therefore calculated values based on the EC50 for D. magna divided by 10 (default uncertainty factor) are shown.
In this study, the SSD analysis was based on acute toxicity to freshwater aquatic organisms. Information on the acute (defined as a test duration of 1–7 days and endpoint of growth rate for primary producers and immobility/mortality for animals) effect of pesticides was collected from open literature. The literature includes the Pesticide Handbook,27) Pesticide Manual,28) Results of eco-toxicity tests of chemicals by Japan’s Ministry of Environment,29) Assessment report of the pesticide registration criteria concerning toxicity to aquatic organisms by Japan’s Ministry of Environment,1) various risk assessment reports by national and international agencies, the ECOTOX database by the U. S. Environmental Protection Agency (EPA), and other open documents written in Japanese. Data collection from the ECOTOX database was limited when the original paper in scientific journals was available.
The reliability of the information was categorized into four classes according to the Organization for Economic Cooperation and Development (OECD) Manual for the Assessment of Chemicals30): 1=reliable without restrictions, 2=reliable with restrictions, 3=not reliable, and 4=not assignable. Toxicity testing in accordance with the OECD test guidelines and the principles of Good Laboratory Practice was evaluated as reliability class 1. The toxicity data used in the pesticide registration criteria concerning toxicity to aquatic organisms1) were evaluated as reliability class 1 due to their examination by experts. Data in assessment reports published by the governments were evaluated as reliability class 2. Data in the Pesticide Handbook27) and the Pesticide Manual28) were evaluated as reliability class 2, given the expert knowledge and long experience of the editors. The reliability of data in the original papers in scientific journals was evaluated according to the method proposed by Hobbs et al.31) In their method, the quality of data presented in published research papers is assessed by awarding scores based on a series of criteria or questions designed to ascertain the scientific rigor of the testing. Their method is robust and independent of the assessors for evaluating the quality of aquatic toxicity data.31) The reliability of a paper is classified as unacceptable (equivalent to reliability class 3), acceptable (equivalent to reliability class 2), or high quality (equivalent to reliability class 1), depending on the total quality score. Collected acute toxicity data (EC50 and LC50) were entered into a database.
3. SSD analysisSSD analysis was conducted using the collected datasets on toxicity. Only data evaluated as reliability class 1 or class 2 were used for SSD analysis. The data for insecticides were separated into arthropods and other species, because arthropods are the most sensitive to insecticides among the taxonomic groups, and the SSD showed a clear separation of arthropods from other species.10) The data for herbicides were separated into primary producers and other species, because primary producers are the most sensitive to herbicides among the taxonomic groups and the SSD showed a clear separation of primary producers from others.11) The data for fungicides were all used for SSD analysis, because the sensitivity difference among the taxonomic groups is not clear.12) The minimum data requirement for SSD analysis in the present study was set to 5 genera32) for each most-sensitive taxonomic group.
All data were reduced to genus-level data according to the U.S. EPA guideline,5) and all data were converted to interval data according to Naito et al.33) Multiple data on the same species and same genus were treated as interval data using the minimum and maximum data of a dataset. If only one data item was available in the same genus, for example, a value of 1.5, the data was treated as interval data of 1.45–1.55 (considering 2 significant figures), because each value between the intervals could be rounded to 1.5. If the data were reported as “greater than” values, they were treated as interval data from the minimum value to 10 times the minimum value.19) For example, with an EC50 value >100, the data was treated as interval data of 100–1,000. Each interval dataset on the most-sensitive taxonomic group was fitted to a log-normal distribution using the maximum likelihood method.33) The maximum likelihood parameters of the distribution, logarithmic mean (referred as ln Mean) and logarithmic standard deviation (referred as ln SD), were obtained by fitting. The values of HC5 and the 50th percentile of SSD (HC50) were calculated (Fig. 1, arrow 1) as follows:
 |
The relationship between the slope of the SSD (ln SD) and the MoA was tested using a one-way analysis of variance (ANOVA). Then HC5 values were compared with the registration criteria (Tables 1–3). In addition, the ecological effect level (described as PAF) for the pesticide concentration that is equivalent to the registration criteria was calculated using each SSD and the registration criteria (Fig. 1, arrow 2).
The typical SSD curves for insecticide imidacloprid, fungicide IBP, and herbicide bensulfuron-methyl are shown in Fig. 2. The SSDs for imidacloprid and bensulfuron-methyl showed a clear separation of sensitive (arthropods for imidacloprid and primary producers for bensulfuron-methyl) and insensitive taxonomic groups, but the SSD for IBP did not show such a tendency. The results of SSD analysis of 68 pesticides are summarized in Tables 1–3. The sensitivity of each genus of freshwater aquatic organisms is listed in Supplemental Table S1, and each SSD curve is shown in Supplemental Fig. S1. The number of genera used for SSD analysis indicates the reliability of SSD, and they were 5–37 for insecticides, 5–22 for fungicides, and 5–31 for herbicides. The HC5 values indicate the predicted no-effect concentration, and they were 0.039–58,000 µg/L for insecticides, 2.5–29,000 µg/L for fungicides, and 0.067–38,000 µg/L for herbicides. The HC50 values indicate the geometric mean of toxicities, and they were 1.2–290,000 µg/L for insecticides, 1,100–290,000 µg/L for fungicides, and 15–58,000 µg/L for herbicides. The values of ln SD indicate the slopes of the SSD, and theywere 0.72–4.49 for insecticides, 0.45–3.72 for fungicides, and 0.25–4.36 for herbicides.

The value of ln SD becomes large (i.e., the slope is gentle) when the difference in species sensitivity is large. The ln SD values did not differ significantly among insecticides, fungicides, and herbicides (one-way ANOVA, p>0.05). However, the ln SD values of insecticide SSDs differed significantly among MoAs (one-way ANOVA, p<0.001). The ln SD values were higher for MoAs 4A, 5, and 15 than those for other MoAs. The species sensitivity (EC50 and LC50) differences were more than 100,000 fold for diflubenzuron (MoA 15) and around 10,000 fold for insecticides of MoAs 4A and 5 (original data are shown in Supplemental Table S1). In addition, the ln SD values of herbicide SSDs differed significantly among MoAs (one-way ANOVA, p<0.001). Those for MoAs B, E, and K3 were higher than for other MoAs. The species sensitivity differences were around 10,000 fold for MoA B, E, and K3 herbicides except for pyriminobac-methyl and mefenacet (original data are shown in Supplemental Table S1). These results suggest that the differences in species sensitivity are specific to MoA.
2. Comparison between HC5 and registration criteriaThe HC5 values, which correspond to the predicted no-effect concentration for aquatic ecosystems, and pesticide registration criteria were compared (Fig. 3). The differences between them were small (within 10 fold) for 50 of the 68 pesticides. However, there were more than 10-fold differences for 9 insecticides and 9 herbicides (Tables 1–3 and Fig. 3). These pesticides tended to have specific MoAs: 2B, 4A, and 5 for insecticides and B, E, and F2 for herbicides. The differences between the registration criteria and HC5 values after log-transformation for MoA 2B, 4A, and 5 insecticides were significantly higher than those for other insecticides (p<0.001). Similarly, those for MoA B, E, and F2 herbicides were significantly higher than those for other herbicides (p<0.001). In particular, those were markedly large (511–16,820 fold) for MoA 4A insecticides (i.e., neonicotinoids).

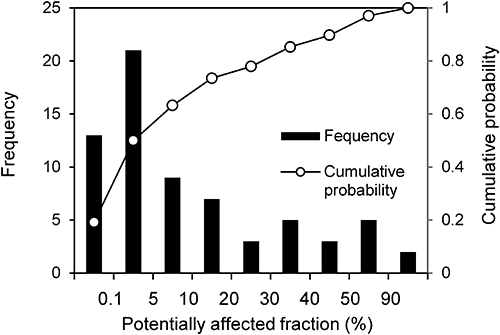
The ecological effect level (described as PAF) under the registration criteria was calculated using each SSD and the registration criteria (Fig. 4). The PAF values ranged from <0.1 to 98.3%, with a median of 5.1%, an average of 16.7%, and a standard deviation of 24.9%. Thus, half of the registration criteria corresponded to an effect level of <5% and the other half to an effect level of >5%. This result indicates that the ecological effect levels under the registration criteria are not consistent among pesticides.
The variation in species sensitivity greatly depends on the chemical MoA.3,35) The results of the present study also clearly showed that the slope of the SSD (ln SD) significantly differed among MoAs. This indicates that the variation in species sensitivity is specific for each MoA. Ecological effect assessment of pesticides that have large ln SD values should be considered cautiously, because the effect of data availability on the assessment result would be substantial. Therefore, insecticides with MoAs 4A, 5, and 15 and herbicides with MoAs B, E, and K3 are thought to be priority substances for investigating differences in species sensitivity. However, the toxicity data for each species would be similar for pesticides with small ln SD values, and therefore the effect of data availability would also be small. Most of the fungicides had small ln SD values, except for chlorothalonil (Table 2). However, fungicides may have strong toxicity to aquatic fungi, and such toxicity data are entirely lacking. These issues will be important subjects for further study.
| Fungicides | MoA*1 | Registration criteria (µg/L) | All organisms | HC5 (µg/L) | HC50 (µg/L) | ||
|---|---|---|---|---|---|---|---|
| ln Mean | ln SD | n | |||||
| Hydroxyisoxazole | A3 | 2800 | 12.57 | 1.40 | 13 | 29000 (6800–63000) | 290000 (140000–570000) |
| Orysastrobin | C3 | 120 | 7.68 | 0.87 | 5 | 520 (56–1100) | 2200 (940–5000) |
| IBP | F2 | 270 | 9.29 | 1.37 | 22 | 1100 (430–2100) | 11000 (6600–18000) |
| Isoprothiolane | F2 | 920 | 9.25 | 0.45 | 16 | 5000 (3300–6300) | 10000 (8500–13000) |
| Tricyclazole | I1 | 2100 | 10.07 | 1.08 | 17 | 4000 (1600–6900) | 24000 (15000–37000) |
| Phthalide | I1 | 87 | 11.46 | 1.57 | 17 | 7200 (1900–16000) | 95000 (49000–180000) |
| Pyroquilon | I1 | 3300 | 10.87 | 0.68 | 15 | 17000 (9200–25000) | 52000 (39000–72000) |
| Chlorothalonil | M | 8 | 7.02 | 3.72 | 25 | 2.5 (0.22–12) | 1100 (310–4000) |
| Probenazole | P2 | 270 | 10.09 | 1.64 | 13 | 1600 (300–4100) | 24000 (11000–54000) |
*1 A3: inhibitors of DNA/RNA synthesis; C3: complex III; cytochrome bc1 (ubiquinol oxidase) at Qo site (cyt b gene); F2: inhibitors of phospholipid biosynthesis and methyltransferase; I1: inhibitors of reductase in melanin biosynthesis; M: multi-site contact activity; and P2: host plant defense induction.
| Herbicides | MoA*1 | Registration criteria (µg/L) | Primary producers | HC5 (µg/L) | HC50 (µg/L) | ||
|---|---|---|---|---|---|---|---|
| ln Mean | ln SD | n | |||||
| Bensulfuron-methyl | B | 56 | 5.27 | 3.84 | 11 | 0.35 (0.0039–3.6) | 190 (24–1600) |
| Imazosulfuron | B | 206*2 | 6.70 | 3.16 | 8 | 4.5 (0.034–39) | 810 (98–6700) |
| Pyrazosulfuron-ethyl | B | 0.87 | 4.44 | 3.48 | 5 | 0.28 (0.000038–4.9) | 85 (3.1–2300) |
| Cyclosulfamuron | B | 3.5 | 5.91 | 4.36 | 6 | 0.28 (0.000035–8.1) | 370 (10–13000) |
| Propyrisulfuron | B | 11 | 7.29 | 2.79 | 6 | 15 (0.047–130) | 1500 (150–15000) |
| Pyrimisulfan | B | 20 | 6.07 | 2.95 | 7 | 3.4 (0.019–29) | 430 (50–3800) |
| Pyriminobac-methyl | B | 5900 | 10.96 | 0.25 | 6 | 38000 (23000–46000) | 58000 (47000–71000) |
| Simetryn | C1 | 6.2 | 3.53 | 0.85 | 31 | 8.5 (5.2–12) | 34 (26–44) |
| Bentazone | C3 | 8800 | 9.66 | 0.75 | 6 | 4600 (970–8100) | 16000 (8500–29000) |
| Oxadiazon | E | 35 | 4.20 | 2.85 | 5 | 0.62 (0.00042–6.5) | 67 (4.4–1000) |
| Pentoxanzone | E | 0.79 | 2.69 | 3.28 | 6 | 0.067 (0.000077–0.84) | 15 (0.99–220) |
| Oxadiargyl | E | 7.3 | 3.29 | 3.24 | 8 | 0.13 (0.00088–1.2) | 27 (3.1–240) |
| Pyraclonil | E | 3.8 | 4.88 | 3.32 | 6 | 0.56 (0.00059–7.2) | 130 (8.6–2000) |
| Carfentrazone-ethyl | E | 13 | 4.52 | 2.98 | 9 | 0.68 (0.011–4.8) | 92 (14–580) |
| Pyrazolynate | F2 | 38.9*2 | 4.78 | 2.68 | 5 | 1.4 (0.0015–13) | 120 (9.3–1500) |
| Benzofenap | F2 | 37 | 5.15 | 1.45 | 6 | 16 (0.80–49) | 170 (52–570) |
| Tefuryltrione | F2 | 5300 | 10.40 | 1.45 | 6 | 3000 (150–9200) | 33000 (10000–110000) |
| Pyrazoxyfen | F2 | 1000*2 | 7.30 | 1.81 | 6 | 76 (1.8–300) | 1500 (330–6600) |
| Pretilachlor | K3 | 2.9 | 6.35 | 3.30 | 9 | 2.5 (0.026–22) | 570 (74–4400) |
| Mefenacet | K3 | 32 | 7.47 | 1.95 | 9 | 71 (4.8–250) | 1800 (520–5900) |
| Cafenstrole | K3 | 2 | 6.68 | 2.88 | 10 | 7.0 (0.18–43) | 800 (150–4200) |
| Butachlor | K3 | 3.1 | 6.25 | 3.17 | 6 | 2.8 (0.0041–32) | 520 (38–7000) |
| Fentrazamide | K3 | 6 | 7.25 | 3.27 | 6 | 6.5 (0.0076–81) | 1400 (96–21000) |
| Indanofan | K3 | 2.9 | 6.23 | 3.37 | 6 | 2.0 (0.0019–27) | 510 (32–8100) |
| Thiobencarb | N | 26 | 6.64 | 2.25 | 9 | 19 (0.84–82) | 770 (190–3100) |
| Esprocarb | N | 15 | 7.49 | 1.34 | 9 | 200 (31–480) | 1800 (780–4100) |
| Molinate | N | 410*2 | 8.42 | 1.31 | 8 | 530 (70–1300) | 4500 (1900–11000) |
| Benfuresate | N | 7300*2 | 10.28 | 1.01 | 6 | 5500 (690–12000) | 29000 (13000–67000) |
| Clomeprop | O | 36 | 5.42 | 1.31 | 5 | 26 (0.92–77) | 220 (65–790) |
| Bromobutide | Z | 480 | 9.72 | 0.72 | 5 | 5100 (810–9200) | 17000 (8400–33000) |
| Daimuron | Z | 42 | 8.45 | 0.94 | 7 | 1000 (190–2000) | 4700 (2300–9300) |
| Cumyluron | Z | 90 | 8.72 | 1.16 | 6 | 910 (83–2200) | 6100 (2400–16000) |
| Quinoclamine | Z | 6.3 | 3.79 | 0.76 | 7 | 13 (3.3–22) | 44 (25–77) |
*1 B: inhibitors of acetolactate synthase; C1, C3: inhibitors of photosynthesis by photosystem II; E: inhibitors of protoporphyrinogen oxidase; F2: inhibitors of 4-hydroxyphenyl-pyruvate-dioxygenase; K3: inhibitors of very long-chain fatty acid synthesis; N: inhibitors of lipid synthesis; O: Action like indole acetic acid; and Z: unknown. *2 Registration criteria are not yet developed, therefore calculated values based on the EC50 for P. subcapitata (uncertainty factor of 1) are shown.
The specificity of ln SD for each MoA can be applied to estimate the SSD of pesticides for which toxicity data are insufficient for analysis. A few studies have attempted such estimation using single-species toxicity data and information on the MoA.3,36) SSD application is limited in many cases owing to a lack of sufficient data. Therefore, the estimation method will be useful for a wide range of SSD applications for ecological effect assessment of various kinds of pesticides.
2. Relationship between HC5 and registration criteriaThe HC5 (predicted no-effect concentration based on SSD) and registration criteria showed similar values for many pesticides (50 of 68). This suggests that the current registration criteria are an appropriate index of the threshold level for toxicity to aquatic ecosystems for such pesticides. However, the relationships between them were specific to MoA. The current registration criteria are not an appropriate index for pesticides with specific MoAs (2B, 4A, and 5 for insecticides and B, E, and F2 for herbicides), because there are more sensitive species than the standard test organisms (D. magna for insecticides and P. subcapitata for herbicides).
Toxicities were compared between standard species and the most sensitive species for pesticides with registration criteria more than 10-fold higher than HC5 (Table 4). The comparisons showed that insecticides with MoAs 2B, 4A, and 5 had much higher toxicity to aquatic insects such as the caddisfly Cheumatopsyche brevilineata than to D. magna. Toxicity testing using aquatic insects is essential to assess the effect of these insecticides.37) The comparisons also showed that duckweed or cyanobacteria were the most sensitive to herbicides with MoA B, another green alga (Desmodesmus subspicatus) was the most sensitive to herbicides with MoA E, and diatom Navicula pelliculosa was the most sensitive to herbicides with MoA F2.
| Insecticides | MoA | EC50 on D. magna | Most sensitive species | EC50 on most sensitive species |
|---|---|---|---|---|
| Fipronil | 2B | 12.9–190 | Cheumatopsyche brevilineata | 0.153 |
| Ethiprole | 2B | >8330 | Cheumatopsyche brevilineata | 8.05 |
| Imidacloprid | 4A | 10440–95000 | Cypretta seurati | 1 |
| Clothianidin | 4A | 40000–73000 | Cheumatopsyche brevilineata | 4.44 |
| Dinotefuran | 4A | >100000 | Cheumatopsyche brevilineata | 10.4 |
| Thiacloprid | 4A | >85100 | Baetis rhodani | 4.6 |
| Thiamethoxam | 4A | >400000 | Cloeon sp. | 14 |
| Nitenpyram | 4A | >100000 | Cheumatopsyche brevilineata | 45 |
| Spinosad | 5 | 1480 | Cheumatopsyche brevilineata | 0.918 |
| Herbicides | MoA | EC50 on P. subcapitata | Most sensitive species | EC50 on most sensitive species |
| Bensulfuron-methyl | B | 20.4–62 | Lemna gibba | 0.8 |
| Imazosulfuron | B | 206–1000 | Lemna gibba | 1.46 |
| Cyclosulfamuron | B | 3.5 | Pseudoanabaena galeata | 3.1 |
| Oxadiazon | E | 4.23–35.7 | Desmodesmus subspicatus | 1.5 |
| Pentoxanzone | E | 0.846–1.31 | Desmodesmus subspicatus | 0.084 |
| Oxadiargyl | E | 7.3 | Desmodesmus subspicatus | 0.21–1 |
| Carfentrazone-ethyl | E | 13.9 | Desmodesmus subspicatus | 1.55 |
| Pyrazolynate | F2 | >38.9 | Navicula pelliculosa | 1.0 |
| Pyrazoxyfen | F2 | >1000 | Navicula pelliculosa | 63.2 |
That is, a specific species is not always the most sensitive species, and one standard organism (e.g., D. magna or P. subcapitata) does not represent aquatic communities in terms of sensitivity. The above drawback concerning the most-sensitive-species approach has been argued for over 20 years.38) Instead, a species-battery approach,39) which combines species to represent an aquatic community, is essential to properly assess the effect of pesticides that have a wide variety of species sensitivities.
3. Validation of standard 5 speciesThe minimum data number for SSD analysis in the present study was set to 5. However, requirements of data number for SSD analysis are in the range of 4–10, depending on the responsible organization. Using 5 species data is reasonable at least for practical use according to the following reports. The OECD32) suggested a minimum dataset of 5 different species. TenBrook et al.40) reviewed the required number of samples for SSD analysis and concluded that a sample size of 5 was the minimum needed for applying parametric SSD analysis. Furthermore, 5 standard aquatic plant species (4 microalgae and 1 duckweed) used for pesticide registration in the United States were considered a reasonably representative dataset for estimating the HC5 of an aquatic plant community.41)
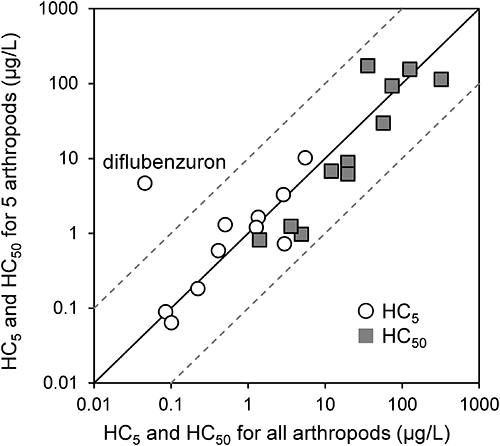
To validate the SSD analysis using a data number of 5, SSDs using all available toxicity data were compared with SSDs using 5 genera toxicity data. The following 11 insecticides were used for the comparisons because these insecticides have a sufficient amount of data (>10, Table 1): fenobucarb, fenitrothion, fenthion, phenthoate, diazinon, fipronil, etofenprox, imidacloprid, cartap, diflubenzuron, and chlorantraniliprole. The toxicity data on the water flea Daphnia, the amphipoda Hyalella, the freshwater shrimp Paratya, the chironomid Chironomus, and the caddisfly Cheumatopsyche were used for SSD analysis using 5 genera data because these 5 genera data were available for all 11 insecticides. The comparisons showed similar HC5 and HC50 values between SSDs using all data and 5 genera data, with the exception of HC5 for diflubenzuron (Fig. 5). Diflubenzuron inhibits chitin biosynthesis and therefore has high toxicity to crustacean and short life-cycle aquatic insects such as Aedes and Culex (Diptera) but has low acute toxicity to long life-cycle aquatic insects such as the caddisfly Cheumatopsyche (Trichoptera), as indicated in Supplemental Table S1. Therefore, for some insect growth regulators, prolonged acute toxicity testing (by transferring the test animals to clean water after 48–96 hr exposure and continuing the observations) is suggested to adequately understand the delayed effect.20) When only toxicity data for crustacean and Diptera insect species were used for SSD analysis, the values of HC5 and HC50 for diflubenzuron were 0.15 and 5.0 µg/L, respectively. These are substantially different from the HC5 of 0.046 µg/L and HC50 of 74 µg/L derived from the original SSD analysis (Table 1). These remain an issue to be considered. However, the inconsistency of HC5 for diflubenzuron was not an issue concerning the data number for SSD analysis but an issue about the toxicity test method. Consequently, the results indicate the validity of SSD analysis using 5 genera data for a wide range of MoA pesticides with some limitations (insect growth regulators).
The SSD approach of this study can be applied to both developing registration criteria (Fig. 1, arrow 1) and post-registration study (Fig. 1, arrow 2). The uncertainty factor approach has been used to fill in the gaps of species sensitivity differences for registration criteria. However, the use of data for only D. magna and an uncertainty factor of 10 for insecticides will lead to underestimation of the ecological effect of insecticides with MoAs 2B, 4A, and 5 (Fig. 3). Dividing the EC50 of D. magna by an uncertainty factor of 10,000 would be necessary to prevent an acute effect on arthropod species. Similarly, dividing the EC50 of the green alga P. subcapitata by an additional uncertainty factor of 10 for herbicides with MoAs B, E, and F2 would be necessary to prevent an acute effect on algal species (Fig. 3). However, there are cases of excessively strict assessment for other MoA pesticides when uncertainty factors of 10,000 for insecticides and 10 for herbicides are equally applied. The development of MoA-specific uncertainty factors may be useful to reduce the overestimation of risk. Otherwise, the SSD approach is substantially more useful. Recently, the European Food Safety Authority published new guidance document on pesticide risk assessment for aquatic organisms.20) In their guidance, a tiered approach from simple standard toxicity tests with a large uncertainty factor (tier-1) to more realistic effect assessment with a lower uncertainty factor (SSD for tier-2B and microcosm/mesocosm for tier-3) was adopted to tackle the above issue of species sensitivity differences. The adoption of higher-tier effect assessment should also be considered in the Japanese risk assessment scheme.
The SSD application to pesticides requires consideration of the relationship between the MoA and the sensitive taxonomic group. Generally, arthropods and primary producers are taxonomic groups sensitive to insecticides and herbicides, respectively (Fig. 2). However, the sufficient number of algal toxicity data is hardly available. Moreover, there are some exceptions such as MoA O herbicides (action like indole acetic acid), which have low toxicity to algae but high toxicity to aquatic vascular plants.20) For those herbicides, SSD analysis using macrophyte toxicity data is suggested. Therefore, filling the data gap in an efficient and economical way would be essential to enhance the SSD application.3,42)
Monitoring the actual environmental concentration of pesticides and risk assessment after registration is also important for risk management. Quantification of the ecological risk of pesticides using SSD as the PAF provides a useful tool for risk management. Quantitative comparison of several risks allows evaluation of the effectiveness of risk reduction measures such as the reduction of pesticide use, the changing of pesticides to those of lower toxicity, and the prevention of pesticide runoff into rivers. One of the most important limitations of SSD application is the lack of sufficient toxicity data for SSD analysis. However, this study determined the SSD parameters of 68 pesticides covering a wide range of paddy pesticides commonly used in Japan. Therefore, future application of SSDs for ecological risk assessment and management of pesticides is expected to increase.
This research was supported by the sponsored research “Technical development of aquatic ecological risk assessment of pesticides” by the Ministry of the Environment, Japan.