Abstract
Comparative experiments investigating the dissipation of four nursery-box-applied pesticides and three foliar-applied pesticides were conducted using lysimeters and in actual paddy fields. In the lysimeter experiments, there were test plots for submerged application for both application types. Analytical concentrations of the pesticides in paddy water were evaluated using appropriate kinetic models. The detection levels of pesticides in the paddy water for the nursery-box and foliar applications were 10–77% and 42–79% of the submerged application, respectively. The times required for 50% dissipation (DT50s) in case of the nursery-box and foliar applications were 0.8–10.4 days and 0.5–2.7 days, respectively. Although overall dissipations were affected by the physicochemical properties of the pesticide and the experimental design in the test plots, the initial detection levels in the lysimeters, governed by the runoff at transplanting and the deposition at spraying, were comparable with those in the actual paddy fields.
Introduction
In our previous report,1) the performance of the flooded lysimeter (hereafter denoted as lysimeter) was compared with that in the actual paddy field involving the submerged application of granular formulations. The results indicated that the current experimental design of the lysimeter could reproduce nearly 50% of the decrease rate of granular pesticides used under actual paddy field conditions, although significant differences in the maximum concentrations were observed owing to variations in hydrological and meteorological factors. In actual paddy cultivation, paddy herbicides are mostly applied as submerged condition, while nursery-box and foliar applications are commonly used for the treatment of paddy insecticides and fungicides as ground applications.2) According to the Niigata Plant Protection Association,3) liquid pesticide formulations are mainly used for foliar application and granular formulation is designed for nursery-box application. In 2016, foliar application and granular formulation shared 58% and 26% of the total area of pest control, respectively.3) Furthermore, nursery-box application and foliar application have been considered the standard scenarios for aquatic environmental risk assessment in Japan.4) For these reasons, it is important to acquire knowledge about pesticide dissipation under the nursery-box and foliar application scenarios to evaluate the experimental performance of the lysimeter simulation of actual conditions in paddy fields.
The nursery-box application of pesticides has been practiced since the 1970s5) and has been a key measure for early pest control in conventional rice cultivation as mechanical transplanting gained popularity in monsoon-dependent Asian countries.6) The fate and transport of nursery-box-applied pesticides in paddy fields have been extensively investigated.5–7) In recent years, the at-sowing treatment method for reducing the concentration of pesticide in paddy water has been developed.8) In contrast, foliar application of pesticides is used to prevent blast disease and control pests such as the planthopper and leafhopper near the mid-stage of rice cultivation by spraying on rice foliage. In conventional rice cultivation, foliar application is accomplished with a boom sprayer.9) For applying the chemicals in the lysimeter studies, Thuyet et al.10) investigated the fate and transport of nursery-box-applied imidacloprid in the micro-paddy lysimeters under different treatment methods, while Phong et al. simulated the tricyclazole wash-off from rice foliage under artificial and natural rainfall conditions by using micro-paddy lysimeters and outdoor lysimeters.11,12) Although such procedures could be used to simulate the dissipation of pesticides, there is still controversy regarding the differences in application procedures used in the lysimeter and actual paddy fields. According to the Japanese test guidelines for pesticide registration13) the test substance used in the lysimeter experiment should be applied as specified in the registration documents. However, alternative application methods can be used when it is difficult to use conventional application tools such as the transplanting machine and the boom sprayer in the experimental facility. To our knowledge, no study has compared the pesticide dissipation pattern between the lysimeter and paddy fields based on this point of view.
The objective of this study was to investigate the dissipation characteristics of various paddy pesticides in nursery-box application and foliar application in the lysimeters tested using alternative application methods and in the paddy fields based on conventional practices. The experiments were performed simultaneously for four years, with continuous monitoring of the dissipation of paddy pesticides in the lysimeters and paddy fields. The fundamental description of the experiments involving the lysimeters and paddy fields, the analytical methods, and data processing can be found in the previous report.1)
Materials and Methods
1. Overview of experimentThe four-year continuous experiments were conducted using lysimeters and in paddy fields containing two different soil types, but with the same application day and sampling schedule, from 2012 to 2015. For the lysimeter experiments, the outdoor lysimeters (1 m×1 m×1 m) installed at the Institute of Environmental Toxicology (IET, Ibaraki, Japan) were used. Five sets of lysimeters packed with gray lowland soils (alluvial soil) and wet andosols (volcanic ash soil) were available for the experiments. All lysimeters were covered with roof panels for the penetrating UV radiation to prevent unintentional overflow. The daily percolation rate could be adjusted by pumping the percolating water from the underdrain. For the field experiments, two experimental paddy fields of the Japan Association for Advancement of Phyto-Regulators (JAPR, Ibaraki, Japan) containing alluvial and volcanic ash soils, were selected and labeled as the FA and FV plots, respectively. The surface area of each paddy field was 800 m2, and each was surrounded by soil levees covered with polyvinyl chloride boarders. The daily water management in the lysimeters and the paddy fields was based on the guidelines published by the Ministry of Agriculture, Forestry and Fisheries of Japan.13) The nursery-box and foliar applications were performed in 2013–2014 and 2015, respectively. Note that the experiment in 2012 was conducted under a submerged application scenario, and some of the results were reported in the previous report.1) Table 1 lists the commercial products, their active ingredients, application date, rates, and the theoretical maximum concentration of pesticides (Cmax), which was defined as all pesticides were dissolved in paddy water with 5 cm ponding depth. Detailed explanations of the experimental conditions and test-plot designs are available in the previous report.1)
Table 1. Formulation, application method and theoretical maximum concentrations of target pesticides
| Year | Date of application | Application method | Formulation product, Applicate rate | Pesticides [Metabolite] | Cmaxa) (mg/L) |
|---|
| 2013 | 4-June | Nursery-box | DR. ORYZE® PRINCE® GR, 1 kg/10 a | Fipronil | 0.12 |
| Lysimeter; 10:00–10:30 | Probenazole | 4.8 |
| Field; 10:30b), 12:00c) | | |
| 2014 | 10-June | Nursery-box | ARASHI® DANTOTSU® GR, 1 kg/10 a | Clothianidin | 0.3 |
| Lysimeter; 10:00–10:30 | Orysastrobin [5Z-orysastrobin] | 1.4 |
| Field; 10:30b), 14:00c) |
| 2015 | 15-July | Foliar | DANTOTSU® FL, 5000 hold, 150 L/10 a | Clothianidin | 0.12 |
| Lysimeter; 10:00–10:30 | AMISTAR® EIGHT FL, 1000 hold, 150 L/10 a | Azoxystrobin | 0.24 |
| First application | APPLAUD® FL, 1000 hold, 150 L/10 a | Buprofezin | 0.6 |
| Field; 11:00b), 12:00c) | | | |
| Second application | | | |
| Field; 14:00b), 15:00c) | | | |
a) Theoretical maximum concentration defined as applied pesticide is dissolved in paddy water with 5 cm ponding depth. b) Application time at alluvial soil paddy field (FA Plot). c) Application time at volcanic ash soil paddy field (FV Plot).
2. Nursery-box application
2.1. Plot design and application method for lysimeterIn 2013, a set of lysimeters with a conventional experimental design was treated by nursery-box application and labeled as LA-S for the alluvial soil plots and LV-S for the volcanic ash soil plots. In 2014, two sets of lysimeters, one for the same treatment plot as in 2013 (LA/LV-S plots) and the other for bare ground (without rice plants) plots with submerged application labeled as the LA/LV-B plots, were prepared to compare the behaviors of pesticides applied via submerged and nursery-box applications.
Rice seedlings were grown in a nursery box (30 cm×60 cm) packed with ca. 3 cm of soil and by watering appropriately until pesticide application. On the day of pesticide application, a plot section of rice seedlings in soil (30 cm×7.5 cm) was cut and subdivided into two portions (5 cm×7.5 cm) by cutting both ends of the long side for the alluvial and the volcanic ash soil plots. Each portion was further divided into 25 parts (ca. 1 cm×1.5 cm each) containing two or three rice seedlings per part and transferred to containers made of aluminum foil. An appropriate amount of pesticide formulation was applied to the soil surface, and the pieces of the rice seedlings were hand-transplanted under a flooded condition at a transplanting depth of 3–4 cm in the LA/LV-S plots. The formulation product that remained in the container was assumed to be the runoff from the nursery box and was applied as a submerged application by washing the container with paddy water. The amounts of formulation product for the LA/LV-B plots were directly applied in the submerged conditions in the same manner as other granular formulation products are usually applied.1)
2.2. Application method for paddy fieldsFor the field experiment, the nursery boxes were prepared using a ratio of 20 boxes for 10 a of a paddy field. The formulation products were used at the recommended application rates and were applied to the nursery box prior to transplantation. Care was taken not to add water after pesticide application. The rice seedlings were transplanted using a rice transplanting machine at a planting density of 18.1 plants/m2 and a spacing of 16 cm×30 cm (between plants×between rows) under flooded conditions. Because of the aforementioned transplanting condition, a deeper transplanting depth of 5–6 cm for the FA/FV plots and both years was set. Twenty-four plastic containers were installed to construct the scaffolds used for the sampling. Daily observations were recorded for each paddy field after application and continued periodically.
3. Foliar application
3.1. Plot design and application method for lysimeterFor the foliar application in the lysimeter in 2015, three sets of lysimeters were used to vary the experimental conditions with respect to the application method and artificial percolation. The former was confirmed in the plots by spraying water on the surface (labeled as LA/LV-S plots) and by applying to the rice foliage (labeled as LA/LV-F plots). The latter was done by comparing the LA/LV-S plots with the zero-percolation plots (labeled as LA/LV-Z plots), indicating that application method was same but percolating water was not collected.
On the day of application, the mixture of three flowable formulations was prepared accordingly (see Table 1) by diluting with purified water obtained from a PURELAB Flex System (Veolia Water Solutions & Technologies, Saint-Maurice, France). The aliquots of the mixture were sprayed (150 mL/plot) on the surface of paddy water in the LA/LV-S plots and the LA/LV-Z plots using an electric gardening sprayer (BH-565B, National, Osaka, Japan). The remaining solution in the sprayer was diluted by purified water and sprayed. For the application at the LA/LV-F plots, a simple spray chamber made of a polyvinyl chloride pipe covered with plastic sheets was placed in each test plot to prevent spray drift to the other test plots. The aliquots of the mixture were sprayed on the rice foliage from the upper side of the spray chambers. Care was taken to ensure that the mixture remaining in the plastic sheets of the spray chambers post-application did not wash in to the test plots.
3.2. Application method for paddy fieldsThe mixture of the three flowable formulations was prepared by diluting them with tap water as described above. The aliquot of the mixture (120 L/plot) was transferred to the tank powered by a gasoline engine. A two-wing boom sprayer with 20 nozzle heads (Yamaho Industry Co. Ltd., Wakayama, Japan) was connected to the tank, and the mixture was sprayed by traversing the center of the field for a certain period of time.
4. Sampling and chemical analyses
The sampling and chemical analyses of paddy water in the lysimeters and the paddy fields were conducted similarly and as described in the previous report.1) Briefly, the acidified water samples were cleaned by solid-phase extraction and concentrated to prepare the final test solution. The amounts of target pesticides for samples from each year were simultaneously determined using a liquid chromatograph with mass spectrometry (LC/MS) system (1100 series, Agilent Technologies, Santa Clara, CA, USA) or a tandem (LC-MS/MS) system (ACQUITY UPLC and Quattro Premier XE, Waters Corporation, Milford, MA, USA). The limits of quantification (LOQs) for nursery-box-applied pesticides were set at 0.0001 mg/L for 2013 and at 0.0005 mg/L for 2014. The LOQs for the pesticides used in foliar applications were set at 0.001 mg/L. The recovery tests at the three concentration levels (LOQ, 50× LOQ, and the expected highest concentration in paddy water) were determined using blank paddy water collected from the lysimeter (n=3 for each soil) and all of the results were confirmed to be within the acceptable range (mean recoveries: 74–113% and relative standard deviations (RSDs)<13%).
5. Data analysis
Assuming the nursery-box-applied pesticides were released to paddy water from the transplanting holes,8,10) the analytical concentrations for these pesticides were fitted to the single first order coupled with release phase (SFOR) model14) used in the previous study.1) The integrated form of the SFOR model is given as
 | (1) |
where, Ct is the concentration of pesticide in the paddy water at time t, Cdiss is the dissolved concentration of pesticide, kr is the release rate from the granule, and ke is the decrease rate in paddy water. The fitting was performed using the nonlinear least square methods. The fitted results between the test plots with similar soil types were subjected to the grouping analyses by comparing the parameters of the SFOR model and using a one-way analysis of variance.15) In addition to the visual assessment, the goodness of fit for the final model was evaluated using a statistical measure, the χ2 error estimated as16)
 | (2) |
where, χ2tab is the tabulated χ2 value with m degree of freedom at the 5% significance level, S is the simulated value, O is the observed value, and Ō is the mean of all observed values.
The pesticides used in the foliar application were expected to show their maximum immediately after application, and therefore, the analytical concentrations for these pesticides were fitted to the single first order (SFO) model or the hockey-stick (HS) model, recommended in water-sediment studies,16) depending on the decreasing pattern. The integrated form of the SFO model is
 | (3) |
where, C0 is the initial concentration and k is the decrease rate in paddy water. Similarly, the HS model is given as
 | (4) |
where, k1 is the decrease rate in paddy water until t=tb, k2 is the dissipation rate in paddy water from t=tb and tb, is the breakpoint at which the rate constant changes. The criterion for model selection was based on our testing of the SFO model. It was chosen as the final model when the χ2 error was below 15% and the fitted result was visually acceptable. When the fitted result based on the SFO model was unacceptable, we replaced it with the HS model. All datasets were directly fitted to the kinetic models using the nonlinear fitting routines as described above rather than by applying the logarithmic transformation, as it makes the data weighted when the concentration levels decrease, leading to underestimation of the initial concentration.16) The handling of the data including a value below the LOQ was according to the FOCUS (FOrum for Co-ordination of pesticide fate models and their USe) recommendation.16)
The rates of dissipation for the final models were converted to the time required for 50% dissipation (DT50). All analyses were performed using the statistical software R (ver.3.4.2, R Foundation for Statistical Computing). For the analyses of orysastrobin including the metabolite as a target analyte, the total concentration was calculated as a sum of the parent compound and its metabolite based on the mass of the parent compound (expressed as “Total orysastrobin”).
Results
1. Test plot conditionsTable 2 summarizes the days of the nursery-box application and foliar application in the individual test plots. In the nursery-box application with lysimeters in 2013 and 2014, small amounts of applied granules were runoff via hand transplanting and were visible on the soil surfaces around the transplanting hole. Furthermore, the transplanting holes were not sufficiently buried due to little disturbance from hand transplanting. In 2013, the levels of paddy water in both paddy fields were reduced beforehand and were later increased to the appropriate levels after transplanting. However, in 2014, it rained on the day before transplanting, which precipitation totals of 4.4 and 1.5 cm in the FA and FV plots, respectively. Thus, transplanting in 2014 was done in deeper water, particularly for the FV plot. Since the paddy water in both paddy fields was muddy after transplanting, the granules and the transplanting holes were invisible.
Table 2. Conditions of lysimeters and paddy fields at application
| Lysimeters | Paddy fields |
|---|
| Nursery-box application (2013, 2014) | |
| Variety of rice | Koshihikari |
| Crop height at application (cm) | 10–13 |
| Crop age at application(days-old)a) | 18, 19b) | 15, 19b) |
| Transplanting density (plants/m2) | 25.0 | 18.1 |
| Transplanting depth (cm) | 3–4 | 5–6 |
| Foliar application (2015) | |
| Variety of rice | Koshihikari |
| Crop height at application (cm) | 65–70 | 52–54 |
| Days from transplanting to application (day) | 47 | 47 |
| Transplanting density (plants/m2) | 25.0 | 18.1 |
| Water depth at application (cm) | 5.0 | 2.4, 6.6c) |
| Average wind velocity at application (m/s) | 2.6 | 4.5, 3.3c) |
a) Days after sowing. b) The former is 2013 and the latter is 2014. c) The former is the FA plot and the latter is the FV plot.
The foliar applications were conducted 47 days after transplanting. The crop heights in the lysimeters were higher than those in the paddy fields (Table 2). On the day of application in 2015, windy conditions prevailed both near the lysimeters and in the paddy fields (Table 2). In addition, rainfall up to 0.3 cm was received during the application in the FA plot. Foliar applications in the FA and FV plots were done twice using 40 and 80 L of the formulation and at 0 and 3 hr to account for treatment errors (see Table 1). For this reason, additional water sampling at the FA and FV plots was performed at 6 hr after the first application (0.25 days after treatment, DAT).
During the experiments, water levels in the lysimeters were maintained at constant levels (5 cm) with the recommended percolation rate (1–2 cm/day). No outflow was observed during any of the test years. In the paddy fields, two or three major rainfall events (greater than 1 cm) were observed per year. In 2014 and 2015, both paddy fields experienced major rainfall events at early periods after application (1 to 3 DAT). Table 3 shows the variations in water level in the FA and FV plots throughout the experimental period. Although there was no surface runoff event in the study period, water levels in the paddy fields fluctuated. Details on the hydrological conditions in the individual test plots are summarized in Table 3 of the previous report1) and supplemental Table S7 and Fig. S2 here.
Table 3. Variations of water levels at paddy fields during the experiments
| 2012 | 2013 | 2014 | 2015 |
|---|
| FA Plot | FV Plot | FA Plot | FV Plot | FA Plot | FV Plot | FA Plot | FV Plot |
|---|
| Average (cm) | 4.4 | 5.4 | 6.4 | 5.5 | 6.3 | 5.0 | 4.0 | 5.9 |
| CVa) (%) | 27 | 31 | 25 | 16 | 38 | 16 | 30 | 19 |
a) Coefficient of variation.
2. Pesticide dissipations in the lysimeters and paddy fields
2.1. Nursery-box-applied pesticidesThe analytical concentrations of the pesticides fipronil and probenazole, applied in 2013, in the paddy water are shown in Fig. 1. The concentration of fipronil in all test plots was at the maximum (Cobs-max) at 0.125 DAT. The relative maximum concentrations (Crmax-obs), defined as the ratio of the Cobs-max to the Cmax (Table 1), were 18% and 17% in the LA-S and LV-S plots and 6% and 7% in the FA and FV plots, respectively. The concentrations of fipronil rapidly decreased and reached 1–5% of their maximum equivalent to the LOQ level or below in all test plots at 21 DAT. For probenazole, no clear dissipation curve could be obtained in any test plot. The concentration of probenazole was intermittently obtained at the levels of LOQ–30× LOQ (0.06% as the Crmax-obs).
The analytical concentrations of clothianidin, total orysastrobin and its parent and metabolite basis in paddy water applied in 2014 are shown in Fig. 2. The Cobs-maxs of clothianidin were obtained at 0.125 to 1 DAT. The Crmax-obss of clothianidin were 54% and 38% in the LA-B and LV-B plots, both at 10% in the LA-S and LV-S plots, and 14% and 11% in the FA and the FV plots, respectively. The concentrations of clothianidin rapidly decreased to 0-2% of the Cobs-maxs. While the Cobs-maxs of total orysastrobin in the lysimeters were obtained at 2 to 3 DAT, those in the paddy fields were obtained at 10 to 14 DAT. The Crmax-obss of total orysastrobin were 21% and 23% in the LA-B and LV-B plots, 6% and 4% in the LA-S and LV-S plots, and 11% and 6% in the FA and FV plots, respectively. (5Z)-orysastrobin, a major metabolite of orysastrobin, was detected at 0.125 DAT in all test plots and the concentrations tended to be higher in the paddy fields, which were comparable with those in the LA-B and LV-B plots. At 21 DAT, while the concentrations of total orysastrobin in the lysimeters reached 5–12% of the Cobs-maxs, those in the paddy fields were at 48–52%.
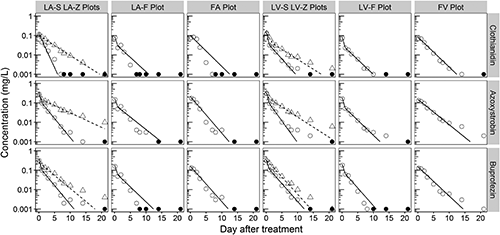
2.2. Pesticides for foliar applicationThe analytical concentrations of clothianidin, azoxystrobin and buprofezin applied in 2015 in paddy water are shown in Fig. 3. The Cobs-maxs of three pesticides were detected at 0.125 DAT for the lysimeters and at 0.25 DAT for the paddy fields, except for clothianidin in the FA plot, which was detected at 1 DAT (the difference was only 10% of that at 0.25 DAT). The Crmax-obss of clothianidin, sprayed on the water surface of the LA/LV-S and LA/LV-Z plots were 97%/107% and 83%/106%, respectively, while those for the rice foliar sprays in LA/LV-F and FA/FV plots were 64%/62% and 69%/58%, respectively. Similarly, the Crmax-obss of azoxystrobin in the LA/LV-S and LA/LV-Z plots were 119%/127% and 104%/124%, respectively, while those for the LA/LV-F and FA/FV plots were 62%/68% and 73%/56%, respectively. Finally, the Crmax-obss of buprofezin in the LA/LV-S and LA/LV-Z plots were 53%/50% and 44%/30%, respectively, while those for the LA/LV-F and FA/FV plots were 26%/30% and 22%/21%, respectively. Comparing the lysimeters and the paddy fields, the maximum concentrations in the paddy fields were 0.9–5.2 times the values obtained from the lysimeters. The concentrations of the three pesticides in the lysimeters pumping the percolating water (LA/LV-S and LA/LV-F plots) and the paddy fields reached 0–1% of the Cobs-maxs, which either equaled the LOQ levels or were lower. The concentrations of clothianidin and buprofezin in the LA/LV-Z plots also decreased to 0–4% of the Cobs-maxs, and azoxystrobin oddly remained at the 6–10% level of LOQ.
3. Kinetic analysis
The predicted concentrations simulated by the final SFOR models processed via the grouping analysis for the nursey-box-applied pesticides are shown in Figs. 1 and 2. The estimated χ2 errors and DT50s from the final model are summarized in Table 4. It is worth noting that kinetic analyses of probenazole were not conducted, since no dissipation curve was observed in any of the test plots. The groupings of the parameters were successful for the kr of fipronil for all test plots, ke of clothianidin between the LV-S and FV plots, and ke of total orysastrobin between all test plots for the alluvial soils and the LV-S and FV plots. The number the χ2 error below 15% threshold value—passing the χ2 test at 5% of significance level—was 11 of 18 analyses. The estimated DT50s were shorter for the nursery-box-applied fipronil and clothianidin than for those under bare application. Contrasting results were obtained for total orysastrobin.
Table 4. Summary of kinetic analyses for pesticides under nursery-box application case
| Pesticide | | LA-S Plot | LA-B Plot | FA Plot | LV-S Plot | LV-B Plot | FV Plot |
|---|
| Fipronil | Cdiss | 0.023 | — | 0.008 | 0.009 | — | 0.023 |
| kr | 216 | — | 216 | 254 | — | 216 |
| ke | 0.61 | — | 0.83 | 0.71 | — | 1.13 |
| DT50 (d) | 1.1 | — | 0.8 | 1.0 | — | 0.6 |
| χ2 err (%) | 14.0 | — | 17.0 | 12.3 | — | 25.0 |
| Clothianidin | Cdiss | 0.042 | 0.232 | 0.048 | 0.033 | 0.141 | 0.042 |
| kr | 7.30 | 4.99 | 2.86 | 196 | 14.1 | 13.4 |
| ke | 0.45 | 0.24 | 0.39 | 0.53 | 0.39 | 0.53 |
| DT50 (d) | 1.5 | 2.9 | 1.8 | 1.3a) | 1.8 | 1.3a) |
| χ2 err (%) | 8.6 | 6.5 | 13.5 | 7.0 | 7.4 | 5.9 |
| Total orysastrobin | Cdiss | 0.092 | 0.412 | 0.316 | 0.052 | 0.516 | 0.093 |
| kr | 0.81 | 0.05 | 0.99 | 6.98 | 0.62 | 0.19 |
| ke | 0.11 | 0.11 | 0.11 | 0.07 | 0.16 | 0.07 |
| DT50 (d) | 6.4a) | 6.4a) | 6.4a) | 10.4a) | 4.4 | 10.4a) |
| χ2 err (%) | 12.3 | 6.6 | 24.1 | 17.7 | 11.4 | 16.9 |
Probenazole was not subjected to the kinetic analysis because no apparent decrease of concentration was observed during the experiment.
a) Estimated DT50 was derived from grouped parameter of ke.
The predicted concentrations of clothianidin, azoxystrobin, and buprofezin simulated by the SFO model or the HS model are presented in Fig. 3, and the estimated measures of the fitted models are summarized in Table 5. It is noteworthy that all of the breakpoints (tbs) except for clothianidin in the LV-Z plot were fixed at 1.0 due to parameter convergence in the fitting process of the HS model for the foliar application data. Among the 24 analyses, 10 were used for the SFO model, and the rest were used for the HS model. In total, the χ2 errors of 20 analyses were below 15%. While the DT50s estimated from the SFO model ranged between 0.9 and 2.7 days, they were within 1.1 days when the HS model was used.
Table 5. Summary of kinetic analyses for pesticides under foliar application case
| Pesticide | | LA-S Plot | LA-Z Plot | LA-F Plot | FA Plot | LV-S Plot | LV-Z Plot | LV-F Plot | FV Plot |
|---|
| Clothianidin | Model | SFO | SFO | HSa) | SFO | HSa) | HS | HSa) | SFO |
| C0 | 0.125 | 0.105 | 0.089 | 0.099 | 0.156 | 0.137 | 0.087 | 0.084 |
| k, k1 | 0.80 | 0.26 | 1.11 | 0.37 | 1.58 | 0.61 | 1.31 | 0.36 |
| k2 | — | — | 0.34 | — | 0.41 | 0.23 | 0.35 | — |
| tb (day) | — | — | 1.0 | — | 1.0 | 2.1 | 1.0 | — |
| DT50 (day) | 0.9 | 2.7 | 0.6 | 1.9 | 0.4 | 1.1 | 0.5 | 1.9 |
| χ2 err (%) | 14.2 | 5.5 | 20.1 | 26.6 | 2.5 | 3.7 | 3.7 | 14.4 |
| Azoxystrobin | Model | HSa) | HSa) | HSa) | SFO | HS | HSa) | HSa) | SFO |
| C0 | 0.334 | 0.270 | 0.169 | 0.209 | 0.361 | 0.324 | 0.190 | 0.153 |
| k, k1 | 1.24 | 0.61 | 1.02 | 0.43 | 1.38 | 0.69 | 1.26 | 0.30 |
| k2 | 0.45 | 0.17 | 0.30 | — | 0.52 | 0.24 | 0.36 | — |
| tb (day) | 1.0 | 1.0 | 1.0 | — | 1.0 | 1.0 | 1.0 | — |
| DT50 (day) | 0.6 | 1.5 | 0.7 | 1.6 | 0.5 | 1.0 | 0.5 | 2.5 |
| χ2 err (%) | 2.4 | 4.4 | 20.0 | 14.5 | 2.9 | 6.3 | 4.1 | 9.0 |
| Buprofezin | Model | HSa) | SFO | HSa) | SFO | HSa) | SFO | HSa) | SFO |
| C0 | 0.376 | 0.258 | 0.182 | 0.157 | 0.347 | 0.341 | 0.208 | 0.153 |
| k, k1 | 1.33 | 0.31 | 1.15 | 0.42 | 1.15 | 0.41 | 1.14 | 0.35 |
| k2 | 0.45 | — | 0.36 | — | 0.40 | — | 0.45 | — |
| tb (day) | 1.0 | — | 1.0 | — | 1.0 | — | 1.0 | — |
| DT50 (day) | 0.5 | 2.3 | 0.6 | 1.7 | 0.6 | 1.7 | 0.6 | 2.0 |
| χ2 err (%) | 2.5 | 10.8 | 15.7 | 13.7 | 4.9 | 5.2 | 9.2 | 16.2 |
SFO: single first order model. HS: hockey-stick model. a) Fitted with fixed breakpoint tb equal to 1.0 day.
Discussion
1. Dissipation characteristics of nursey-box-applied pesticidesFigure 4 (a) shows the relative maximum concentrations (Crmax-mods) of the nursery-box-applied pesticides calculated from the Cdisss of the final SFOR model and the Cmaxs. The Crmax-mods for nursery-box-applied fipronil, clothianidin, and total orysastrobin ranged between 4% and 23%. These values were comparable with those of imidacloprid in the before-transplanting scenario for the micro paddy lysimeter (14.5%)10) and the paddy field (4.3%).8) When comparing the different applications in 2014, the detection levels of the nursery-box-applied clothianidin and total orysastrobin excluding total orysastrobin in the FA plot for submerged applications were 10-30% of those of the LA/LV-B plots. These results were comparable with the cases of imidacloprid (approx. 30%) and probenazole (approx. 10%)2) and were higher than the case of isoprothiolane (0.8–2.3%)17) when compared with the nursery-box application and submerged application at different application timings. The Crmax-mod of total orysastrobin in the FA plot was oddly high and was 77% of that of the LA-B plot. As shown in Fig. 2, the release rate of total orysastrobin from the transplanting hole was slower than that seen with clothianidin co-formulated with the same granular product. Owing to deeper transplanting, the release rate of orysastrobin was lower, and the dissolved mass was partitioned to the paddy water because of the low percolation rate in the FA plot (0.06 cm/day) and low soil adsorption of orysastrobin (KOC=18–150).18) Based on the aforementioned results, the detection levels of nursery-box-applied pesticides became complex, depending on the formulation types, the field conditions and the physicochemical property of the active ingredient.
In 2013, biphasic dissipation of fipronil was observed in all of the test plots. While the observed concentrations of fipronil were initially well described by rapid first-order dissipation curves obtained from the SFOR models, those after 5 DAT were gradually placed above the curves. According to Thuyet et al.,19) the photodegradation half-life of fipronil was 36.7 hr in the paddy water at ambient temperature. Therefore, the initial fast dissipation phase could be attributed to photodegradation. Although fipronil has been known to be relatively mobile in soils,20) Doran et al.21) reported that more than 70% of applied fipronil in soil remained at the top 0–1 cm layer of flooded soil. Thus, the slower fipronil dissipation with increasing elapsed time might be caused by the desorption from the surface soil. As indicated in the previous section, no apparent dissipation curve for probenazole could be obtained in any of the plots. This result was comparable with that of Yi and Lu,22) who also reported that probenazole applied to flooded soil was mostly distributed in the topsoil and rice straw, and that in paddy water was slowly released from the soil but quickly dissipated within a day due to rapid degradation associated with hydrolysis and photodegradation. In 2014, rapid dissipations of clothianidin, similar to those of fipronil, were observed. Although the photodegradation half-lives of clothianidin (14.7–19.4 days) were lower than those of fipronil,23) the concentrations of clothianidin rapidly decreased because it is highly degradable under flooded conditions and due to microbial activity.24) In addition, the slower decrease phase was observed only in the volcanic ash soil plots. In general, the soil adsorptivities of neonicotinoid pesticides such as clothianidin are relatively low (KOC<1000, with few exceptions),25) but that of clothianidin was reported to be proportional to the organic carbon content in soil.26) Therefore, it is possible that clothianidin was uniquely adsorbed by the volcanic ash soil and was subsequently released. The dissipation of total orysastrobin in all test plots was moderate when compared with that of other nursery-box-applied pesticides. Orysastrobin in the paddy field environment simulated in the laboratory experiments is stable during hydrolysis (half-life >1 year) but is rapidly converted to (5Z)-orysastrobin and degraded via the two-step photodegradation (half-life≈2 days).18) The changes in the analytical concentrations of orysastrobin and (5Z)-orysastrobin indicated similar trends, confirming that the environmental fate of orysastrobin was dependent on photodegradation.
2. Dissipation characteristics of foliar-applied pesticides
Figure 4 (b) shows the Crmax-mods of the pesticides used in foliar applications. Compared with the submerged application of granular pesticides with sprayable formulations in paddy water, the foliar samples could be easily detected and ranged from 50 to 150% in the paddy water even for those pesticides with low water solubility, such as buprofezin (0.387 mg/L),27) because the sprayable formulation is designed to disperse the active ingredient via paddy water.28) The Crmax-mods of clothianidin, azoxystrobin and buprofezin in LA/LV-F and FA/FV plots were equivalent to 54–79%, 42–63% and 42–60% of those in the LA/LV-S plots, respectively. Assuming that these values were the deposition ratios in the paddy water caused by the spray drift and crop interception, 56% and 54% of the applied pesticides, on average, would be deposited in the paddy water in the lysimeters and in the paddy fields, respectively. Phong et al. reported that the leaf coverages of rice plants for the ‘Nihonbare’ two months after transplanting ranged from 70 to 80% of the test plots.12) In our case, it was applied 1.5 months after transplanting so that similar coverage conditions could be obtained. According to FOCUS,29) the crop interception efficiencies with intermediate to full canopy coverage for cereal crops range from 0.5 to 0.7. Our results are comparable with these parameters. It is noteworthy that the average wind velocity at the test plots on the day of pesticide application was close to or exceeded the maximum acceptable average wind velocity (3 m/sec) for the drift test published by the Ministry of Environment,30) and therefore, the application conditions in both the lysimeter and paddy fields were regarded as the worst-case conditions.
From Fig. 3, the dissipation curves of three pesticides in the lysimeters were more appropriately simulated using the HS model by amending the breakpoint to 1 rather than using the SFO model. The dissipation curves for those in the paddy fields were all simulated using the SFO model. It is remarkable that the DT50s of the three pesticides in the LA/LV-S and LA/LV-F plots pumping the percolating water were estimated to be below the breakpoint of 1. This may be due to the high convection of the water-soluble and sprayable pesticides downward of the lysimeters, facilitated by high percolation. The dissipation curves of clothianidin in the LV-Z plot, and of azoxystrobin in the LA/LV-Z plots were described using the HS model. Clothianidin showed higher adsorptivity in the volcanic ash soil (KOC=1260) and a higher soil adsorption of azoxystrobin was found in various soils (KOC=486–1022),31,32) especially for the volcanic ash soil (KOC=4500).33) Therefore, these pesticides were considered to be associated with the kinetics of soil adsorption that included the fast and slow phases34) and were rapidly adsorbed in soil during the first phase. For buprofezin, the dissipation curves in the LA/LV-Z plots were approximated by the SFO model despite its high soil adsorptivity (KOC=2230).27,35) However, the Crmax-mods in the LA/LV-S and LA/LV-Z plots were nearly half of those of the other two pesticides. This implies that a bulk of buprofezin was instantaneously partitioned in the soil rather than being subjected to kinetic adsorption. The decrease rates of the three pesticides in the paddy fields were similar to those from the SFO model and those for the second phase of the HS model (Table 5) in the lysimeters. Similar to clothianidin, azoxystrobin and buprofezin in the paddy field environment might be affected by photodegradation or microbial degradation rather than a hydrological factor, such as percolation.27,36)
3. General remarks and future applicationsThis study offers insight not only into the dissipation pattern of paddy pesticides but also into how the detection levels of paddy pesticides vary between the lysimeters and paddy fields, mostly depending on the application methods, such as nursery-box application and foliar application. Simultaneous installation of the test plots for submerged application to bare ground and for spray application to the water surface could help in understanding the fate and transport of pesticides by excluding indirect variables such as transplanting depth and crop interception effects. Furthermore, the simple kinetic analysis incorporated in this study could help in understanding the dissipation patterns. In this approach, the fate and transport processes were simplified to a single or biphasic reaction so that we could deduce the phenomena simply by judging whether the data was above or below the simulated line. For this point, the appropriateness of the model selection and the evaluation procedure are crucial, rather than focusing on a perfect fit.
Application of the mathematical model is the next step in analyzing the data. Iterative runs of the experiment and model evaluations can efficiently improve the experimental design.37) Several modeling approaches have been proposed to simulate the fate and transport of pesticides under nursery-box application and foliar application in paddy fields.38–40) However, these models require various parameters, including site-specific information such as drift ratio at application, which were previously determined based on expert judgment. In order to overcome the over-parameterization of the mathematical model, an efficient calibration routine of the mathematical model to derive the parameters from our experimental data set needs to be developed.
Conclusion
The present study revealed that the nursery-box and foliar application methods in the lysimeter experiments were comparable to those in the actual paddy fields with respect to the initial detection levels of pesticides as a function of runoff from the nursery box at transplanting and deposition via spray drift and crop interception. Meanwhile, the decrease in the concentration of these pesticides due to lower water solubility in the actual paddy field and the lysimeter turned out to be complex problems requiring precision information regarding soil adsorption/desorption properties and their stability in the paddy environment. These are difficult to cover with the simple kinetic model used in this study. From these findings and those in the previous study,1) it appears that in order to simulate the dissipation of the paddy pesticide in the actual paddy field, especially for the nursery-box and foliar application scenarios in the lysimeter experiments, further investigations on the dissipation of paddy pesticides under unified test conditions and their analysis procedures incorporating modeling are needed.
Acknowledgment
This study was conducted as a part of the Continuing Research Project in compliance with the Expenditure Plan for Public Interest Purposes of the Institute of Environmental Toxicology (Corporate code: A012055).
We sincerely thank Dr. Yasuhiro Yogo, Prof. Hisashi Miyagawa, and Prof. Masahiro Natsume of the Advisory Panel on this project for their valuable suggestions, cooperation, and/or technical supports to our study.
References
- 1) K. Kondo, Y. Wakasone, J. Okuno, N. Nakamura, T. Muraoka, K. Iijima and K. Ohyama: J. Pestic. Sci. 44, 48–60 (2019).
- 2) M. Ueji: “Frontiers of Environmental Pesticide Science,” ed. by Pesticide Science Society of Japan, M. Ueji, A. Katayama, K. Nakamura, T. Hoshino and H. Yamamoto, Soft Science, Inc, Tokyo, Japan, pp. 223–338, 2004.
- 3) http://www.niigata-syokubou.or.jp/leaflet/documents/146.pdf (Accessed 10 Oct., 2018)
- 4) http://www.acis.famic.go.jp/eng/shinsei/13-3987.pdf (Accessed 10 Oct., 2018)
- 5) S. Asaka, N. Kawauchi, S. Koyama and K. Emura: J. Pestic. Sci. 3, 305–310 (1978), (in Japanese).
- 6) S. Kurogochi: “Environmental Fate and Effects of Pesticides,” ed. by J. R. Coats and H. Yamamoto, American Chemical Society, Washington, DC, pp. 139–156, 2003.
- 7) T. K. Phong, D. T. T. Nhung, T. Motobayashi, D. Q. Thuyet and H. Watanabe: Water Air Soil Pollut. 202, 3–12 (2008).
- 8) D. Q. Thuyet, H. Watanabe and T. Motobayashi: J. Pestic. Sci. 36, 9–15 (2011).
- 9) Y. Yamamoto, T. Ohtani, K. Arihara and T. Matsumaru: Bull. Chiba Agric. Res. Cent. 2, 61–67 (2003).
- 10) D. Q. Thuyet, H. Watanabe, K. Takagi, K. Yamazaki and D. T. T. Nhung: J. Pestic. Sci. 37, 20–27 (2012).
- 11) T. K. Phong, D. T. Nhung, K. Yamazaki, K. Takagi and H. Watanabe: Bull. Environ. Contam. Toxicol. 80, 438–442 (2008).
- 12) T. K. Phong, D. T. Nhung, K. Yamazaki, K. Takagi and H. Watanabe: Chemosphere 74, 1085–1089 (2009).
- 13) http://www.acis.famic.go.jp/eng/shinsei/8147annex.pdf (Accessed 10 Oct., 2018)
- 14) O. Richter, B. Diekkrüger and P. Nörtersheuser (eds.): “Environmental fate modelling of pesticides: from the laboratory to the field scale,” VCH, Weinheim, New York, 1996.
- 15) “Nonlinear Regression with R,” ed. by C. Ritz and J. C. Streibig, Springer New York, NY, pp. 109–131, 2008.
- 16) FOCUS: “Guidance Document on Estimating Persistence and Degradation Kinetics from Environmental Fate Studies on Pesticides in EU Registration,” Report of the FOCUS Work Group on Degradation Kinetics, EC Document Reference Sanco/10058/2005 version 2.0, 2006.
- 17) K. Inao, T. Iwafune, T. Horio and I. Kitayama: J. Pestic. Sci. 43, 132–141 (2018).
- 18) http://www.acis.famic.go.jp/syouroku/orysastrobin/index.htm (Accessed 10 Oct., 2018)
- 19) D. Q. Thuyet, H. Watanabe, K. Yamazaki and K. Takagi: Bull. Environ. Contam. Toxicol. 86, 548–553 (2011).
- 20) A. S. Gunasekara, T. Truong, K. S. Goh, F. Spurlock and R. S. Tjeerdema: J. Pestic. Sci. 32, 189–199 (2007).
- 21) G. Doran, P. Eberbach and S. Helliwell: J. Agric. Food Chem. 57, 10296–10301 (2009).
- 22) X. Yi and Y. Lu: Chemosphere 65, 639–643 (2006).
- 23) R. A. Mulligan, Z. C. Redman, M. R. Keener, D. B. Ball and R. S. Tjeerdema: Pest Manag. Sci. 72, 1322–1327 (2016).
- 24) R. A. Mulligan, P. L. Tomco, M. W. Howard, T. T. Schempp, D. J. Stewart, P. M. Stacey, D. B. Ball and R. S. Tjeerdema: J. Agric. Food Chem. 64, 7059–7067 (2016).
- 25) P. Zhang, C. Ren, H. Sun and L. Min: Sci. Total Environ. 615, 59–69 (2018).
- 26) Y. Motoki, T. Iwafune, N. Seike, T. Otani and M. Asano: J. Pestic. Sci. 39, 105–114 (2014).
- 27) http://www.acis.famic.go.jp/syouroku/buprofezin/index.htm (Accessed 10 Oct., 2018)
- 28) T. Takeshita and K. Noritake: Weed Biol. Manage. 1, 61–70 (2001).
- 29) FOCUS: “FOCUS Surface Water Scenarios in the EU Evaluation Process under 91/414/EEC,” Report of the FOCUS Working Group on Surface Water Scenarios, EC Document Reference SANCO/4802/2001-rev.2, 2001.
- 30) https://www.env.go.jp/water/dojo/noyaku/n_kentoukai/index.html (Accessed Aug., 2018)
- 31) W. van Beinum, S. Beulke, C. Fryer and C. Brown: J. Agric. Food Chem. 54, 9152–9159 (2006).
- 32) J. Villaverde, W. van Beinum, S. Beulke and C. D. Brown: Environ. Sci. Technol. 43, 8227–8232 (2009).
- 33) http://www.acis.famic.go.jp/syouroku/azoxystrobin/index.htm (Accessed 10 Oct., 2018)
- 34) K. Kibe, M. Takahashi, T. Kameya and K. Urano: J. Pestic. Sci. 25, 234–239 (2000).
- 35) M. Uchida, H. Nishizawa and T. Suzuki: J. Pestic. Sci. 7, 397–400 (1982).
- 36) A. Boudina, C. Emmelin, A. Baaliouamer, O. Paisse and J. M. Chovelon: Chemosphere 68, 1280–1288 (2007).
- 37) K. M. A. Holvoet, P. Seuntjens and P. A. Vanrolleghem: Ecol. Modell. 209, 53–64 (2007).
- 38) J. Boulange, D. Q. Thuyet, P. Jaikaew and H. Watanabe: Pest Manag. Sci. 72, 1178–1186 (2016).
- 39) J. Boulange, F. Malhat, D. Q. Thuyet and H. Watanabe: Pest Manag. Sci. 73, 2429–2438 (2017).
- 40) N. La, M. Lamers, V. V. Nguyen and T. Streck: Pest Manag. Sci. 70, 70–79 (2014).