Introduction
Neonicotinoid insecticides are one of the most common and essential plant protection products that play an important role in food quantity and quality preservation. Since the introduction of imidacloprid, which was registered in 1992, nitenpyram, acetamiprid, thiamethoxam, thiacloprid, clothianidin, and dinotefuran have been commercialized.1) They act as agonists at the insect nicotinic acetylcholine receptor and show high insecticidal activity against a wide range of sucking and biting crop pests.2) Their excellent selective-toxicity and physicochemical properties allow them to be used on various agricultural products.3,4) On the other hand, their extensive application and distribution on crops give rise to the frequent exposure of humans to pesticides.5,6) Therefore, monitoring pesticide residues on agricultural products is crucial for accurately assessing the exposure level. Because individually analyzing these chemicals is time consuming and costly, a simultaneous determination method that is sensitive and accurate at trace levels is desired for screening tests.
Liquid chromatography coupled with tandem mass spectrometry (LC-MS/MS) is a qualitative and quantitative analytical technique that is capable of accurately detecting and qualifying polar, ionic, or low-volatility pesticides at trace levels and is widely used for the analysis of residual neonicotinoids in food.7–13) However, matrix effects, such as ionic suppression and enhancement, can reduce analytical reliability, even that of LC-MS/MS.14–19) Several techniques have been developed in order to deal with this problem. The matrix-matched calibration method is one technique to overcome sample matrices by mixing sample matrices from blank samples into the standard solutions. This means that both the standards and the samples receive the same matrix effects, and they can be ignored in the obtained result. However, especially in the case of screening analysis before shipment, there is a difficulty in applying the calibration method to the analysis of pesticide residues in different types of foods. This is not only because preparing standard samples for each food type is too time consuming but also because analyte-free samples are not always available, making it difficult to apply the method to screening tests.
An internal standard (IS) calibration method offers an easy solution to the problems caused by matrix effects.20,21) This method makes use of a stable isotope-labeled compound of a target analyte, which has properties physically and chemically identical to the analyte. The compound is added as a calibration spike standard or cleanup standard. Mass spectrometry allows accurate quantitation without the need for matrix matching as long as the IS co-elutes with the analyte of interest.20) The advantage of this method is that there is no need to add further analysis procedures or obtain blank samples. Moreover, this is the only method by which analytical disparities can be calibrated due to analyst differences and variations in mass spectrometry responses caused by fluctuation in the injection volume. These benefits of both accuracy and convenience made the calibration method applicable to various pesticide analyses.22) Unfortunately, there is a limitation in the number of ISs that can be spiked for calibration in simultaneous analyses, because, for some pesticides, the ISs are not commercially available. In that case, an IS for the calibration is often chosen from other available isotope-labeled compounds that is similar to the target analyte in its property like a structure, chromatographic separation, or compound ionization.22,23) Moreover, most ISs are costly, and thus it is desirable to choose a minimum number of ISs in order to perform simultaneous analysis with a reasonable cost. For the simultaneous analysis of seven neonicotinoid pesticides, imidacloprid-d4 is often selected as the only IS for the compensation9,10,13); however, its utility has not been scientifically elucidated.
The objective of this study is to develop a sensitive and accurate method for simultaneous analysis of the residue of seven neonicotinoids in agricultural products for regulatory monitoring purposes. We first selected a cartridge for a solid phase extraction (SPE) cleanup and a washing solution that are suitable for neonicotinoids. Then we carried out recovery tests with three food samples (brown rice, grapes, and peanuts) and considered how to minimize the amount of unused ISs by adjusting the timing of spiking the ISs. We then evaluated the magnitude of matrix effects (MME) in mass spectrometry to assess the influence of IS calibration on the recoveries of neonicotinoids. We also suggest three ISs that can be used for correction of and compensation for the seven neonicotinoids when MME is considered for the selection of surrogate ISs.
Materials and Methods
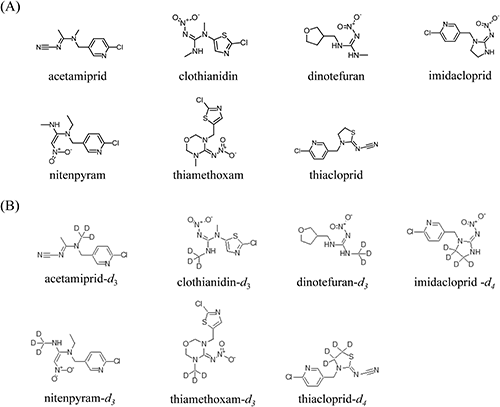
1. Chemicals and reagentsCertified neonicotinoid standards, acetamiprid, clothianidin, dinotefuran, imidacloprid, nitenpyram, thiamethoxam, and thiacloprid, were purchased from FUJIFILM Wako Pure Chemical Corporation. (Osaka, Japan). A standard solution containing ISs of seven neonicotinoids (acetamiprid-d3, clothianidin-d3, dinotefuran-d3, imidacloprid-d4, nitenpyram-d3, thiamethoxam-d3, and thiacloprid-d4), at a concentration of 10 µg/mL in acetonitrile were purchased from Hayashi Pure Chemical Ind. (Osaka, Japan). The chemical structures of the seven neonicotinoid pesticides and their stable isotope-labeled surrogates are shown in Fig. 1. Acetonitrile, methanol, and ultrapure water purchased from Wako were of the pesticide-analysis grade and were used for the extraction and cleanup processes during the analysis.
2. Sample extractionThe cereal crops (brown rice and peanuts) were ground to a homogenous powder using a mill (Panasonic Corporation, Osaka, Japan), and 10.0 g of the powder was soaked in 20 mL of ultrapure water for 30 min in a 300 mL stoppered conical flask before acetonitrile extraction. The fruit and vegetable samples (grapes and hagobou (young burdock)) were homogenized in a food processor (Panasonic), and 20.0 g of each sample was added to the conical flask and shaken vigorously with 100 mL of acetonitrile for 30 min using a shaker. The extract was then filtered using a 5A (70 mm) filter paper (Toyo Roshi Kaisha, Ltd., Tokyo, Japan) with suction filtration. The extraction residue was rinsed thrice with approximately 20 mL of acetonitrile. The solvent extracts were then combined and accurately increased up to 200 mL with acetonitrile.
3. SPE cleanupProposed method: SPE cleanup was performed using an InertSep® Pharma FF (fast-flow) cartridge (500 mg/6 mL) and InertSep® GC (Carbograph, Graphite Carbon) cartridge (500 mg/6 mL) (GL Sciences, Tokyo, Japan). Pharma FF is a polymer sorbent consisting of a styrene-divinylbenzene copolymer with N-containing polar groups and methacrylate. The Pharma FF and GC cartridges were conditioned with 10 mL of methanol. Subsequently, the Pharma FF cartridge was conditioned with 10 mL of a methanol/ultrapure water (2 : 8 volume/volume) solution. A 10 mL aliquot of the extraction solution was transferred to a 200 mL recovery flask and concentrated by a rotary evaporator (Büchi, Flawil, Switzerland) at 40°C. The residue was dissolved in 5 mL of methanol/ultrapure water (2 : 8 v/v) and submitted to SPE cleanup. The sample was percolated through a Pharma FF cartridge under a vacuum manifold and washed with 5 mL of methanol/ultrapure water (2 : 8 v/v). Later, the cartridge was dried with nitrogen gas for 30 min, after which 15 mL of methanol was loaded into the Pharma FF cartridge and the eluent was percolated to the GC cartridge. Finally, the GC cartridge was loaded with 5 mL of methanol. The collected eluent was evaporated on an evaporator at 40°C and dried under a stream of nitrogen gas. The residue was redissolved in 1.0 mL of methanol and analyzed via LC-MS/MS.
Japanese official method: A 10 mL aliquot of the extraction solution was mixed with 10 g of sodium chloride and 20 mL of a 0.5 M phosphate buffer (pH 7) in a 300 mL separation funnel. The mixture was shaken vigorously for 10 min and then allowed to stand for about 10 min. After the aqueous phase was discarded, the acetonitrile phase was dried with anhydrous sodium sulfate and filtered, and the filtrate was concentrated using a rotary evaporator at 40°C and evaporated to dryness with a gentle stream of nitrogen. The residue was reconstituted in 5 mL of acetonitrile/toluene (3 : 1 v/v), and the resulting solution was loaded onto a graphite carbon/aminopropylsilanized silica gel layered cartridge (InertSep® GC/NH2; GL Sciences) preconditioned with 10 mL of acetonitrile/toluene (3 : 1 v/v). After the target compounds were eluted with 15 mL of acetonitrile/toluene (3 : 1 v/v), the eluate was concentrated and dried. The residue was reconstituted with 1.0 mL of methanol and analyzed via LC-MS/MS.
4. LC-MS/MS conditionsLiquid chromatography was carried out on a Nexcera® HPLC system (Shimadzu Corporation, Kyoto, Japan). Analyte separation was conducted on a Kinetex® Biphenyl column (2.6 µm, 100×2.1 mm2) (Phenomenex, California, USA). Solvent A (2 mmol/L ammonium formate and 0.002% formic acid in ultrapure water) and solvent B (2 mmol/L ammonium formate and 0.002% formic acid in methanol) were used as the mobile phase. A binary gradient mode was used, where the A:B ratio varies as follows: 0 min, 97 : 3; 1 min, 90 : 10; 3 min, 45 : 55; 10.5 min, 0 : 100; 12 min, 0 : 100; 12.01 min, 97 : 3; 15 min, 97 : 3.Tandem mass spectrometry (MS/MS) was conducted on an LC-MS 8050 triple-quadrupole mass spectrometer equipped with an electrospray ionization (ESI) mass spectrometer (Shimadzu Corp.). ESI was performed in the positive ion electrospray mode. Other LC-MS/MS conditions can be found in the supplemental information (Supplemental Table S1); they were controlled using LabSolutions software. The identification of analytes was carried out in the selected reaction monitoring (SRM) mode and SRM transitions of each analyte, and the surrogate standards are shown in Table 1 along with the retention time (RT), precursor, quantitative product, and conformation product ions and their collision energy (CE). These conditions were tuned by injecting each analyte and a mixture of the surrogate standards. A 2 µL aliquot of the standard solutions containing the neonicotinoid compounds at a concentration of 200 µg/mL was injected into the MS/MS for the tuning. The precursor ion for each analyte was obtained by recording the mass spectra in the m/z range of 50 to 500 in the full scan mode (ESI+), and the most sensitive quantitative product and conformation product ions were procured based on each precursor ion obtained via the Q3 scan mode. The CE for each quantitative product and the conformation product ions was optimized in the range from −50 to −10 V. To minimize potential carryover, the needle of the injector was rinsed with methanol and a solution of ultrapure water/formic acid/acetate 100 : 0.1 : 0.1 v/v after each injection was carried out.
Table 1. LC-MS/MS parameters: retention time, transition mass, and collision energy of target compounds
| Analyte | Retention time (min) | Precouser ion | Product ion 1 | Collision energy (V) | Product ion 2 | Collision energy (V) |
|---|
| Acetamiprid | 4.8 | 223 | 126 | −21 | 90 | −35 |
| Acetamiprid-d3 | 4.7 | 226 | 126 | −22 | 90 | −35 |
| Clothianidin | 3.9 | 250 | 169 | −13 | 132 | −13 |
| Clothianidin-d3 | 3.9 | 253 | 172 | −13 | 132 | −13 |
| Dinotefuran | 3.2 | 203 | 113 | −14 | 129 | −11 |
| Dinotefuran-d3 | 3.2 | 206 | 116 | −14 | 132 | −11 |
| Imidacloprid | 4.5 | 256 | 209 | −17 | 175 | −21 |
| Imidacloprid-d4 | 4.4 | 260 | 213 | −17 | 179 | −21 |
| Nitenpyram | 3.8 | 271 | 189 | −11 | 255 | −14 |
| Nitenpyram-d3 | 3.8 | 274 | 192 | −11 | 258 | −14 |
| Thiamethoxam | 4.0 | 292 | 211 | −11 | 132 | −21 |
| Thiamethoxam-d3 | 4.0 | 295 | 214 | −11 | 132 | −21 |
| Thiacloprid | 5.3 | 253 | 126 | −21 | 90 | −41 |
| Thiacloprid-d4 | 5.3 | 257 | 126 | −21 | 90 | −41 |
Recovery tests were conducted with three agricultural samples (brown rice, grapes, and peanuts). No samples showed any interfering peaks from endogenous pesticides at the RTs of the target analytes. The samples were spiked with 1 mL of the acetonitrile solution containing 200 µg/mL analytes. The recovery test was carried out five times in the same day for each sample.
6. Evaluation of analyte correction and compensation by ISsTo evaluate the analyte fluctuations in mass spectrometry, which were corrected or compensated by ISs, matrix effects were evaluated according to a method described in earlier studies.17,18) The cleaned-up extracts of non-spiked blank samples (brown rice, grapes, and peanuts) were prepared using the proposed method described earlier in Materials and Methods. The cleaned-up extracts were condensed with an evaporator at 40°C and dried in a stream of nitrogen gas. Later, the residues were redissolved in 1.0 mL of methanol, after which 10 ng of each of the target analytes and ISs was added. The MME was calculated using the following equation.
 | (1) |
Results and Discussion
1. LC-MS/MS parametersPreliminary experiments were conducted to determine the best apparatus parameters for the unambiguous identification and quantification of the seven target neonicotinoids. The most intense SRM transition was chosen for each analyte, and the corresponding CE was tuned for the selected transmission mass. The analytes were then separated via liquid chromatography using a biphenyl column, and the RT was determined. The LC-MS/MS parameters of the various analytes are listed in Table 1. The limit of determination and limit of quantification were 0.005 µg/kg and 0.01 µg/kg, respectively.
2. Sample extractionIn this step, we seek to abstract the maximum amount of target compounds along with a minimum amount of interfering analytical components, such as aliments and pigments, which are co-extracted from the samples. Thus, selecting a suitable extraction solvent is essential for the simultaneous analysis of pesticides. Obana et al.24) carried out a solvent-selection experiment and found out that highly water-soluble nitenpyram was efficiently extracted with acetonitrile, unlike in the case of polymer and ethyl acetate extraction. Xie et al.10) also selected acetonitrile as an extraction solvent after conducting a solvent-selection experiment on three solvents (ethyl acetate, acetonitrile, and cyclohexane) for the determination of six neonicotinoid pesticide (dinotefuran, thiamethoxam, clothianidin, imidacloprid, acetamiprid, and thiacloprid) residues in agricultural products. Liu et al.9) reported that acetone, commonly used as an extraction solvent in pesticide-residue analysis, is not suitable for the extraction of chemicals with high affinity to water, such as nitenpyram and dinotefuran; they developed a method for the simultaneous determination of neonicotinoid residues in food via LC-MS/MS using acetonitrile extraction. As several previous experimental studies concluded that acetonitrile is the most effective solvent for the simultaneous analysis of neonicotinoid compounds, we chose acetonitrile as the extraction solvent in this study.
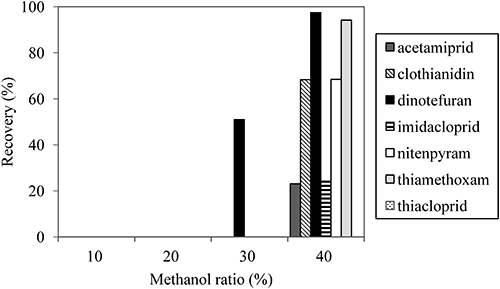
3. SPE cleanupPharma FF is an SPE cartridge applied to the analysis of neonicotinoid pesticides in river water.25) However, its presence and content in agricultural products have not been identified thus far. In the previous report, acetone was eluted to extract neonicotinoids from the cartridge.25) However, when tested with an agricultural product, some analytes were not satisfactorily extracted by acetone (Supplemental Fig. S1). Thus, we optimized the eluent with different concentrations of methanol, a solvent that dissolves polar compounds such as nitenpyram and dinotefuran. A comparison of the results obtained with methanol of different concentrations as the eluent for Pharma FF cartridge cleanup is shown in Fig. 2. None of the neonicotinoids was eluted from the cartridge when a 20% methanol solution was loaded, but hydrophilic dinotefuran was detected from the eluent of a 30% methanol solution. Therefore, a 20% methanol solution was chosen as the washing solution in this study. All of the analytes were completely eluted from the cartridge with methanol of more than 80% concentration (data not shown). A GC cartridge was adopted for additional cleanup to remove pigment materials from food homogenates after the Pharma FF cartridge cleanup. Obana et al.26) reported that a graphitized carbon exhibited good retention of nitenpyram, thiamethoxam, imidacloprid, acetamiprid, and thiacloprid from the extraction solution when methanol was used as a load solvent. Hence, methanol was percolated through the cartridges to collect analytes. The applicability of the proposed SPE cleanup was verified, since the average recoveries and relative standard deviations (RSDs) of seven neonicotinoid pesticides were better than those of a cleanup procedure adopted for the official Japanese method,27) a combination of liquid-liquid partitioning and SPE using a GC/NH2 cartridge (Supplemental Fig. S2). This may be because acetonitrile, the eluent used to collect target compounds from the cartridge used in the official Japanese method, was not polar enough to extract hydrophilic dinotefuran and nitenpyram.
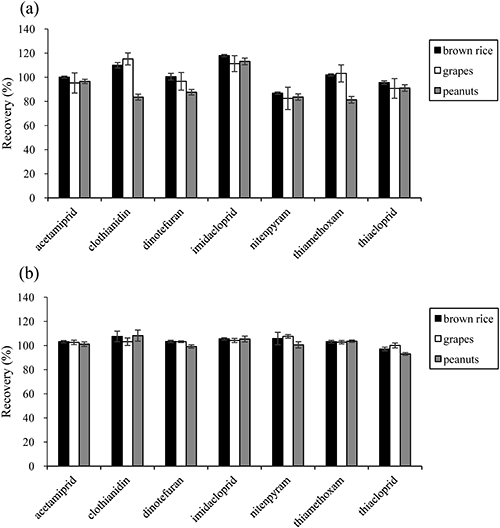
4. Method validationMethod validation was conducted with three types of food samples (brown rice, grapes, and peanuts). The samples were expected to represent fiber-rich grain, watery fruit, and oily nuts, respectively. For all combinations of analytes and samples, the extraction by acetonitrile and application of proposed SPE cleanup resulted in satisfactory recoveries and RSDs that met the criteria in the Japanese and US guidelines for the validation of pesticide-residue analysis methods (70–120 and <20%, respectively).28,29) The recoveries and RSDs calculated using the external calibration method were in the ranges of 91–119 and ≤6.9%, 81–119 and ≤5.3%, and 85–115 and ≤5.6% for brown rice, grapes, and peanuts, respectively (Fig. 3(a)). In order to correct and compensate for the effect of sample matrices, the recoveries and RSDs were calculated using the IS calibration method. Calibration curves were constructed by plotting the peak area ratio (native/isotopically labeled) versus the mass fraction ratios (native/isotopically labeled). For all analytes, excellent recovery rates of almost 100% were shown for each sample, in which the recoveries and RSDs were in the ranges of 96–109 and ≤2.0%, 99–105 and ≤5.3%, and 95–111 and ≤5.0% for brown rice, grapes, and peanuts, respectively (Fig. 3(b)). However, the high analytical cost due to the usage of expensive IS standards remained unsolved. Because most of the ISs were left unused in the diluted extract after the process of fractionation, we considered mitigation of the usage of futile ISs during the analysis. To address the issue, spiking the IS into the aliquot, rather than into the samples before an extraction procedure, was attempted. This attempt still allows the ISs to identically calibrate the behavior of target analytes in SPE cleanup, chromatographic separation, and compound ionization. In order to assess the partition of ISs between food samples and acetonitrile in sample extraction, the recovery of ISs added to the aliquot was examined and compared with that of existing method, in which ISs are added before shaking extraction. Table 2 lists the recoveries of ISs from brown rice, grapes, and peanuts when ISs were added to the samples at different times. The recoveries and RSDs were between 70 and 120% and below 20%, which satisfactorily met the criteria specified in the Japanese guidelines (the recovery of ISs must be more than 40%).28) Moreover, there was no significant difference (p=0.05) in the recoveries of ISs for all combinations of the pesticides and samples when the recoveries of two methods were compared using a significance test.30) The result also showed that the segregation of aliquots did not affect the IS recoveries. These results suggested that spiking ISs into the aliquot of an extract solution is able to produce a result equivalent to that using an ordinal method, which adds ISs to the sample before extraction. Indeed, identical recovery rates of neonicotinoid pesticides were observed when ISs were added to the aliquots for all samples (Fig. 4). The result indicated that the reduction of analytical cost is possible by spiking ISs into aliquots, which can show recoveries equivalent to those obtained by the simultaneous analysis of seven neonicotinoids for brown rice, grapes, and peanuts calibrated via the conventional IS method. The spiking procedure herein suggested may offer a cheaper screening test for neonicotinoid pesticide residues in food when compared to the application of an ordinal IS calibration method. The application of calibration using the IS method resulted in an improvement in the recoveries of almost every pesticide compared to those using the external calibration method. This may be due to the difference in the effect of the sample matrix; hence, the effect of the matrix was evaluated as described in the following sections.
Table 2. The recoveries of seven internal standards (ISs) for neonicotinoid pesticides from brown rice, grape, and peanuts obtained by the proposed method with two different addition timings of ISs
| ISs | Brown rice | Grape | Peanuts |
|---|
| BEa) | SAb) | BEa) | SAb) | BEa) | SAb) |
|---|
| Acetamiprid-d3 | 105±1.6 | 105±1.6 | 100±2.3 | 93.1±7.5 | 106±1.0 | 103±2.4 |
| Clothianidin-d3 | 106±1.8 | 110±4.4 | 116±2.8 | 110±5.5 | 84.0±7.2 | 84.5±3.3 |
| Dinotefuran-d3 | 101±2.5 | 102±2.6 | 93.5±2.3 | 91.0±7.2 | 92.5±1.1 | 92.1±1.5 |
| Imidacloprid-d4 | 119±0.6 | 119±0.4 | 115±2.0 | 105±8.4 | 120±1.3 | 119±0.6 |
| Nitenpyram-d3 | 91.4±5.9 | 86.4±5.4 | 81.6±3.0 | 76.0±8.3 | 91.1±4.2 | 88.4±3.3 |
| Thiamethoxam-d3 | 105±2.0 | 105±0.7 | 107±1.9 | 102±7.2 | 84.0±4.9 | 82.5±2.7 |
| Thiacloprid-d4 | 102±1.6 | 101±1.1 | 97.2±1.3 | 91.4±7.2 | 102±1.7 | 98.8±2.3 |
a) Before extraction, b) Spike into aliquot. Values are average recoveries±relative standard deviations (%).
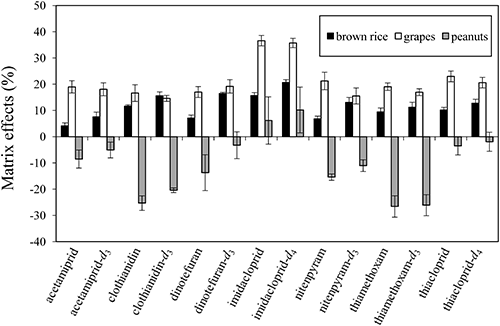
To evaluate analyte fluctuation due to matrix effects, which were corrected or compensated by ISs in mass spectrometry, the MME on the seven neonicotinoid pesticides and their ISs in the proposed method were evaluated using brown rice, grape, and peanut samples (Fig. 5). The results exhibited remarkable differences in the matrix effect according to the food type and could be divided into two groups. Ionic enhancement was observed in all seven neonicotinoid pesticides in the presence of brown rice and grape matrices. In contrast, ionic suppression was noticed in the presence of the peanut matrix, except in the case of imidacloprid. Similar observations were made with ISs. Interfering analytical components co-extracted from oily nuts may lead to the suppression of target compounds; however, further consideration is needed to yield any findings on the relationship between sample type and matrix effects. The result showed that only in the brown rice matrix was there no substantial signal suppression or enhancement (matrix effect within ±20%) of neonicotinoid pesticides according to the criteria explained in an earlier study.31) However, the result implied that even when the matrix effects ranged from –27 to 37%, the IS calibration could fill up the deficit and redress the observed inflation. In order to minimize the effect of matrices on analyte recovery, dilution of the sample solution is a convenient technique.17,19) However, Stahnke et al. reported that the MME varied depending on the pesticide/matrix combination and resulted in the requirement of different dilution factors for the complete elimination of matrix effects, and extreme dilution is not acceptable due to the detectability limitation of the analyzer.17) The combination of target pesticides and food samples can be substantially altered according to the purpose of the analysis. For simultaneous analysis targeting a wide range of pesticides, diluting the extraction solution according to the type of pesticide and sample is not realistic, since it is time consuming and labor intensive, especially in the case for screening tests, in which urgent analysis is often required. This study shows an easier and cheaper approach to overcome these difficulties by spiking a small amount of ISs into aliquots of the extract, which can be applied to various types of food for the precise and simultaneous determination of neonicotinoid pesticides.
6. Selection of the minimum number of surrogatesAlthough stable isotope-labeled analogues for seven neonicotinoid pesticides are commercially available, reducing the number of ISs was considered to reduce the analytical cost. Table 3 lists the recoveries of neonicotinoid analytes from rice, grapes, and peanuts when calibrated with seven different ISs. One major criterion in the selection of ISs is RT, since chemicals that are physically and chemically identical to the analytes are expected to show the same behaviors as the targets in chromatographic separation. Clothianidin and nitenpyram have similar RTs; however, in the case of brown rice and grapes, the calibration of clothianidin by nitenpyram-d3 resulted in a substantial increase in the recovery of clothianidin, and the calibration of nitenpyram by clothianidin-d3 showed low recovery of nitenpyram. Another factor considered in choosing ISs is the similarity of chemical structure. This is because a behavior of analytes in sample pretreatment and chromatographic separation is mainly attributed to the interactions between functional groups of the chemicals and polymers in SPE cartridges or columns. Neonicotinoid pesticides, as the name suggests, contain a nicotine-like structure but can be differentiated by the presence of nitromethylenes (C=CHNO2), nitroguanidines (C=NNO2), and cyanoamidines (C=NCN) or chloronicotinyl, thianicotinyl, and tefuryl moieties.2) Thiacloprid and acetamiprid are structurally similar: both have attachments of cyanoamidine and chloronicotinyl moiety. Furthermore, as expected, the compensation for thiacloprid by acetamiprid-d3 and for acetamiprid by thiacloprid-d4 resulted in recoveries of nearly 100% for all samples. The same behavior was observed with clothianidin and thiamethoxam, which both have attachments of nitroguanidine and thianicotinyl moiety. However, little could be judged about the similarities of nitenpyram, imidacloprid, and dinotefuran from their structures. Here, we focused on how much analyte compensation has occurred due to the ISs. The magnitude of compensation (MC) of each analyte is calculated using the following equation.
Table 3. The recoveries of neonicotinoid pesticides from brown rice, grapes, and peanuts when compensated by seven-different internal standards (ISs)
| (a) brown rice |
|---|
| ISs | Acetamiprid | Clothianidin | Dinotefuran | Imidacloprid | Nitenpyram | Thiamethoxam | Thiacloprid |
|---|
| Acetamiprid-d3 | 103±1.7 | 111±2.6 | 102±2.7 | 121±2.4 | 104±1.1 | 104±1.1 | 98.4±1.5 |
| Clothianidin-d3 | 102±2.8 | 109±1.5 | 101±2.7 | 120±1.2 | 92.2±6.8 | 103±2.8 | 97.7±1.6 |
| Dinotefuran-d3 | 103±3.5 | 111±3.0 | 102±2.0 | 121±3.1 | 93.3±7.9 | 104±3.6 | 99.1±2.8 |
| Imidacloprid-d4 | 89.2±2.1 | 96.8±1.2 | 87.7±1.4 | 107±1.3 | 80.0±7.3 | 89.4±2.3 | 85.2±2.1 |
| Nitenpyram-d3 | 114±13.3 | 122±8.7 | 114±5.1 | 134±8.2 | 102±8.5 | 116±9.0 | 110±8.6 |
| Thiamethoxam-d3 | 102±2.0 | 110±3.2 | 101±3.1 | 120±3.0 | 91.7±8.0 | 103±1.8 | 97.6±1.2 |
| Thiacloprid-d4 | 100±0.7 | 108±2.5 | 99.1±2.8 | 119±2.1 | 101±2.1 | 101±2.1 | 95.9±1.2 |
| (b) grapes |
|---|
| ISs | Acetamiprid | Clothianidin | Dinotefuran | Imidacloprid | Nitenpyram | Thiamethoxam | Thiacloprid |
|---|
| Acetamiprid-d3 | 103±1.7 | 119±2.3 | 99.9±5.5 | 112±6.0 | 111±2.3 | 111±2.3 | 96.4±1.9 |
| Clothianidin-d3 | 87.4±2.8 | 101±2.8 | 84.4±7.6 | 100±3.0 | 69.6±3.4 | 94.0±2.6 | 81.7±3.3 |
| Dinotefuran-d3 | 107±3.5 | 122±3.1 | 103±2.3 | 122±2.8 | 85.9±6.1 | 114±4.5 | 99.9±3.6 |
| Imidacloprid-d4 | 89.0±2.1 | 103±1.9 | 85.8±5.8 | 103±2.1 | 70.4±5.1 | 95.9±1.4 | 82.8±2.1 |
| Nitenpyram-d3 | 124±13.3 | 143±13.3 | 121±2.7 | 143±13.3 | 99.2±13.8 | 134±13.3 | 117±13.6 |
| Thiamethoxam-d3 | 97.6±2.0 | 112±2.1 | 94.4±6.5 | 112±2.2 | 79.9±4.4 | 105±1.6 | 91.2±2.4 |
| Thiacloprid-d4 | 106±0.7 | 122±1.6 | 102±5.5 | 122±1.3 | 114±1.3 | 114±1.3 | 98.9±0.5 |
| (c) peanuts |
|---|
| ISs | Acetamiprid | Clothianidin | Dinotefuran | Imidacloprid | Nitenpyram | Thiamethoxam | Thiacloprid |
|---|
| Acetamiprid-d3 | 102±1.0 | 87.2±5.4 | 91.1±2.6 | 114±4.5 | 87.0±5.9 | 87.0±5.9 | 96.6±2.4 |
| Clothianidin-d3 | 132±7.0 | 111±2.5 | 118±7.2 | 147±3.2 | 113±6.5 | 112±2.1 | 125±6.1 |
| Dinotefuran-d3 | 112±1.0 | 96.0±4.0 | 101±2.1 | 126±2.9 | 97.5±3.4 | 96.1±4.1 | 107±1.1 |
| Imidacloprid-d4 | 93.5±1.7 | 80.5±3.4 | 83.8±2.8 | 105±2.6 | 81.6±3.1 | 80.0±4.2 | 88.8±1.9 |
| Nitenpyram-d3 | 117±5.2 | 99.3±4.7 | 105±4.6 | 130±4.3 | 101±5.3 | 100±4.1 | 111±4.9 |
| Thiamethoxam-d3 | 125±4.9 | 106±2.8 | 112±5.4 | 139±2.3 | 108±5.3 | 106±1.4 | 119±3.6 |
| Thiacloprid-d4 | 100±2.2 | 85.2±3.9 | 89.0±3.0 | 113±2.6 | 84.7±3.7 | 84.7±3.7 | 94.7±0.9 |
Values are average recoveries±relative standard deviations (%).
 | (2) |
MCx represents the magnitude of compensation of analyte x. Fsx stands for the area of the stable isotope of analyte x in a 10 ng spiked food sample, and Ssx stands for the area of the stable isotope of analyte x in a 10 ng/mL standard solution. Fsn stands for the area of an unknown surrogate in a 10 ng spiked food sample, and Ssn stands for the area of a 10 ng/mL unknown surrogate in standard solution. In other words, the equation shows the product of the MME of the IS of analyte x and the reciprocal MME of an unknown IS used for correction and compensation. MC equals 1 when the compensation of analyte x was carried out with an IS that is an isotopic-labeled compound of analyte x. The MCs of seven neonicotinoid pesticides are shown in Fig. 6. The result showed imidacloprid compensation with ISs other than imidacloprid-d3 results in excess supplementation in all samples except for that with clothianidin-d3 in grapes. In contrast, nitenpyram compensation with ISs other than nitenpyram-d3 results in insufficient supplementation, especially for brown rice and grapes. These results indicated that it is better for imidacloprid and nitenpyram compensations to be performed by their own analogues. The results also showed that the MC of acetamiprid-d3 or thiamethoxam-d3 was nearly equal to 1 for all analytes except imidacloprid and nitenpyram. Past studies chose imidacloprid-d4 to compensate neonicotinoid pesticides.9,10,13) However, the recoveries of some compounds other than imidacloprid were not satisfactory.9,13) The results of this study suggest that imidacloprid-d4, nitenpyram-d3, and acetamiprid-d3 or thiamethoxam-d3 would be useful ISs in the simultaneous analysis of seven neonicotinoid pesticides.
Moreover, the MC patterns of brown rice and grapes were similar to that of peanuts. A similar tendency was observed with the MME in the preceding section. The results suggest that matrix effects should be taken into account when calculating the MC. It is indisputable that reliable and accurate quantification of analytes by calibration with ISs can be achieved using isotopically labeled analogues corresponding to all analytes. However, for pesticides with no available ISs, a suitable and minimum number of surrogates must be selected. Further investigation of the relationship between pesticides and food samples may enable the MC to be a new guide for selecting suitable ISs for compensation, other than RT and chemical structure.
7. Residue analysisThe proposed method was applied to hagobou (young burdock), which was cultivated in Yao, Osaka, Japan. Hagobou was harvested when it reached a size of ∼0.9 m (Supplemental Fig. S3). The edible part of this vegetable includes the leaf, stem, and root, and it is speculated that it contains a variety of matrix components in different parts. Residue analysis was carried out using the proposed method, in which an aliquot of a young burdock extract was fortified with ISs. Acetamiprid, clothianidin, dinotefuran, nitenpyram, thiamethoxam, and thiacloprid residues were below 0.01 µg/kg, and imidacloprid was detected at 0.02 µg/kg in the non-spiked sample. The imidacloprid residue was below the maximum residual level stated in the established regulations in Japan.32) The recovery test was conducted in parallel with the residue analysis, and the recoveries were calculated using the following equation.
 | (3) |
Here, R stands for recovery (%), Ca stands for fortified concentration, and Cs stands for the analyzed concentration of the spiked samples.
As imidacloprid was detected in the non-spiked sample, the recovery of imidacloprid was calculated using the equation given below:
 | (4) |
where Ri stands for the recovery of imidacloprid (%) and Cb stands for the concentration of imidacloprid in the non-spiked sample.
The recoveries and RSDs of acetamiprid, clothianidin, dinotefuran, imidacloprid, nitenpyram, thiamethoxam, and thiacloprid were 94±2.1%, 96±3.7%, 93±2.0%, 107±15.2%, 85±2.3%, 86±1.4%, and 82±2.1%, respectively, when seven neonicotinoids were calibrated with their corresponding stable isotopes. The results were within the Japanese and European validation guidelines for pesticide-residue analysis.28,29) When acetamiprid-d3 or thiamethoxam-d3 was used to compensate the seven neonicotinoids, except for nitenpyram and imidacloprid, the analyte recoveries were also satisfactory (Table 4). The result suggested that the proposed method could be applied to leafy vegetables and root vegetables.
Table 4. The recoveries of neonicotinoid pesticides from hagobou (young burdock) when compensated by seven-different internal standards (ISs)
| ISs | Acetamiprid | Clothianidin | Dinotefuran | Imidacloprid | Nitenpyram | Thiamethoxam | Thiacloprid |
|---|
| Acetamiprid-d3 | 94.3±2.1 | 99.6±2.9 | 104±2.4 | 55.0±22.2 | 70.6±5.9 | 87.3±1.7 | 92.1±2.0 |
| Clothianidin-d3 | 90.0±2.8 | 95.9±3.7 | 100±2.1 | 70.7±19.6 | 65.7±8.4 | 82.6±2.4 | 87.7±2.4 |
| Dinotefuran-d3 | 84.4±2.2 | 90.1±3.3 | 93.1±2.0 | 35.5±25.0 | 63.7±6.4 | 77.8±1.7 | 82.3±2.0 |
| Imidacloprid-d4 | 107±2.8 | 112±4.0 | 118±2.1 | 107±15.2 | 77.7±7.3 | 98.8±2.2 | 104±2.5 |
| Nitenpyram-d3 | 116±5.3 | 121±5.4 | 128±6.3 | 59.6±34.4 | 85.5±2.3 | 108±6.3 | 114±5.5 |
| Thiamethoxam-d3 | 92.9±1.1 | 98.6±3.2 | 103±0.7 | 64.6±16.7 | 68.9±6.4 | 85.7±1.4 | 90.7±0.7 |
| Thiacloprid-d4 | 84.7±2.2 | 90.9±2.1 | 94.4±2.6 | 68.8±14.2 | 61.7±7.2 | 77.4±0.9 | 82.5±2.1 |
Values are average recoveries±relative standard deviations (%).
This work demonstrates that (1) SPE cleanup by InertSep® Pharma FF and GC is able to achieve excellent recoveries of neonicotinoid pesticides from different types of agricultural products; (2) calibration with seven ISs corresponding to the analytes can correct and compensate for a substantial signal suppression or enhancement of more than ±20%; and (3) the addition of ISs into an aliquot of the extraction solution and minimizing the number of ISs by selecting those suitable for the compensation by considering the similarities of RT, chemical structure, and MC among analytes could reduce analytical cost and achieve excellent recovery at the same time.