Materials and methods
1. Materials
As test chemicals, anthraquinone (AQ), 2-ethylanthraquinone (2-EA), dibenzofuran (DF), and bis(2-ethylhexyl)phthalate (Bis) were purchased from Tokyo Chemical Industry (Tokyo, Japan). i-Erythritol, 2,2-dimethyl-1,3-propanediol, and putrescine as test chemicals, and acetonitrile and distilled water (HPLC grade, respectively), tetrahydrofuran (stabilizer free, special grade), formic acid, K2HPO4, KH2PO4, Na2HPO4 · 12H2O, NH4Cl, MgSO4·7H2O, CaCl2, FeCl3 · 6H2O, 0.5% phosphate solution, α-D-Glucose, and 1 M sodium hydroxide were purchased from FUJIFILM Wako Pure Chemical (Osaka, Japan). Aniline as a test chemical and acetone were purchased from Kanto Chemical (Tokyo, Japan). Peptone was purchased from Showa Chemical (Tokyo, Japan). Silica gel (5 to 25 µm particle size for thin-layer chromatography) was purchased from Sigma-Aldrich (St. Louis, MO, USA). Sodium sulfite was purchased from Nacalai Tesque (Kyoto, Japan).
2. Metagenomic analysis
For metagenomic analysis, activated sludge containing about 4.5 mg of suspended solids from AS-CERI or AS-STP was centrifuged at 15,000 rpm for 20 min in a centrifuge (Eppendorf Himac CF16RXII, Ibaraki, Japan), and the supernatant was removed. The sludge pellet obtained was stored at −20°C, and the subsequent DNA extraction, PCR, and NGS were conducted at Bioengineering Lab (Kanagawa, Japan) as follows: After freezing and grinding the sludge pellet, DNA was extracted and purified using lysis solution and the MPure Bacterial DNA Extraction Kit (MP Biomedicals, Irvine, CA, USA). The library for the V3–V4 hypervariable region of the 16S rRNA was prepared using the two step, tailed PCR method, and sequencing was performed with read lengths of 2×300 bp using the MiSeq System and the MiSeq Reagent Kit v 3 (Illumina, San Diego, CA, USA). Sequences with a quality value of less than 20 were removed after the primer sequences were removed, and sequences with a length of less than 40 bases and their paired sequences were discarded. After removing chimeras and denoising the sequences obtained, using the DADA2 plugin in Qiime2 (ver.2020.8),18,19) an amplicon sequence variant (ASV) table and the representative sequences were output. The EzBioCloud 16S database was used for taxonomic classification. Sequencing data were deposited in DDBJ (accession No. PRJDB14351). Regarding the quality of sequencing, the minimum number of valid pair reads was 1.5×10⁴ (average 3.8×10⁴) and the minimum Q20 and Q30 scores were 88.8% and 78.1% (average 94.3% and 87.1%), respectively.
At our laboratory, alpha diversity was analyzed using vegan20) version 2.5–5 with R version 3.6.1 as follows: The rarefaction curve was plotted for each sludge sample. Since the slope at the maximum read was less than 10−7, coverage was considered to be 100%. The number of ASVs was calculated by counting all ASVs that were observed at least once. The Simpson index (D) was calculated according to the following equation,21,22) where N is total sequencing reads, ni is number of reads in the i-th ASV, and S is total ASV counts:
As a statistical method for comparing alpha diversity between AS-STP and AS-CERI and for detecting the seasonal difference in relative abundance at the phylum level in AS-STP, a non-parametric Steel–Dwass’s multiple comparison test23) was performed followed by a non-parametric Kruskal–Wallis test23) when the data distribution was confirmed to be non-normal by the Shapiro-Wilk normality test.24,25) In a similar way, a parametric Tukey–Kramer test was also performed for detecting significant difference followed by one-way ANOVA when the data followed a normal distribution.23,26,27) Beta diversity was calculated with the diversity plugin of Qiime2 to obtain the dissimilarity with the weighted UniFrac distance based on the sequence similarity and relative abundance of ASVs in each sludge sample. The obtained distance matrix was ordinalized and plotted in three dimensions using the non-metric multidimensional scaling (NMDS) method in the vegan package for R. The seed value was selected as that with the minimum stress value from 1 to 100.
3. Ready biodegradability test
Ready biodegradability tests were carried out in accordance with OECD guideline 301C or 301F1) as follows: Test medium for 301C or 301F was prepared as described by Takekoshi et al.8) where the final concentrations of K2HPO4, KH2PO4, Na2HPO4 · 12H2O, NH4Cl, MgSO4 · 7H2O, CaCl2, FeCl3 · 6H2O were 25.5, 65.25, 133.8, 5.1, 67.5, 82.5, and 0.75 mg L−1 for 301C, and 85, 217.5, 672.1, 5, 22.5, 27.5, and 0.25 mg L−1 for 301F, respectively. In both the 301C and 301F tests, the concentration of the activated sludge (i.e., AS-CERI for the 301C test, or AS-STP for the 301F test) in the test medium was 30 mg L−1, and the test substance was added to make up a concentration of 100 mg L−1 either directly or after adsorption on silica gel. The procedure for the adsorption of a test substance on silica gel is described by Takekoshi et al.,8) and modifications were made as follows: the test chemical was dissolved not with chloroform but acetone, thoroughly mixed with silica gel, and then acetone was evaporated in a vacuum oven for 14 rather than 28 days. The test medium was stirred and cultivated in darkness at 25±1°C for 301C, or 22±1°C for 301F. The biochemical oxygen demand (BOD) was measured continuously with a coulometer OM7000A (Ohkura Electric, Saitama, Japan) or OxiTop® (WTW, Bayern, Germany). The biodegradation rate of the test substance was calculated by dividing the measured BOD by the theoretical oxygen demand (ThOD) of the test substance, which is the calculated amount of oxygen required to oxidize the test substance to its final oxidation products, and multiplied by 100.1)
For the 301C tests, AS-CERI samples were purchased nine times (Nov 10 in 2016; Sep 12 in 2017; Jun 21 and Nov 28 in 2018; Feb 28 and Aug 29 in 2019; Sep 16 and Dec 18 in 2020; Apr 21 in 2021) from CERI (“A” to “I” in Fig. 2). When the AS-CERI samples were received, a portion of each AS-CERI sample was collected for metagenomic analysis as described above. The AS-CERI samples were subjected to cultivation with 0.1% (w/v) glucose and 0.1% (w/v) peptone at 25±2°C and pH 7.0±1.0 under aerated conditions (1 L min−1,>5 mg of O2 L−1) at our laboratory, until initiation of a test within several days. In the test, biodegrading activities of the AS-CERI sample were examined with aniline as described below. Four of the AS-CERI samples (i.e., “A”, “B”, “C”, and “D” in Fig. 2) were cultivated for up to 126, 63, 42, and 168 days, respectively, and each AS-CERI sample was subjected to metagenomic analysis and testing to examine its biodegrading activities with aniline. An AS-CERI sample was received on Mar 10 in 2020 and subjected to a ready biodegradability test for Bis on the receiving day. An AS-CERI sample was received on Jun 19 in 2020, subjected to the cultivation for four days and then subjected to a ready biodegradability test for AQ.
For the 301F tests, AS-STP was collected 30 times with a bottle from a sludge return line at the STP (Jan 11, 26, May 24, and Dec 4 in 2018; Jan 8, Feb 12, 26, May 13, Aug 1, Sep 11, 13, and Oct 17 in 2019; Jan 9, Feb 7, 13, May 22, Sep 18, Oct 20, 29, Nov 20, 27, and Dec 17, 25 in 2020; Feb 2, Mar 9, Apr 27, Jun 22, and Aug 31 in 2021; Jan 6 and Feb 10 in 2022). The STP was municipal (Osaka, Japan), receiving predominantly domestic sewage. AS-STP was aerated just after its collection until the initiation of any tests. On the collection day, a portion of each AS-STP sample was collected for metagenomic analysis and another portion was subjected to a test to examine its biodegrading activities with aniline. In order to investigate the effect of cultivation on AS-STP samples, an AS-STP sample (i.e., “b” in Fig. 2) was cultivated with 0.1% (w/v) glucose and 0.1% (w/v) peptone at 25±2°C and pH 7.0±1.0 under aerated conditions (1 L min−1, >5 mg of O2 L−1) for up to 56 days, and each AS-STP sample was subjected to metagenomic analysis and a test to examine its biodegrading activities with aniline. One of the AS-STP samples (i.e., “a” in Fig. 2) was aerated without glucose and peptone for up to seven days, and each AS-STP sample was subjected to metagenomic analysis and a test to examine its biodegrading activities with i-erythritol, 2,2-dimethyl-1,3-propanediol, and putrescine. The AS-STP sample collected on May 24 in 2018 was subjected to a ready biodegradation test to observe changes in the microbiota during biodegradation of DF or AQ. The AS-STP samples collected on Dec 4 in 2018 or Jan 8 in 2019 were subjected to a ready biodegradation test with an increasing volume of test medium for DF or 2-EA, respectively.
All of the AS-CERI samples and the series of “b” samples from the AS-STP samples were subjected to the 301C test with aniline without being adsorbed onto silica gel, using a coulometer with a medium volume of 300 mL in order to examine their biodegrading activities. The series of “a” samples from the AS-STP samples aerated for 0, 1, 3, and 7 days were subjected to the 301F tests with i-erythritol, 2,2-dimethyl-1,3-propanediol, and putrescine to examine their biodegrading activities without being adsorbed onto silica gel, using a coulometer with a medium volume of 900 mL.
In order to investigate changes in the microbiota during biodegradation of the test substances, the 301F test was conducted in triplicate for DF or AQ as a test substance, without being adsorbed onto silica gel, using a coulometer with a medium volume of 900 mL. The test medium was sampled five times for both metagenomic analysis and an HPLC analysis, from the beginning of biodegradation of each test substance until the biodegradation rate reached a plateau, while monitoring the BOD curve.
In order to investigate changes in biodegradation behavior with increasing volumes of test medium, the 301F tests using AS-STP just taken from the STP and 301C tests using AS-CERI just received from CERI were conducted in triplicate with medium volumes of 300, 900, and 3900 mL in the condition that the initial concentrations of the activated sludge and the test substance were kept constant. As a test substance for the 301F test, DF was added to the test medium directly, while 2-EA was adsorbed on silica gel and then added to the test medium. Activated sludge in each test bottle was collected for the metagenomic analysis when the BOD curve measured by a coulometer was rising sharply. As a test substance for the 301C tests, AQ or Bis was added to the test medium directly. Only the tests with Bis for volumes of 900 and 3900 mL were performed using a coulometer and the other tests were conducted using OxiTop® because there was little difference between the coulometer and OxiTop® in terms of BOD values.28)
In order to investigate differences in the local environment within the test bottle, the distribution of oxidation-reduction potential (ORP) in the test bottle was checked near the surface (2 cm below the medium surface), in the middle (at the midpoint between the medium surface and the test bottom), and at the bottom (2 cm above the test bottom), based on the autoxidation of sodium sulfite by pH/ORP meter F72L (HORIBA Advanced Techno, Kyoto, Japan) without adding any activated sludge. This measurement was conducted from addition of the sodium sulfite to the test medium until a stable ORP was obtained by sufficient oxidation of the sodium sulfite for each medium volume. Any change in local pH or dissolved oxygen (DO) during biodegradation of 2-EA was measured at surface or middle with a pH/ORP meter or DO meter B-100BTi (Iijima Electronics Corporation, Aichi, Japan).
4. HPLC analysis
The biodegradability of each test substance was evaluated on the basis of BOD in principle. In order to investigate the change in the microbiota over time during the biodegradation process of DF or AQ, however, the residual amount of the test substance was evaluated supplementally by HPLC as follows: At each sampling time point, 3 mL of the test medium was taken and made up to 5 mL with acetonitrile for DF or tetrahydrofuran for AQ, which was subjected to HPLC analysis using Shimadzu LC-10ADvp and LabSolutions (Shimadzu, Kyoto, Japan). An L-column2 ODS column (150 mm ×2.1 mm, 5 µm, CERI) was used at 40°C. Mobile phase A containing 0.1% formic acid in distilled water and mobile phase B containing 0.1% formic acid in acetonitrile were pumped at a flow rate of 0.2 mL min−1, and the percentage of mobile phase B changed in a linear gradient from 50 to 100% over 16 min. The injection volume and detection wavelength were fixed at 10 µL and 254 nm, respectively.
Results and discussion
1. Metagenomic analyses of AS-CERI and AS-STP without cultivation at our laboratory
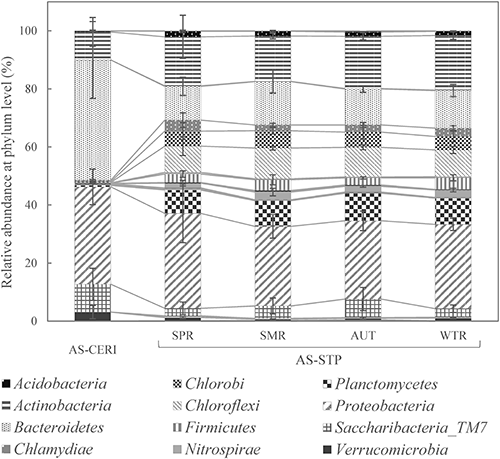
The nine AS-CERI samples and 30 AS-STP samples were subjected to metagenomic analysis on the day they were received from CERI or taken from the STP. Figure 1 shows a comparison of the relative abundance of bacterial species at the phylum level for AS-CERI and AS-STP samples during four seasons: SPR (Mar to May, n=5), SMR (Jun to Aug, n=3), AUT (Sep to Nov, n=8) and WTR (Dec to Feb, n=14). The phylum composition of AS-CERI was more biased in its distribution of phyla than those of AS-STP samples because the sum of just two phyla (i.e., Bacteroidetes and Proteobacteria) represented a massive 80±20% of AS-CERI. The relative abundance of Bacteroidetes in the AS-CERI samples (40±10%) was about three times higher than those in the corresponding AS-STP samples (SPR, SMR, AUT, and WTR: 12±3%, 15±4%, 12±1%, and 13±2%, respectively), and Chloroflexi, Chlorobi, Chlamydiae, Firmicutes, and Nitrospira that were found in AS-STP samples accounted for less than 1.5% in AS-CERI samples. For AS-STP samples, the 12 phyla listed in Fig. 1 represented more than 1% in any season, and no significant difference was detected among the seasons by the Steel-Dwass test (p=0.05), indicating that the microbiota of AS-STP was relatively stable at the phylum level across seasons.
The ASV count represents the number of ASVs observed at least once in a sludge sample. In other words, the more diverse the microorganisms in a sample, the higher the ASV counts.29,30) The ASV count for AS-CERI was 180±30, which was substantially less than those for AS-STP in SPR, AUT, and WTR: 600±100, 620±90, and 530±40, respectively, at a Steel-Dwass test significance level of p=0.05, though the ASV count of 600±100 for SMR did not differ from that for AS-CERI. Regarding the variability of AS-STP samples, there were no significant differences in the ASV counts across the four seasons according to either the Steel-Dwass test or Tukey–Kramer test (p=0.05). In addition, no substantial difference in AS-STP samples was observed among respective years; 2018 (n=4), 2019 (n=8), 2020 (n=11) and 2021 (n=5). The Simpson index is a measure that shows the probability that two randomly selected ASVs in each sludge are different. Namely, the less biased the dominance of each ASV, the larger the Simpson index. The Simpson index of the average AS-CERI was 0.92±0.04, while that of AS-STP was 0.988±0.001 (SPR, SMR, AUT, and WTR: 0.988±0.003, 0.987±0.004, 0.989±0.002, and 0.988±0.002, respectively), indicating that the diversity of AS-CERI was lower than that of AS-STP. There was no significant difference in the Simpson index between any of the seasons according to the Steel-Dwass test (p=0.05), indicating that high diversity was maintained throughout the year in AS-STP samples.
In order to compare the lot-to-lot variability between AS-CERI and AS-STP samples, the standard deviation (SD) of the relative abundance was examined for each phylum. The maximum SD among AS-CERI samples was 20% for Bacteroidetes, followed by 9.4%, 8.5% and 7.6% for Proteobacteria, Saccharibacteria_TM7 and Actinobacteria, respectively, while the maximum SD in AS-STP samples was 6.0% for Proteobacteria. This finding indicated that there was more lot-to-lot variability in AS-CERI than AS-STP. AS-CERI was taken from 10 sites in the natural environment, which had high variability. Although AS-CERI was cultivated with glucose and peptone thereafter, it appeared that the variability of AS-CERI was maintained to some extent and it was higher than that of AS-STP.
2. Metagenomic analyses of AS-CERI and AS-STP cultivated at our laboratory
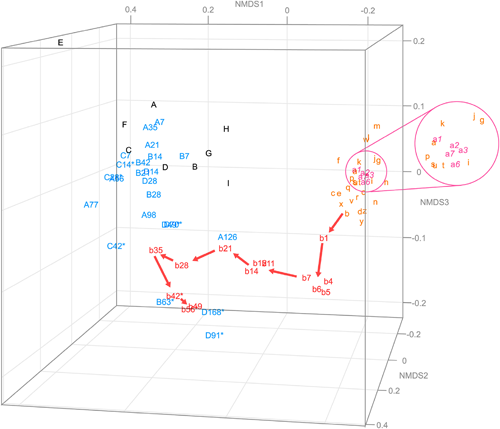
According to the guidelines,1,5) AS-CERI cultivated at CERI for one month or more can be further cultivated with glucose and peptone at each laboratory until the beginning of the 301C test, while AS-STP taken from an STP can be aerated without glucose or peptone for up to seven days at each laboratory. In this section, both AS-CERI and AS-STP were cultivated at our laboratory for various periods of time and subjected to metagenomic analysis. Figure 2 shows an NMDS plot based on the dissimilarity of AS-CERI and AS-STP, where NMDS1 was highly correlated with the ASV count (r=−0.89). Two-dimensional plots of every two NMDS axes and three-dimensional coordinates of NMDS scores are shown in Supplemental Fig. S1 and Table S1, respectively. In the NMDS plot, sludges that are similar to each other are plotted closer together than are dissimilar sludges. AS-CERI was purchased nine times from CERI (“A” to “I” in Fig. 2), and four of these samples (“A” to “D”) were cultivated with glucose and peptone (e.g., “A7” refers to the “A” sample among the AS-CERI samples cultivated for seven days). Although AS-STP was collected 30 times from the STP, only the total number of letters in the alphabet (i.e., 26) were plotted as “a” to “z” in Fig. 2 because the 30 samples were plotted very closely. The “a” sample of the AS-STP samples was aerated without adding glucose and peptone (“a3” refers to the “a” sample of the AS-STP samples aerated for three days), while the “b” sample of the AS-STP samples was cultivated with glucose and peptone (e.g., “b4” refers to the “b” sample of the AS-STP samples cultivated for four days). The asterisks in Fig. 2 indicate that the sludge did not have enough biodegrading activity to meet the validity criteria of the 301C test, which is to biodegrade aniline by more than 40% after 7 days and 65% after 14 days (e.g., “C42*” refers to the “C” sample of the AS-CERI samples cultivated for 42 days that did not have enough biodegrading activity to meet the criteria).1,5)
As described in the previous section, the AS-CERI samples had more lot-to-lot variability than AS-STP samples, based on phylum-level analysis. Figure 2 also shows this, since AS-CERI samples just purchased from CERI (“A” to “I”, in black) were widely distributed on the plot, while each AS-STP sample just taken from an STP (“a” to “z”, in orange) were plotted close together. The average distance between plots for AS-CERI samples was 0.27, 3.7 times greater than that for AS-STP samples (at 0.073). When the four AS-CERI samples were cultivated with glucose and peptone, the ASV counts changed from 215 (“A”) to 88 (“A126”), from 111 (“B”) to 81 (“B63*”), from 154 (“C”) to 101 (“C42*”), and from 157 (“D”) to 70 (“D168*”). AS-CERI samples that did not have enough biodegrading activity were “B63*, C14*, C28*, C42*, D49*, D70*, D91*, and D168*”, and their ASV counts were 81, 121, 97, 101, 81, 98, 85, and 70, respectively, generally falling below 100. These results were obtained as the AS-CERI samples were further converted to a microbiota that was easy to cultivate with glucose and peptone, and their diversity and activity decreased. As a similar phenomenon, CERI reported that AS-STP cultivated with glucose and peptone for a month did not biodegrade branched aliphatic alcohols (i.e., 2,2-dimethyl-1,3-propanediol).31) It appears that prolonged cultivation of activated sludge with monotonous nutrient sources simplified the microbiota and led to a decrease in microorganisms that contribute to the biodegradation of various chemicals.
When the “a” sample of the AS-STP samples was aerated without glucose and peptone for up to seven days, the aerated AS-STP samples (“a1” to “a7”, in pink) were plotted very closely. The ASV counts of the AS-STP samples aerated for 0, 1, 2, 3, 6, and 7 days were 566, 497, 535, 608, 578, and 579, respectively, with no apparent increasing or decreasing trend. In addition, the AS-STP samples aerated for 0, 1, 3, and 7 days biodegraded i-erythritol, 2,2-dimethyl-1,3-propanediol, and putrescine completely, and the lag phase (i.e., the time that elapses before the BOD curve starts to rise, hereinafter defined as the time point when the biodegradation rate rose to 2%) of each aerated AS-STP sample was about 2.5, 4.5, or 8 days for i-erythritol, 2,2-dimethyl-1,3-propanediol, or putrescine, respectively (data not shown). These results show that the aerated AS-STP samples barely changed their microbiota or activities with up to seven days of aeration. In contrast, the AS-STP samples cultivated with glucose and peptone (“b1” to “b56*”, in red) clearly shifted in a negative direction on the NMDS1 plot as the number of days of cultivation increased, and the ASV counts decreased from 625 (Day 0) to 142 (Day 56). The AS-STP samples cultivated for ≥21 days (“b21” to “b56*”) shifted to a distribution similar to that of the AS-CERI samples. Subsequently, the composition of the AS-STP samples cultivated for ≥42 days, among which “b42* and b56*” did not have enough biodegrading activity to meet the criteria, became similar to that of the AS-CERI samples cultivated for longer periods, including “B63*, D91*, and D168*” though “b49” had biodegrading activity sufficient to meet the criteria. These results indicated that the microbiota of AS-STP decreased microbial diversity due to prolonged cultivation with glucose and peptone, becoming similar to that of the AS-CERI samples cultivated for a long time (e.g., “B63* and D168*”), and following prolonged cultivation, both the AS-STP and the AS-CERI samples became similar to each other in terms of community structure. It appears that cultivation with monotonous carbon and nitrogen sources resulted in simplified microbiota for any activated sludge regardless of the diversity at the start of cultivation because microorganisms that could easily utilize the nutrition sources and grow quickly became dominant—as reported by Hiraishi et al. based on the change in quinone profiles32) and by CERI using NGS.31)
3. Change in microbiota during biodegradation of test substances
In order to investigate changes in the microbiota during biodegradation of the test substances, the 301F test was conducted for DF or AQ as a test substance. Figure 3A shows a representative time course of the biodegradation rate based on the measured BOD for DF or AQ and collection time point of the activated sludge (closed diamond: ♦), and other replicates are shown in Supplemental Figs. S2 and S3. Just after the collection of activated sludge, biodegradation rates increased sharply by 2–3% because the test bottle was opened at each time of collection and oxygen was additionally supplied to compensate. The BOD curves rose rapidly from the third day for DF and the eighth day for AQ, respectively, indicating the initiation of rapid biodegradation of each test substance, and finally the BOD curves reached a plateau, indicating the completion of biodegradation. Figure 3B and 3C show the relative abundances of bacterial species at the family level for DF and AQ, respectively, at the beginning of the test and at each collection time point. The graphs show all the families that were present above 0.001% at each time point, and the microbiota on Day 0 for B and C is derived from the same data.
In the case of DF (Fig. 3B), the relative abundance of Sphingomonadaceae increased rapidly from 2.4% (0 day) to 81.1% (7.3 days), and then decreased to 17.8% (21.5 days). Sphingomonadaceae is reported to contain many bacteria such as S. phenoxybenzoativorans or S. aromaticiconvertens (former RW16T) that biodegrade DF.33,34) Our findings closely coincided with those of this report. Because DF was completely biodegraded at 21.5 days based on the HPLC result (i.e., residual rate of DF was 0%), Sphingomonadaceae could not maintain their dominance until 21.5 days due to lack of their nutritional source (i.e., DF). Since the ASV counts at 0, 6, 6.6, 7.3, 8, and 21.5 days were 714, 478, 315, 230, 246, and 288, respectively, diversity generally decreased during DF biodegradation and increased slightly after DF was almost completely biodegraded. In the case of AQ, apart from Sphingomonadaceae, degraders also included Sphingobacteriales_f, Parachlamydiaceae, Myxococcales_f, and Comamonadaceae, and the maximum relative abundances of each family were 43% (10 days), 19.6% (14 days), 8.7% (11 days), 11.3% (14 days) and 5.7% (11 days), respectively (Fig. 3C). In fact, Sphingomonas sp. strain MM-1, Terrimonas genus, and Comamonadaceae; Hydrogenophaga are known to be bacteria capable of biodegrading AQ.35–37) These findings showed that multiple AQ-biodegrading bacteria existed in the test medium and each of them became dominant at some point during the biodegradation process. The ASV counts were 714, 466, 326, 297, 237, and 344, at 0, 8, 10, 11, 14, and 28 days, respectively. Similar to the tendency seen with DF, diversity decreased during the biodegradation of AQ and increased after the completion of biodegradation because the composition of the microbiota changed depending on the presence or absence of their nutritional source (i.e., AQ). Similar behaviors to those described above were observed in the other two replicates for both DF and AQ (data not shown). These results demonstrate an important point that should be taken into account when identifying degraders of a test substance. Generally, the ready biodegradability tests are conducted for a period of 28 days. For some test substances, biodegradation would be completed in less than 28 days, and the BOD curve would reach a plateau at the end of the test. In such a case, at 28 days, the nutritional source for degraders would be insufficient to maintain their dominance, and the microbiota would undergo changes, making it unsuitable for identifying the degraders. In order to accurately identify the degraders of a test substance, it is necessary to examine the microbiota when the test substance is undergoing active biodegradation.
4. Changes in biodegradation rate and microbiota by increasing volume of test medium
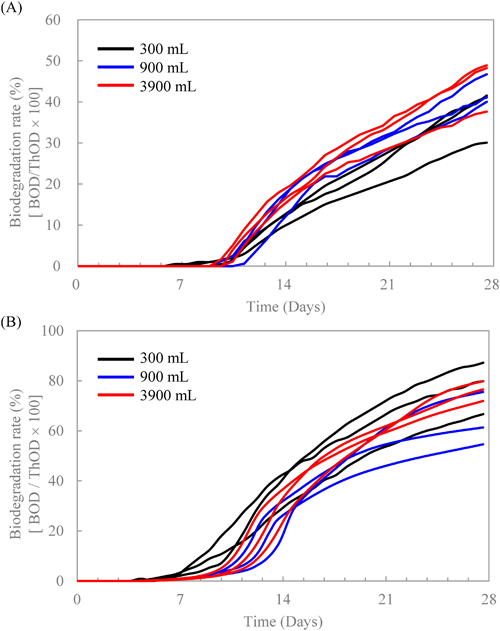
When using AS-STP taken from an STP, Takekoshi et al.8) reported that increasing the amount of test medium accelerated biodegradation of the test substances and decreased variations in biodegradation among replicates. They hypothesized that the acceleration in biodegradation and the decrease in variation were caused by the increasing probability of the presence of many species of degraders, but there was no direct evidence supporting their hypothesis. In this study, we examined whether their hypothesis was correct or not by identifying potential degraders of DF or 2-EA with varying volumes of the test medium (i.e., 300, 900, and 3900 mL).
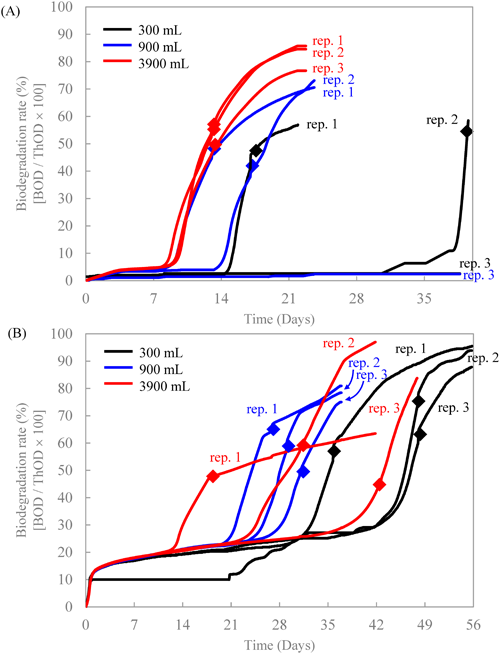
Fig. 4 shows time-dependent biodegradation rates based on the measured BODs for DF (A) and 2-EA (B) at each volume of the test medium measured in triplicate along with collection time points (♦) of the activated sludge. Biodegradation of DF with a test medium volume of 300 or 900 mL was observed in two replicates but not observed at all in one replicate over 40 days, while biodegradation with a volume of 3900 mL was observed in all replicates (Fig. 4A). The lag phases were 14 and 38 days for 300 mL, 9 and 14 days for 900 mL, and 8 to 9 days for 3900 mL. These findings indicated that as the medium volume was increased, the lag phases became shorter, and the variation among triplicates became smaller. The same phenomenon occurred in the study of another substance (i.e., DF) conducted by Takekoshi et al.8) In the case of 2-EA, its biodegradation was observed in all replicates for every volume of the test medium (Fig. 4B). For all tests, the biodegradation curves rose quickly to 10% or more within 24 hr. These rises were attributed to biodegradation of a low amount of residual acetone, since acetone was used to dissolve 2-EA for absorbing onto silica gel and was not completely evaporated under vacuum for 14 days. In addition, one biodegradation curve among the triplicates for 300 mL showed a straight line from 0 to 21 days. It would seem that unidentified mechanical errors occurred during this period. At any rate, the biodegradation of 2-EA started from Day 23 at the earliest, and from Day 40 at the latest for 300 mL; it started from Day 20 at the earliest and from Day 27 at the latest for 900 mL, showing that biodegradation was accelerated by increasing the volume of the test medium. At the maximum volume of 3900 mL, biodegradation of 2-EA started at Day 13 (rep. 1 in Fig. 4B), the earliest of all the replicates for each volume. However, none of the triplicates showed a sufficient reduction in the variability of the lag phases, suggesting that the test medium volume of 3900 mL was not enough to reduce the variability, and a larger volume would be necessary to improve reproducibility.
The metagenomic analyses of the microbiota for the DF and 2-EA tests were performed on the AS-STP samples just taken from the STP (Day 0) and those taken at the time points when BOD curves were rising sharply (♦ in Fig. 4). Tables 1 and 2 show all the bacterial species representing more than 5% of the total bacterial community in any test bottle with medium volumes of 300, 900, and 3900 mL, and their relative abundances (%) in each replicate of the ready biodegradability tests. The number of replicates in Tables 1 and 2 (i.e., rep. 1, 2, or 3) coincides with that in Fig. 4, and dash marks (−) indicate that the relative abundance of each species was less than 0.1%. Since no biodegradation occurred for both rep. 3 of the 300 and 900 mL (Fig. 4), a metagenomic analysis was not conducted. In the case of DF (Table 1), at a test medium volume of 300 mL, Terrimonas increased from 0.6 to 7.0% (rep. 1), S. phenoxybenzoativorans increased from <0.1 to 41.1% (rep. 2), and Sphingobium (ASV No.7) increased from <0.1 to 42.1% (rep. 1), though these bacteria did not increase markedly in the other replicate. In contrast, DQ413108 decreased from 6.6 to 2.7% (rep. 1) or 3.5% (rep. 2). Thus, these results appear to show that Terrimonas, S. phenoxybenzoativorans, and Sphingobium (ASV No.7) definitely contributed to the biodegradation of DF, but these species were unevenly distributed in the two replicates. At a test medium volume of 900 mL, not only Terrimonas and S. phenoxybenzoaticorans but also Sphingobium (ASV No.2) and JN60936433) increased. At a test medium volume of 3900 mL, Sphingomonadaceae (ASV No.1) was also observed to increase. In addition, in the control test without adding DF, the relative abundance of Terrimonas was 1.4%, and other species were not detected (i.e., less than 0.1%). Therefore, it was revealed that more species of bacteria could be detected as potential degraders of DF by increasing the volume of the test medium. In the case of 2-EA (Table 2), at a test medium volume of 300 mL, GU454926, AF358012, Hydrogenophaga, Comamonadaceae (ASV No. 16), Azonexaceae, and Mycobacterium (ASV No.19) clearly increased from Day 0. Mycobacterium (ASV No.11) was additionally detected at a test medium volume of 900 mL, and Pseudomonas, Nocardioides, and G. didemni were additionally detected at a test medium volume of 3900 mL. Although degraders of 2-EA itself have been barely reported, there have been many reports of bacteria that degrade AQ, which shares its main structural features with 2-EA, or anthracene oxidized readily to produce AQ,39) such as Terrimonas genus, and Comamonadaceae; Hydrogenophaga previously described, Pseudomonas sp., Gordonia-like strain BP9, Mycobacterium gilvum VF1, Nocardioides.40–43) Since these substances were considered to have similar metabolic pathways,39,44–46) it appeared that these bacteria could degrade 2-EA. In addition, in the control tests where 2-EA was not added, the relative abundances of GU454926 and AF358012 were only 1.7 and 1.0%, respectively, and other species were not detected (less than 0.1%), suggesting that these species contributed to the biodegradation of 2-EA and would be potential degraders of 2-EA. Since the species detected only at volumes of 900 or 3900 mL were not observed in all replicates, these species did not seem to be distributed uniformly in activated sludge and a small number of these species could be put into a test bottle by increasing the amount of activated sludge. Although the variability of the initiation of biodegradation of 2-EA in 3900 mL was larger than that in 900 mL, little difference in the oxidation rate of sodium sulfite based on the ORP was found at any of the volumes or positions in the test bottle (surface, middle, or bottom), and local differences in DO concentration or pH change were not observed during the biodegradation process (data not shown). By increasing the medium volume from 300 or 3900 mL to 9000 mL with tris(2-ethylhexyl)trimellitate, Takekoshi et al. found that initiation of rapid biodegradation in all of the three replicates for 9000 mL nearly coincided with the earliest one for 300 or 3900 mL.28) In this study, the earliest initiation of rapid biodegradation observed at rep. 1 for 3900 mL did not coincide with the earliest one at rep. 1 for 300 mL or at rep. 1 for 900 mL. It appeared that a test medium volume of 300, 900 or 3900 mL was not sufficient to reduce the variability in this study, suggesting that the initiation of rapid biodegradation would converge to a specific time (e.g., a time observed at rep. 1 for 3900 mL) only if the medium volume was increased further. In addition, as G. didemni was observed only at rep.1 for 3900 mL, this potential degrader might play an important role in biodegradation of 2-EA. At any rate, the reason why biodegradation accelerated as the medium volume increased could be attributed to the differences in the number of degrading bacterial species added to the test bottles. In conclusion, it was revealed experimentally for the first time that the probability of the presence of many species of degraders was increased by increasing the volume of the test medium.
Table 1. Relative abundance of bacterial species in test bottles at medium volumes of 300, 900, and 3900 mL for DF
| ASV No. |
Taxonomy |
Relative abundance (%) |
| Phylum |
Class |
Order |
Family |
Genus |
Species |
(Day 0) |
300 mL |
900 mL |
3900 mL |
| rep. 1 |
rep. 2 |
rep. 1 |
rep. 2 |
rep. 1 |
rep. 2 |
rep. 3 |
| 1 |
Proteobacteria
|
Alphaproteobacteria
|
Sphingomonadales
|
Sphingomonadaceae
|
|
|
— |
— |
— |
— |
— |
30.0 |
— |
— |
| 2 |
Proteobacteria
|
Alphaproteobacteria
|
Sphingomonadales
|
Sphingomonadaceae
|
Sphingobium
|
|
— |
— |
— |
— |
7.4 |
0.2 |
0.3 |
— |
| 3 |
Bacteroidetes
|
Sphingobacteriia
|
NVQB
|
NVQB
|
NVQB
|
JN609364
|
— |
— |
— |
1.7 |
0.7 |
6.6 |
1.6 |
1.6 |
| 4 |
Bacteroidetes
|
Sphingobacteriia
|
Sphingobacteriales
|
Chitinophagaceae
|
Terrimonas
|
|
0.6 |
7.0 |
0.7 |
0.9 |
0.9 |
0.5 |
0.7 |
0.6 |
| 5 |
Chlorobi
|
HQ014634
|
HQ014634
|
HQ014634
|
HQ014634
|
DQ413108
|
6.6 |
2.7 |
3.5 |
4.3 |
8.7 |
5.2 |
4.4 |
4.9 |
| 6 |
Proteobacteria
|
Alphaproteobacteria
|
Sphingomonadales
|
Sphingomonadaceae
|
Sphingobium
|
S. phenoxybenzoativorans
|
— |
— |
41.1 |
40.8 |
— |
5.6 |
40.7 |
42.2 |
| 7 |
Proteobacteria
|
Alphaproteobacteria
|
Sphingomonadales
|
Sphingomonadaceae
|
Sphingobium
|
|
— |
42.1 |
— |
— |
— |
— |
— |
— |
Relative abundances (%) of bacterial species representing more than 5% of the total bacterial community in any test bottle at medium volumes of 300, 900, and 3900 mL for DF, where AS-STP samples were collected on Day 0 and at the time points ♦ shown in Fig. 4. The number of replicates (rep.) coincides with that in Fig. 4, and the dash mark (-) indicates less than 0.1%.
Table 2. Relative abundance of bacterial species in test bottles at medium volumes of 300, 900, and 3900 mL for 2-EA
| ASV No. |
Taxonomy |
Relative abundance (%) |
| Phylum |
Class |
Order |
Family |
Genus |
Species |
(Day 0) |
300 mL |
900 mL |
3900 mL |
| rep. 1 |
rep. 2 |
rep. 3 |
rep. 1 |
rep. 2 |
rep. 3 |
rep. 1 |
rep. 2 |
rep. 3 |
| 8 |
Proteobacteria
|
Gammaproteobacteria
|
Pseudomonadales
|
Pseudomonadaceae
|
Pseudomonas
|
|
— |
— |
— |
— |
— |
— |
— |
— |
— |
9.0 |
| 9 |
Actinobacteria
|
Actinomycetia
|
Propionibacteriales
|
Nocardioidaceae
|
Nocardioides
|
|
— |
— |
— |
— |
— |
— |
— |
— |
1.7 |
12.6 |
| 10 |
Actinobacteria
|
Actinomycetia
|
Corynebacteriales
|
Nocardiaceae
|
Gordonia
|
G. didemni
|
— |
— |
— |
— |
— |
— |
— |
33.0 |
— |
— |
| 11 |
Actinobacteria
|
Actinomycetia
|
Corynebacteriales
|
Mycobacteriaceae
|
Mycobacterium
|
|
— |
— |
— |
— |
20.2 |
— |
— |
— |
0.2 |
— |
| 12 |
Bacteroidetes
|
Sphingobacteriia
|
Sphingobacteriales
|
Chitinophagaceae
|
Terrimonas
|
GU454926
|
1.1 |
3.0 |
13.1 |
7.2 |
4.8 |
3.4 |
5.6 |
10.7 |
7.7 |
4.6 |
| 13 |
Chlorobi
|
HQ014634
|
HQ014634
|
HQ014634
|
HQ014634
|
DQ413108
|
7.8 |
2.6 |
0.1 |
0.3 |
1.7 |
1.1 |
0.2 |
1.2 |
0.6 |
0.3 |
| 14 |
Proteobacteria
|
Alphaproteobacteria
|
Rhizobiales
|
PAC002126
|
PAC002126
|
AF358012
|
0.7 |
5.5 |
6.7 |
2.6 |
6.3 |
5.5 |
12.4 |
4.3 |
7.8 |
3.0 |
| 15 |
Proteobacteria
|
Betaproteobacteria
|
Burkholderiales
|
Comamonadaceae
|
Hydrogenophaga
|
|
— |
— |
28.5 |
3.9 |
— |
— |
0.2 |
0.5 |
0.1 |
15.2 |
| 16 |
Proteobacteria
|
Betaproteobacteria
|
Burkholderiales
|
Comamonadaceae
|
|
|
— |
3.9 |
0.3 |
26.7 |
0.7 |
2.4 |
3.2 |
0.1 |
0.1 |
0.3 |
| 17 |
Proteobacteria
|
Betaproteobacteria
|
Rhodocyclales
|
Azonexaceae
|
|
|
— |
2.1 |
0.2 |
5.5 |
6.1 |
3.2 |
6.2 |
1.5 |
2.7 |
3.1 |
| 18 |
Proteobacteria
|
Gammaproteobacteria
|
Legionellales
|
Coxiellaceae
|
LKHV
|
GQ340280
|
— |
0.5 |
— |
— |
1.0 |
1.3 |
— |
1.0 |
5.2 |
— |
| 19 |
Actinobacteria
|
Actinomycetia
|
Corynebacteriales
|
Mycobacteriaceae
|
Mycobacterium
|
|
— |
19.4 |
24.0 |
14.9 |
0.3 |
21.9 |
17.0 |
— |
— |
— |
Relative abundances (%) of bacterial species representing more than 5% of the total bacterial community in any test bottle at medium volumes of 300, 900, and 3900 mL for 2-EA, where AS-STP samples were collected on Day 0 and at the time points ♦ shown in Fig. 4. The number of replicates (rep.) coincides with that in Fig. 4, and the dash mark (-) indicates less than 0.1%.
When using AS-CERI just received from CERI, the 301C tests with AQ and Bis were conducted in triplicate at test medium volumes of 300, 900, and 3900 mL. Figure 5 shows time-dependent biodegradation rates of AQ (A) and Bis (B) for each volume of the test medium. The reason why AQ and Bis were chosen as a test substance was based on the following findings: we had experienced that DF or 2-EA was not biodegraded in the 301C test at our laboratory due to the low biodegrading activity of AS-CERI, and Takekoshi et al.8) found that AQ or Bis was biodegraded at the percentage of 0 or 21%, respectively, in the 301C test at a test medium volume of 300 mL. Since these percentages contradict the assertion that AQ and Bis are judged to have “ready biodegradability47,48),” we considered that both substances have low reproducibility in the 301C tests and are thus suitable for investigation of the effect of increasing the medium volume. As a result, there was no substantial difference in the lag phases regardless of the medium volume since biodegradation started from Day 10 at the earliest, and from Day 12 at the latest for AQ and from Day 7 at the earliest, and from Day 10 at the latest for Bis. These results were quite different from those of the 301F tests with AS-STP as described above, and it was considered that species of microorganisms in the test medium changed very little, even when the volume of the test medium was increased, because the diversity of microorganisms in AS-CERI was much lower than that in AS-STP.