Abstract
Rice false smut (RFS) caused by Ustilaginoidea virens is widely distributed in major rice-producing regions. Previous studies have shown that treating RFS with chelerythrine can decrease the germination of fungus spores by 86.7% and induce fungal cell apoptosis. In the present study, the effects of chelerythrine on the metabolism of U. virens explored using metabolomics and analyses of differentially accumulated metabolites and altered metabolic pathways. The top 15 metabolites in random forest analysis were significantly different between groups. In positive ion mode, purine, phenylalanine metabolism, phenylalanine, tyrosine, tryptophan biosynthesis, pyrimidine metabolism, and nitrogen metabolism were dominant. Alanine, aspartate, glutamate metabolism, and phenylalanine metabolism were enriched in negative ion mode. Differentially expressed genes and altered metabolic pathways of U. virens were effected by chelerythrine. The findings support future research on the prevention and treatment of RFS by chelerythrine and provide a theoretical basis for targeted drug delivery.
Introduction
Rice false smut (RFS) is a fungal disease of rice affecting booting to heading stages. It is caused by infection of the flower organ by the pathogen Ustilaginoidea virens. The formation of dark green lumps on rice panicles is a typical symptom of this disease. RFS is widely distributed in major rice-producing countries in Africa, South America and Europe, especially in Asian countries.1) RFS is now the main fungal disease in rice-producing areas in China.2) This disease not only affects the yield and quality of rice, but also produces toxins that are harmful to humans and livestock.3)
Chelerythrine is one of the most abundant alkaloids in Chelidonium majus L, a plant that is used in the traditional herbal medicine. Chelidonium majus L. grows in the wet areas of the valley, near the village, roadside and ditch. It is mainly distributed in Heilongjiang, Jilin, Liaoning and Jiangsu, Jiangxi, Henan, Sichuan and other provinces (regions). Chelidonium majus L. whole herb has anti-inflammatory, analgesic, cough and detoxification effects. It was first recorded in “Famine Relief Materia Medica” and was collected in the 1977 edition of “Chinese Pharmacopoeia”. It mainly treats diseases such as stomach pain, whooping cough, snake and insect bites. Chelerythrine is an effective inflammatory inhibitor, which is lethal to cancer cells without affecting normal cells, hence it can improve patient survival.4) Chakraborty et al.5) found that chelerythrine has a strong inhibition effect on mycelial growth of crop pathogens such as Fusarium oxysporum and grey mold. Its pharmacological effects are well documented, including selective protein kinase C inhibition, and anti-inflammatory and anti-tumour activities.6,7)
Among these, its antimicrobial activity has attracted the most attention, but the mechanism of inhibition is poorly understood. The key to the bacteriostatic/antifungal ability of chelerythrine is the existence of C=N+ionic double bonds in its molecular structure, which is extremely rare in natural compounds, inhibiting merosterol biosynthesis in bacteria/fungal, and has the characteristics of strong internal absorption, wide spectrum, high efficiency and long holding period. The steady progress of disease control by plant-source pesticides has provided a new direction for the research and development of new, environmentally friendly and sustainable pesticides. However, most of the current studies on chelerythrine only stay in the in vitro testing stage of pathogenic fungal, and the antifungal molecular mechanism of chelerythrine is less studied. This study provides a reference for the development of plant source pesticides and green prevention and control of rice false smut. Our previous studies showed that chelerythrine inhibits fungus spore germination by up to 86.7%, and it induces apoptosis of U. virens cells.8) Over the past few years, chemical pesticides have constituted the most effective method to control crop diseases. They have played a prominent role in controlling phytopathogenic fungi. However, repeated use of chemical pesticide over a long period of time may result in pesticide resistance and harmful residues. Therefore, it is worth developing to relieve reliance on chemical pesticides and it is necessary to develop environmentally compatible botanical pesticides to attenuate crop disease.8) Developing chelerythrine as a green biological pesticide would be of great significance for agricultural production and environmental enhancement.
In the present study, the effects of chelerythrine on the metabolism of U. virens were investigated by metabolomics based on ultra-pressure liquid chromatography coupled to tandem mass spectrometry (UPLC-MS/MS) and analysing differentially accumulated metabolites and altered metabolic pathways. Further studies on the mechanism of action could facilitate chelerythrine pesticide-based control of RFS.
Materials and methods
1. Reagents, media and strainsWe extracted chelerythrine as previously described.8) Methyl alcohol, methanoic acid and ammonium acetate were purchased from Thermo Fisher (Shanghai, China), and water was from Merck (Beijing, China).
Magnaporthe oryzae and Cochliobolus miyabeanus strains were kindly provided by the Northeast Agricultural University (Harbin, China) and the Xinyang College of Agriculture and Forestry (Xinyang, China), respectively. Aspergillus ruber strains used in this study were preserved strains from the Northeast Forestry University Microbial Preservation Center (Harbin, China). U. virens strains were kindly provided by the Harbin Institute of Technology (Harbin, China). The M. oryzae, C. miyabeanus and A. ruber strains were incubated in potato dextrose agar (PDA) medium. U. virens strains were cultured in potato sucrose agar (PSA) or potato sucrose (PS) medium.9) All fungi were cultured at 28°C.
2. Antifungal activity in vitroThe extract (CHE) was dissolved in DMSO and the solution was added to sterilized PSA (or PDA) medium to acquire drug media with a sequence of CHE concentrations of 0.005 mg/mL, 0.0075 mg/mL, and 0.01 mg/mL. Media without extract (CHE) were used as controls, and each treatment was repeated 3 times. After 10 days of observation, colony diameters (cm) were measured. The inhibition rate of mycelium growth was checked on the basis of the formula below10): Median EC50 was determined using to the same method as described above.11)
where 0.8 is the diameter of the phytopathogenic fungi disk, and dc and ds are the diameters of fungal colonies in control and CHE-treated groups.
3. Effects of chelerythrine on the metabolism of U. virensU. virens was cultured in PS medium at 28°C for 10 days followed by incubation with 0.0075 mg/mL of chelerythrine for 24 hr. Negative controls without chelerythrine were included in parallel. Samples were centrifuged, supernatants were discarded, and pellets were placed in Eppendorf tubes and resuspended in prechilled 80% methanol by vortexing on ice for 30 sec. After sonication for 6 min, lysates were centrifuged at 5,000 g for 1 min at 4°C. The supernatant was freeze-dried and dissolved in 10% methanol, and an aliquot was injected into the LC-MS/MS system.12,13) There are 6 biological replicate runs performed.
UPLC-MS/MS analyses were performed using a Vanquish UHPLC system (Thermo Fisher, Shanghai, China) coupled to an Orbitrap Q Exactive HF mass spectrometer (Thermo Fisher, Shanghai, China). Samples were injected onto a Hypesil Gold column (100×2.1 mm, 1.9 µm) over a 17 min linear gradient at a flow rate of 0.2 mL/min. Eluents for positive ion mode were buffer A (0.1% formic acid in water) and buffer B (methanol). Eluents for negative ion mode were buffer A (5 mM ammonium acetate, pH 9.0) and buffer B (methanol). The solvent gradient was 2% B for 1.5 min, 2–100% B over 12.0 min, 100% B for 14.0 min, 100–2% B over 14.1 min, 2% B for 17 min. The MS instrument was operated in positive and negative ion modes with a spray voltage of 3.2 kV, a capillary temperature of 320°C, a sheath gas flow rate of 40 arb and an aux gas flow rate of 10 arb. The method was carried out as previously described.12,13)
4. Data processing and metabolite identificationRaw data files generated by UPLC-MS/MS were processed using Compound Discoverer 3.1 (CD3.1, Thermo Fisher) to perform peak alignment, peak picking, and quantitation for each metabolite. The main parameters were retention time tolerance 0.2 min, actual mass tolerance 5 ppm, signal intensity tolerance 30%, signal/noise ratio 3, minimum intensity. Peak intensities were normalised to the total spectral intensity, and normalised data were used to predict the molecular formula based on additive ions, molecular ion peaks and fragment ions. Peaks were matched using mzCloud (https://www.mzcloud.org/), mzVault and MassList databases to obtain accurate qualitative and relative quantitative results. The method was carried out as previously described.12,13)
5. Data analysisMetabolites were annotated using the Kyoto Encyclopedia of Genes and Genomes (KEGG) database (https://www.genome.jp/kegg/pathway.html), the human metabolome database (HMDB) (https://hmdb.ca/metabolites) and the lipid maps database (http://www.lipidmaps.org/). Data normalisation, principal component analysis (PCA), partial least squares discriminant analysis (PLS-DA), orthogonal partial least squares discriminant analysis (OPLS-DA), random forest (RF) and support vector machine (SVM) were performed with the R package MetaboAnalystR.14) To acquire normal distributions, the normalisation function in MetaboAnalystR was employed with MedianNorm, LogNorm and AutoNorm selected. We applied a univariate analysis (t-test) to calculate statistical significance (p-value). Metabolites with VIP (value importance in projection) >1, p<0.05 and log2 (Fold Change) >1 were considered differential metabolites.
For clustering heatmaps, data were normalised as z-scores and plotted by Pheatmap package in R language. A volcano plot was used to filter metabolites of interest based on log2 (fold Change) and -log10 (p-value), conducted by the R package ggplot2. Metabolites with p<0.05 (t-test) were used to conduct an overrepresentation enrichment analysis (ORA), and the resulting KEGG pathways with p<0.05 (ORA) were considered statistically significant.
Results
1. Antifungal effects of CHE on fungal growthCHE exhibited significant antifungal activity against four fungal pathogens of rice (Table 1). With increasing CHE concentration, inhibition was significantly increased. At 0.0075 mg/mL, the inhibition rate was >50% against U. virens and C. miyabeanus. When the concentration was 0.01 mg/mL, inhibition rates were 69.2% against U. virens, 26.7% against M. oryzae and 36.8% against A. ruber. Overall, CHE exhibited significant inhibition at low dosage of 0.0075 mg/mL.
Table 1. Inhibitory effect of CHE extract on 4 kinds of fungal pathogens of rice grown on specific media.
| Pathogens | 0.005 mg·mL−1 | 0.0075 mg·mL−1 | 0.01 mg·mL−1 |
|---|
| U.virens | 25.2%±0.01a | 56.1%±0.013b | 69.2%±0.02c |
| A.ruber | 28.9%±0.015a | 32.8%±0.018b | 36.8%±0.02c |
| M.oryzae | 12%±0.016a | 17.3%±0.025b | 26.7%±0.02c |
| C.miyabeanus | 34.7%±0.027a | 55.3%±0.022b | 58.8%±0.01c |
Means±S.D. of three independent experiments, followed by the different letters within a row are significantly different according to ANOVA test with p≤0.05.
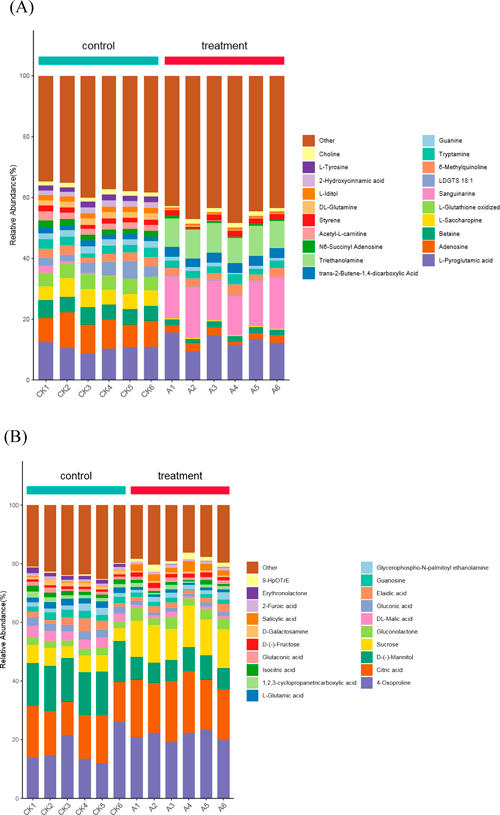
Computational and structural differences between metabolites in different groups are visualized in Fig. 1. We detected 1153 features (740 in positive and 413 in negative ionisation mode), and the top 20 most abundant metabolites were shown in Fig. 1. In Fig. 1A and 1B, elucidate the metabolic profiles of the top 20 most abundant metabolites among the two samples. They are sanguinarine, triethanolamine, adenosine and so on in positive mode and D-(−)-Mannitol, sucrose and so on in negative ionisation mode. It is likely that alterations in the profiles of certain metabolites are attributable to the chelerythrine treatment on U. virens.
Some of the identified metabolites play specific roles in U. virens treated with chelerythrine, such as hormones and vitamins. We annotated all metabolites using KEGG database BR08001 to infer the biological roles played by the metabolites (Fig. 2).
Metabolites detected by positive ion mode were divided into nine categories; control vs. treatment peptides were 46.27% vs. 58.55%, nucleic acids were 43.39% vs. 27.62%, vitamins and cofactors were 4.56% vs. 4.23%, and carbohydrates were 3.89% vs. 7.85%. Metabolites detected by negative ion mode were divided into eight categories; control vs. treatment organic acids were 50.45% vs. 49.76%, carbohydrates were 21.51% vs. 34.13%, nucleic acids were 9.14% vs. 5.40%, lipids were 8.14% vs. 6.32%, and peptides were 6.85% vs. 3.69%.
3. Principal component analysisPCA was performed on the identified metabolites, and structural differences between metabolites in different samples (Treatment group: U. virens was incubated with 0.0075 mg/mL of chelerythrine and control group: without chelerythrine) were inferred. In the PCA diagram (Fig. 3), the specific differentially expressed metabolites are adenosine, sanguinarine and triethanolamine in positive ion mode compare with control groups. In negative ion mode, sucrose, 4-Oxoproline and citric acid are the specific differentially expressed metabolites.
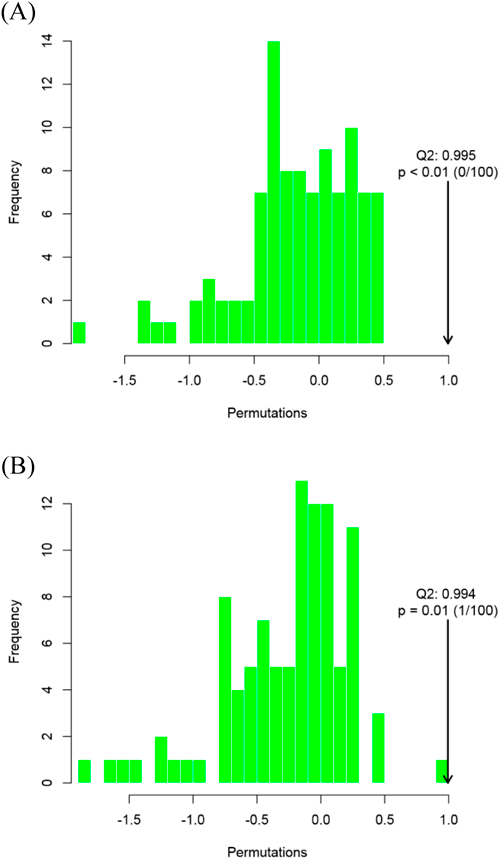
In order to accurately identify differential metabolites, an OPLS-DA model was used to analyse the metabolomic data. The R2Y and Q2) values were close to 1 (in positive ion mode, R2X=0.744, R2Y=1, Q2)=0.995; in negative ion mode, R2X=0.776, R2Y=0.999, Q2)=0.994). This showed that the OPLS-DA model was stable and highly reliable for this dataset, and could be confidently used to explore differences between treatment and control groups (Fig. 4).
4. Random forest analysisIn random forest analysis, mean decrease in accuracy and mean decrease in gini index are used to measure the importance of discriminant groupings of metabolites. The value of a metabolite is converted to a random number, and the reduction in prediction accuracy of the random forest is the mean decrease accuracy; the larger these two values are, the greater the importance of metabolites in the random forest. Figure 5 shows the 15 most important metabolites in the random forest, and these metabolites should be significantly different between groups.
In positive ion mode, Phosphatidylcholine (PC) (18:3e/22:6) is the most important metabolite. Compared with control groups, PC (18:3e/22:6), n-tetradecanamide, 9-oxo-ode, n1-(2-amino-2-oxoethyl)-2-phenoxyacetamide, 2-phenylglycine, pc (18:0/19:2) and isoproterenol were upregulated in treatment groups. Meanwhile, pantothenic acid, feruloyl putrescine, PC (16:2e/2:0), TNK, ILK, 3-(3,4-dihydroxyphenyl) propanoic acid, 1-[5-(2-phenyleth-1-ynyl)-2-thienyl]ethan-1-one oxime, and geranyl pp were less abundant. In negative ion mode, 5-(tert-butyl)-2-methyl-n-(5-methyl-3-isoxazolyl)-3-furamide was the most important metabolite. Compared with control groups, melatonin, 2-(formylamino)benzoic acid, undecanedioic acid, palmitic acid, n-acetyl-l-ornithine, d-glucuronic acid, sucrose, and 15(R), 19(R)-hydroxy prostaglandin F1α were upregulated in treatment groups. Meanwhile, 5-(tert-butyl)-2-methyl-n-(5-methyl-3-isoxazolyl)-3-furamide, mag (18:4), 12-hydroxydodecanoic acid, phloretin, sorbitan monostearate, 5′-deoxy-5′-(methylthio) adenosine and 5-s-cysteinyldopaquinone were downregulated.
5. Pathway enrichment analysisThe purpose of enrichment analysis is to search for biological pathways that play key roles in a biological process, and thereby reveal the basic molecular mechanisms of the biological processes in response to chelerythrine. Prior to enrichment analysis, we selected certain metabolites, mainly those that differed significantly between groups (t-test, P< 0.05), and explored which metabolic pathways (KEGG species-specific metabolic pathways, slightly different metabolic pathways in different species) these metabolites are related to by calculating the ORA and p-values of the metabolic pathways, In this way, we determined whether the metabolites of concern (significantly differential metabolites) were significantly enriched in these metabolic pathways. The metabolic pathway with significant enrichment of differential metabolites is shown in Fig. 6. These metabolic pathways may be important in the biological processes studied. According to the fold enrichment value ordered from higher to lower, in positive ion mode, differential metabolites were significantly enriched in 33 metabolic pathways, the top six of which were phenylalanine, tyrosine and tryptophan biosynthesis, biotin metabolism, phenylalanine metabolism, nitrogen metabolism, pyrimidine metabolism, and pantothenate and CoA biosynthesis. In negative ion mode, differential metabolites were significantly enriched in 52 metabolic pathways, the top six of which were alanine, aspartate and glutamate metabolism, lipoic acid metabolism, phenylalanine metabolism, cyanoamino acid metabolism cyanoamino, D-Arginine and D-ornithine metabolism, and pantothenate and CoA biosynthesis.
6. Topology analysisTopological analysis is performed to determine whether a metabolic pathway plays a key role in the biological process under study. The metabolic pathways in blue in Fig. 7 are prominent in the ORA results, and the vertical axis shows the impact of these metabolic pathways in the topological analysis. In positive ion mode, purine metabolism (map00230), phenylalanine metabolism (map00360), phenylalanine, tyrosine and tryptophan biosynthesis (map00400), pyrimidine metabolism (map00240) and nitrogen metabolism (map00910) play key roles. Alanine, aspartate and glutamate metabolism (map00250) and phenylalanine metabolism (map00360) play key roles in negative ion mode.
Discussion
1. CHE exhibited significant inhibition at low dosageIn our previous studies, at a CHE concentration of 0.017 mg/mL, the inhibition rates of Septoria microspora Speg. Spores and Curvularia lunata were 96.67% and 84.94%, respectively.15) CHE achieved more potent inhibition of the mycelia of U. virens than A.ruber, M.oryzae and C.miyabeanus when concentration of CHE was 0.0075 mg/mL in the present study. In our previous study, compared to chelidonidine, sanguinarine and validamycin, CHE remarkably inhibited mycelial growth of U.virens at the concentrations of 0.0075 mg/mL. The inhibition of CHE was better than that of the commercial fungicide validamycin. Overall, CHE could be developed to botanical pesticides to relieve reliance on chemical pesticides.8) Thus, CHE possesses good antimicrobial activity and has great potential for controlling plant diseases.
2. Chelerythrine treatment alters the abundance of key metabolitesThe effects of metabolites on metabolic pathways can be estimated by topology analysis. For example, if there are no other metabolites or genes downstream of a metabolite in a metabolic pathway, then we can deduce that the effect of this metabolite on the metabolic pathway is negligable. Conversely, if a metabolite is very close upstream and there are many other metabolites and genes downstream, then the metabolite can be considered to have a large effect on the metabolic pathway.
In this study, UPLC-MS/MS was employed to investigate changes in metabolism in U. virens following treatment with chelerythrine. PCA and OPLS-DA results showed revealed obvious differences between treatment and control groups, and combining differential metabolites and enriched pathways showed that treatment with chelerythrine reduced stress resistance of the pathogen, and eventually led to cell apoptosis, consistent with previous reports.8)
We identified the 15 most important metabolites in the random forest analysis. Phosphatidylcholine (PC) is the most abundant phospholipid in the eukaryotic cell membrane. It plays an important role in cell proliferation and differentiation, and it is of great significance in controlling the cell cycle and apoptosis. Some diseases, such as cancer, Alzheimer’s disease and stroke, are closely related to abnormal PC metabolism. Following chelerythrine treatment group, PC levels were increased, a change in PC content indicates a change in the resistance of pathogens to external stimuli. Thus, PC can serve as a target for the prevention and treatment of RFS.16) The organic acid 2-phenylglycine and its derivatives can inhibit fungal mycelia growth and spore germination. The content of 2-phenylglycine was increased following chelerythrine treatment, indicating that the growth of U. virens was inhibited, consistent with laboratory results.17) Pantothenic acid is a disease resistance metabolite, and its downregulation weakens the ability of pathogens to resist external drug stress.18) Feruloyl putrescine, a diamine that is toxic to the human body, is mainly synthesised by microorganisms through ornithine decarboxylase and arginine decarboxylase pathways, and its downregulation diminishes virulence.19)
Negative ion mode identified melatonin, an indole hormone. Melatonin protects cell structure, prevents DNA damage, and reduces peroxide levels by scavenging free radicals, resisting oxidation, and inhibiting lipid peroxidation.20) Melatonin has obvious antagonistic effects on tissue damage caused by peroxidation and free radicals produced by exogenous substances.20) Following chelerythrine treatment group, melatonin levels were increased, indicating that defences were triggered in pathogen cells.
Undecanedioic acid exerts important effects on key processes such as cell wall function, membrane assembly, lipid metabolism, pathogenesis, and even mRNA processing. Undecanedioic acid was more abundant in the chelerythrine treatment group, indicating that the drug affected cell membrane synthesis.21) Conversely, chelidonine treatment lowered the abundance of 5-(tert-butyl)-2-methyl-N-(5-methyl-3-iSoxazolyl)-3-furamide, which regulates cell growth.22) Monoacylglycerol (MAG), a lipid metabolite that participates in cell membrane synthesis and is linked to self-repair,23) was downregulated by chelerythrine treatment.
3. Chelerythrine treatment alters metabolic pathwaysMetabolic pathway mapping can intuitively reflect upstream and downstream relationships, modes of action, and the metabolic pathway topological structure of metabolites, as well as identify genes associated with metabolites. Figure 7 shows metabolic pathways containing only metabolites, and red metabolites are the metabolites of concern (i.e., metabolites with significant differences between groups).
The key role of phenylalanine metabolism (map00360) was detected in both positive and negative ion modes. Specifically, 2-(formylamino)benzoic acid, which was upregulated by chelerythrine treatment, was one of the top 15 metabolites in random forest analysis, and this compound has antifungal activity. Adding uridine 5′-monophosphate can block conserved phosphorylation sites in the activation loop of BIK1 and RIPK, reducing their kinase activity, and consequently inhibiting downstream signalling.24) Deoxycytidine may restore MEG3 mRNA expression levels by reversing MEG3 promoter hypermethylation in bladder cancer cells, thereby inducing apoptosis.25) 5-Methylcytosine (m5C) is a common epigenetic modification with roles in eukaryotes, and m5C-related genes play a critical role in tumour progression in ovarian cancer.26) Further analysis of m5C methylation could provide a novel targeted therapy for treating ovarian cancer.
In this study, metabolomics was used to study differences in metabolites and metabolic pathways in U. virens following treatment with chelerythrine. The results could support the prevention and treatment of RFS, and provide a theoretical basis for targeted drug delivery.
Acknowledgements
Magnaporthe oryzae and Cochliobolus miyabeanus strains were kindly provided by the Northeast Agricultural University (Harbin, China) and the Xinyang College of Agriculture and Forestry (Xinyang, China), respectively. Aspergillus ruber strains used in this study were preserved strains from the Northeast Forestry University Microbial Preservation Center (Harbin, China). U. virens strains were kindly provided by the Harbin Institute of Technology (Harbin, China).
Declarations
Ethics approval and consent to participate: All methods were performed in accordance with the relevant guidelines and regulations.
Consent for publication: Not applicable
Availability of data and materials: All data generated or analysed during this study are included in this published article and its supplementary information files.
Competing interests: The authors declare no competing financial interests.
Funding: This research was funded by subject of 2023 Heilongjiang Provincial Scientific Research Project (Youth Project), CZKYF2023-1-C016 (China).
Author contributions: Qinghui Wei proposed the conceptualization, methodology, writing-review & editing, resources, writing-original draft preparation and gained acquisition of the financial support for the project leading to this publication. Investigation, formal analysis, data curation were performed by Qinghui Wei, Weifeng Song, Zhiyong Li, Yaqing Pan, Xihai Zhai, Baoying Li, Zhanli Jiao, Zhenghao Shi and Jiangtao Yu. All authors have read and agreed to the published version of the manuscript.
References
- 1) S. A. Brooks, M. M. Anders and K. M. Yeater: Effect of cultural management practices on the severity of false smut and kernel smut of rice. Plant Dis. 93, 1202–1208 (2009).
- 2) F. Rongtao, W. Jian, L. Daihua, G. Xueshu and Z. Hong: Research progress of rice false Smut (Ustilaginoidea virens) at home and abroad. Zhongguo Nongxue Tongbao 32, 189–194 (2016).
- 3) E. Tanaka, T. Ashizawa, R. Sonoda and C. Tanaka: Villosiclava virens gen. nov., comb. nov., teleomorph of Ustilaginoidea virens, the causal agent of rice false smut. Mycotaxon 106, 491–501 (2008).
- 4) B. Hu, G. Xu, Y. Zheng, F. Tong, P. Qian, X. Pan, X. Zhou and R. Shen: Chelerythrine attenuates renal ischemia/reperfusion-induced myocardial injury by activating CSE/H2S via PKC/NF-κB pathway in diabetic rats. Kidney Blood Press. Res. 42, 379–388 (2017).
- 5) M. Chakraborty, S. M. F. Rabby, D. R. Gupta, M. Rahman, S. K. Paul, N. U. Mahmud, A. A. M. Rahat, L. Jankuloski and T. Islam: Natural protein kinase inhibitors, staurosporine, and chelerythrine suppress wheat blast disease caused by magnaporthe oryzae triticum. Microorganisms 10, 1186 (2022).
- 6) A. Saavedra, S. Fernández-García, S. Cases, M. Puigdellívol, R. Alcalá-Vida, N. Martín-Flores, J. Alberch, S. Ginés, C. Malagelada and E. Pérez-Navarro: Chelerythrine promotes Ca2+ dependent calpain activation in neuronal cells in a PKC-independent manner. Biochim. Biophys. Acta, Gen. Subj. 1861, 922–935 (2017).
- 7) Y. Zhu, Y. Pan, G. Zhang, Y. Wu, W. Zhong, C. Chu, Y. Qian and G. Zhu: Chelerythrine inhibits human hepatocellular carcinoma metastasis in vitro. Biol. Pharm. Bull. 41, 36–46 (2018).
- 8) Q. H. Wei, D. Z. Cui, X. F. Liu, Y. Y. Chai, N. Zhao, J. Y. Wang and M. Zhao: In vitro antifungal activity and possible mechanisms of action of chelerythrine. Pestic. Biochem. Physiol. 164, 140–148 (2020).
- 9) W. Guo, Y. Gao, Z. Yu, Y. Xiao, Z. Zhang and H. Zhang: The adenylate cyclase UvAc1 and phosphodiesterase UvPdeH control the intracellular cAMP level, development, and pathogenicity of the rice false smut fungus Ustilaginoidea virens. Fungal Genet. Biol. 129, 65–73 (2019).
- 10) J. M. Egan, A. Kaur, H. A. Raja, J. J. Kellogg, N. H. Oberlies and N. B. Cech: Antimicrobial fungal endophytes from the botanical medicine goldenseal (Hydrastis canadensis). Phytochem. Lett. 17, 219–225 (2016).
- 11) R. Yang, Z. F. Gao, J. Y. Zhao, W. B. Li, L. Zhou and F. Miao: New class of 2-aryl-6-chloro-3,4-dihydroisoquinolinium salts as potential antifungal agents for plant protection: synthesis, bioactivity and structure–activity relationships. J. Agric. Food Chem. 63, 1906–1914 (2015).
- 12) C. A. Sellick, R. Hansen, G. M. Stephens, R. Goodacre and A. J. Dickson: Metabolite extraction from suspension cultured mammalian cells for global metabolite profiling. Nat. Protoc. 6, 1241–1249 (2011).
- 13) M. Yuan, S. B. Breitkopf, X. Yang and J. M. Asara: A positive/negative ion-switching, targeted mass spectrometry-based metabolomics platform for bodily fluids, cells, and fresh and fixed tissue. Nat. Protoc. 7, 872–881 (2012).
- 14) J. Chong and J. Xia: MetaboAnalystR: an R package for flexible and reproducible analysis of metabolomics data. Bioinformatics 34, 4313–4314 (2018).
- 15) Q. H. Wei, M. Zhao and X. Y. Li: Extraction of Chelerythrine and its Effects on Pathogenic Fungus Spore Germination. Pharmacogn. Mag. 13, 600–606 (2017).
- 16) P. A. Chang, W. Z. Qin and J. M. Wei: Phosphatidylcholine and cell cycle. Chin. J. Biochem. Mol. Biol. 22, 947–952 (2006).
- 17) S. Yoshida, T. Honjo, K. Iino, R. Ishibe, S. Leo, T. Shimada, T. Watanabe, M. Ishikawa, K. Maeda, H. Kusuhara, N. Shiraki and S. Kume: Generation of human-induced pluripotent stem cell-derived functional enterocyte-like cells for pharmacokinetic studies. Stem Cell Reports 16, 295–308 (2021).
- 18) D. Corinti, B. Chiavarino, D. Scuderi, C. Fraschetti, A. Filippi, S. Fornarini and M. E. Crestoni: Molecular properties of bare and microhydrated vitamin B5–calcium complexes. Int. J. Mol. Sci. 22, 692 (2021).
- 19) M. Valette, M. Rey, F. Gerin, G. Comte and F. Wisniewski-Dyé: A common metabolomic signature is observed upon inoculation of rice roots with various rhizobacteria. J. Integr. Plant Biol. 62, 228–246 (2020).
- 20) H. Tang, X. Shi, P. Zhu, W. Guo, J. Li, B. Yan and S. Zhang: Melatonin inhibits gallbladder cancer cell migration and invasion via ERK-mediated induction of epithelial-to-mesenchymal transition. Oncol. Lett. 22, 609 (2021).
- 21) A. Rossi, M. P. Martins, T. A. Bitencourt, N. T. A. Peres, C. H. L. Rocha, F. M. G. Rocha, J. Neves-da-Rocha, M. E. R. Lopes, P. R. Sanches, J. C. Bortolossi and N. M. Martinez-Rossi: Reassessing the use of undecanoic acid as a therapeutic strategy for treating fungal infections. Mycopathologia 186, 327–340 (2021).
- 22) W. D. Bian, A. Chai, S. R. Yu and S. J. Xue: Synthesis and herbicidal activities of 1,3,4-thiadiazole derivatives of 5-(fluoro-substituted phenyl)-2-furamide. Chin. J. Org. Chem. 28, 1475–1478 (2008).
- 23) M.M Xu: Study on antibacterial mechanism of monoglycerol galactosyl laurate against Bacillus spp. Nanjing agri university (2019).
- 24) F. Feng, F. Yang, W. Rong, X. Wu, J. Zhang, S. Chen, C. He and J.-M. Zhou: A Xanthomonas uridine 5′-monophosphate transferase inhibits plant immune kinases. Nature 485, 114–118 (2012).
- 25) Y. Jiang, B. Chen, J. Wu, J. Wang and X. Zhang: Effects of 5-aza-2-deoxycytidine on reversing hypermethylation of MEG3 gene promoter and apoptosis in bladder cancer cells. Zhejiang Medical Journal 43(12), 1284–1286, 1294, 1368 (2021).
- 26) L. Wang and S. Gao: Identification of 5-methylcytosine-related signature for predicting prognosis in ovarian cancer. Biol. Res. 54, 18 (2021).