Abstract
Using the fugacity model InPestCFD, we predicted the indoor behavior of an active substance in an aerosol intended for controlling flies and mosquitoes under various conditions and conducted a comprehensive risk assessment. In predicting behavior, we examined the impact of spraying methods, room air exchange rates, position of an air inlet, and location of a bed, revealing spatiotemporal behaviors not observed previously. For the risk assessment, we predicted the exposure levels for adults and children based on different scenarios from the predicted concentrations and compared them with the acceptable levels of the active substance. Comparison of the obtained results with the results of risk assessment currently conducted in Japan and the United States revealed that current guidelines are considerably conservative in the United States and sufficiently conservative in Japan.
Introduction
Aerosol sprays containing active substances intended for controlling flies and mosquitoes are used widely throughout the world. However, risk assessments of these active substances based on guidelines1–3) might not fully reflect realistic scenarios. For example, the U.S. Environmental Protection Agency’s (US EPA) guideline represents the decay of airborne concentrations after indoor use solely through air exchange2) and assumes that all sprayed active substances settle on the floor.2) Similarly, the European Chemicals Agency’s guideline also assumes that all sprayed active substances settle on the floor.3) In reality, aerosol particles containing active substances are released and deposited not only on the floor but also on walls and ceilings owing to the effects of gravity and airflow.4) Additionally, the size of the aerosol particles diminishes as the solvent components volatilize,5) and they are also emitted together with the exhaust air.6) The Japan’s guideline states that risk will be assessed by measuring the average concentration after spraying aerosols in a 6-tatami size (approximately 9.72 m2) room with an air exchange rate of 0.5 hr−1 and measuring the air concentration as representatively as possible across the indoor space over time.1) However, the spraying methods and indoor environmental conditions are not fully specified in the guideline. In practice, despite widespread use of aerosol sprays for controlling flies and mosquitoes, the detailed spatiotemporal behavior of the active substances after use remains inadequately understood, and current risk assessment methods might not fully account for real-world conditions. For example, they do not consider the spraying method, such as whether the aerosol is applied in one direction or distributed evenly by rotating the spray. They also overlook factors for indoor environmental conditions such as the position of air inlets, arrangement of furniture in the room, and behavior of residents, i.e., whether they remain active or go to sleep after spraying the aerosol.
We have developed a model, InPestCFD, to predict the indoor behavior of active substances when spraying aerosols intended to control for flies and mosquitoes.7) This predictive model combines a fugacity model,8,9) which predicts the transfer of an active substance among aerosol particles and to the air, floor, walls, and ceiling, with a computational fluid dynamics (CFD) model for calculating indoor airflow.10) By incorporating CFD, the model successfully captured detailed variations in concentration across both time and space, and the predicted values closely matched the measured values.7)
The objectives of this study were to investigate, using InPestCFD, how the spraying methods and indoor environmental conditions might affect the behavior of an active substance; to estimate the exposure levels of residents based on the predicted behavior of the active substance under various conditions, and to conduct risk assessments using these exposure levels; and to compare the results of these risk assessments with those from conventional assessment methods.
Materials and methods
The methods are described in the following order: first, the measurement method for the indoor behavior of the active substance after spraying, conducted in accordance with Japan’s guideline; second, the conventional method used by the US EPA for determining the behavior of an active substance; third, the InPestCFD simulation method for predicting the behavior of the active substance under the same conditions as the experiment; fourth, the InPestCFD simulation method for predicting the behavior of the active substance under different spraying methods and indoor conditions from those in the experiment; fifth, the method for estimating exposure levels using the predicted behavior of the active substance; and finally, the method for conducting risk assessments based on these exposure levels.
1. Measurements of active substance behaviorAccording to the Ministry of Health, Labour and Welfare’s “Guideline for Risk Assessment Methods for Indoor Use of Insecticides as Over-the-Counter Drugs and Quasi-Drugs (Draft),”1) risk assessments are conducted based on results obtained by following the “Guideline for Measuring Indoor Air Concentrations of Insecticides as Over-the-Counter Drugs and Quasi-Drugs.”11) The guideline specifies that measurements should be conducted in a 6-tatami size room under air exchange conditions of 0.5 hr−1, taking into account the type and characteristics of the product, to obtain values that represent the average concentration across the indoor space as technically feasible.
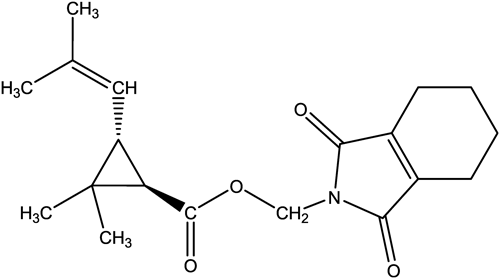
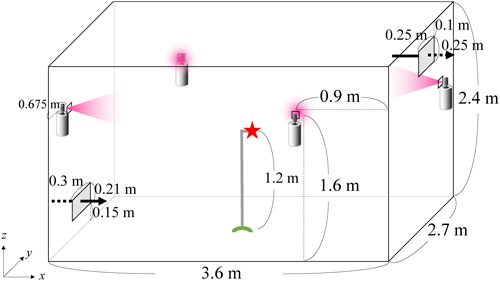
Therefore, an aerosol for controlling flies and mosquitoes that containing d-tetramethrin (Neo-pynamin Forte™, C19H25NO4, (1,3,4,5,6,7-hexahydro-1,3-dioxo-2H-isoindol-2-yl)methyl(1R)-cis-trans-2,2-dimethyl-3-(2-methyl-1-propenyl)cyclopropanecarboxylate; Fig. 1) as the active substance was sprayed in a 6-tatami size room (L 3.6 m×W 2.7 m×H 2.4 m) with an air exchange rate set to 0.5 hr−1. According to the label instructions, the aerosol should be sprayed slightly upward for a total of 10 sec. To follow this procedure and achieve “the average concentration across the indoor space as technically feasible,” we sprayed the aerosol at a slight upward angle for 2.5 sec from each of four small windows at the same time, resulting in a total spray time of 10 sec (Fig. 2).
The time-dependent concentration of the active substance in the air after spraying was measured by collecting indoor air over a 20-min period using a sampling tube located at the height of 1.2 m above the floor in the center of the room (star symbol in Fig. 2). Other measurement conditions were as described in a previous study.7)
2. Estimation of the behavior of the active substanceFirst, the conventional method used by the US EPA for determining the behavior of an active substance is described. Next, the InPestCFD simulation method of predicting the active substance’s behavior under the same conditions as the experiment is clarified. This scenario involved predicting the behavior after simultaneous spraying from all four sides of a room with an air exchange rate of not only 0.5 hr−1 but also 1.5 hr−1, where the air inlet was located at a low position and the room was empty of furniture (hereafter, referred to as “Four-direction”). Finally, the InPestCFD simulation method under conditions assuming realistic scenarios is explained. This scenario involved predicting the behavior in a room with an air exchange rate of 0.5 hr−1, where the air inlet was located at either a low or medium position, and a bed was placed either longitudinally or laterally in a corner. In this scenario, the behavior was predicted after spraying while rotating from the center of the room to all directions (hereafter, referred to as “All-direction”) or spraying in one direction from near the air inlet toward the wall on the outlet side (hereafter, referred to as “One-direction”).
2.1. Conventional calculation method used by the US EPAWhen assessing the risk of active substances used indoors, the US EPA Health Effects Division Office of Pesticide Programs uses the Well-Mixed Box (WMB) model to estimate the concentrations of the substance in the air.2) This model assumes that the active substance is fully volatilized, completely mixed, and does not decay except through air exchange. The indoor concentration C (mg/m3) is calculated using Eq. (1):
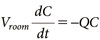 | (1) |
where Vroom (m3) represents the indoor volume, set to 23.3 m3, and Q (m3/hr) represents the airflow rate, set to 11.65 m3/hr, based on the measured conditions outlined in Section 1. Assuming that the initial concentration at t=0 is C0 (mg/m3), the indoor concentration C is expressed by Eq. (2), where C0 (mg/m3) is calculated by dividing the sprayed amount of the active substance by Vroom:
 | (2) |
The parameters used in this study are provided in Supplemental Table S1.
The average concentration Cave from spraying to time t1 is expressed by Eq. (3):
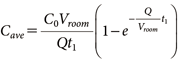 | (3) |
According to the US EPA, in cases where there are no measured values for the residual concentration on the floor, the residual concentration is calculated by dividing the amount of the active substance sprayed by the floor area.2,12)
2.2. InPestCFD simulation for Four-direction sprayUsing the InPestCFD model,7) the behavior of the active substance was predicted under the experimental conditions outlined in Section 1. The prediction method was the same as that used in a previous study,7) except that the air exchange rate was changed from 1.5 to 0.5 hr−1. The procedure adopted was as follows. When the room’s length, width, and height were defined as the x, y, and z-direction, respectively, the grid size for the calculation of ∆x, ∆y and ∆z was set to 0.05 m. The advection and diffusion of the active substance in the indoor air were predicted using the results of the CFD model, while the transfer of the active substance between particles, the air, and the room materials was predicted using a fugacity model. For CFD modeling, the governing equations for incompressible fluids were used with the standard k-ε turbulence model,13) and the behavior of the spray particles was modeled using the random walk model.14) The velocity of the air inflow u1 from the air inlet was determined using Eq. (4), based on the air exchange rate, room volume, and size of the air inlet:
 | (4) |
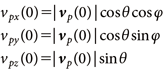
where, ACH represents the air exchange rate, set to 0.5 hr−1, and Ainlet represents the size of the air inlet, set to 0.06 m2, based on the measured conditions specified in Section 1. For cells corresponding to the spray nozzle position, the velocity during spraying was set to 12 m/s.7) The turbulence energy kt (m2/s2) at the air inlet and the nozzle outlet was determined from the velocity,7) and the turbulence energy kt for the entire flow field was calculated using the standard k-ε model. When spraying at a slight upward angle from four-direction in the room, the initial particle velocity vp (0) was set to the same value as the air velocity at the nozzle outlet, i.e., 12 m/s. The horizontal and vertical components of the velocity are expressed as shown in Eq. (5). Additionally, θ, the upward angle, was set to 0.2 rad:
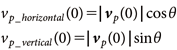 | (5) |
The indoor airflow used to calculate the behavior of both the aerosol particles and the active substance was taken from the point when the airflow calculation reached a steady state. The determination of whether a steady state was reached followed the same method as that adopted in a previous study,7) using the time it took for the number of aerosol particles sprayed indoors to be reduced by half as a reference. Once the indoor airflow was considered to have reached a steady state, aerosol particles were introduced, and the subsequent behavior of the particles was predicted. The particles introduced had diameters of 10, 30, and 50 µm, and the number of particles was calculated by multiplying the amount sprayed by the proportion of each particle size in the measured particle size distribution during spraying and dividing by the particle volume, which resulted in 1.1×10⁹, 2.5×10⁸, and 2.7×10⁷ particles, respectively. To reduce computational costs, the behavior calculations represented 10,000 particles as one for the 10-µm size and 1,000 particles as one for both the 30-µm and 50-µm sizes (This is because the number of 10-µm diameter particles was particularly large, so only the 10-µm diameter particles were grouped in units of 10,000). As a result, 113,600 particles with 10-µm diameter, 252,800 particles with 30-µm diameter, and 27,280 particles with 50-µm diameter were introduced into the indoor airflow. To evaluate the impact of reducing the number of particles, calculations were also performed with 1000, 100, and 100 particles treated as one particle for each size. As a result, the observed behavior did not change significantly, and the error in the 24-hr average concentration remained within 1.5%. Supplemental Fig. S1 shows the temporal changes in airborne concentration.
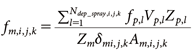
The fugacity equations for particles, air, and room materials, as well as the initial fugacity settings immediately after spraying, were the same as those adopted in a previous study.7) Specifically, the time immediately after spraying was set as t=0, and the fugacity in each medium at t=0 was set as follows: The fugacity of the active substance in aerosol particles (fp,l) was calculated by dividing the concentration of the active substance in the aerosol product by the compound capacity Zp,l. The fugacity of the active substance in the air (fair,i,j,k) was set to 0. The initial fugacity of the active substance in the room materials (fm,i,j,k) was calculated based on Eqs. (6)–(8):
 | (6) |
 | (7) |
 | (8) |
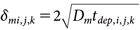
where Ndep_spray,i,j,k represents the number of particles deposited on the surface of the room material cell (i,j,k) during the spraying period; Zm (mol/m3/Pa) is the fugacity capacity of the room material, calculated using Eq. (7); KOW is the octanol–water partition coefficient of the active substance; Sol (mg/L) is the water solubility; P (Pa) is the vapor pressure of the active substance; rm is the oil content ratio, which was set to 0.3 for walls and ceilings and 0.04 for the floor15); Am,i,j,k is the surface area of the room material cell (i,j,k), set to 0.0025 m2; δm (m) is the penetration depth of the active substance into the room material for each cell, expressed by Eq. (8); Dm (m2/s) is the diffusion coefficient of the active substance in the room material; and tdep,i,j,k represents the elapsed time since the active substance was deposited to the room material in each cell. Until the particles are deposited on a cell, a sufficiently small value (10−6 s) was assigned to tdep,i,j,k to prevent divergence in the calculations of Eq. (6).
2.3. InPestCFD simulation for All-direction and One-direction spraysIt is unrealistic to spray simultaneously from all four sides of a room, which requires four products and four sprayers. Therefore, we tried to predict the indoor behavior of the active substance under realistic conditions using InPestCFD. The following conditions were set for spraying aerosol for controlling flies and mosquitoes for 10 sec in a 6-tatami size room with a bed installed. Other conditions are described below:
-
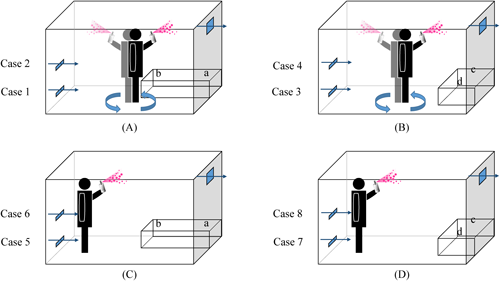
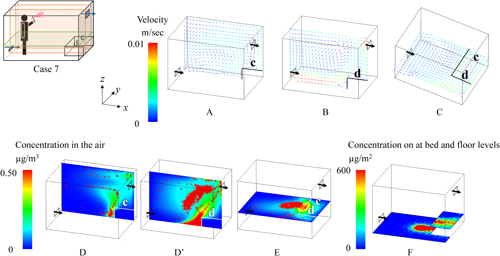
a) The aerosol spraying methods were categorized into two types: spraying rotationally from the center of the room to all directions (“All-direction,” A or B in Fig. 3) and spraying in one direction from near the air inlet toward the wall on the outlet side (“One-direction,” C or D in Fig. 3).
-
b) Although the instructions for aerosol usage specify “thoroughly exchange the air after application,”16) a very conservative scenario was assumed here, where no air exchange was conducted during or after spraying, contrary to the instructions, except for the minimum air exchange required by the Building Standards Act. The air exchange rate of the room was set to the minimum value of 0.5 hr−1 as stipulated by the Building Standards Act.17)
-
c) Two positions were set for the air inlet. The first was at the height of 0.15 m from the floor, as in the experimental tests described in Section 1 (“Low,” Case 1, 3, 5, or 7 in Fig. 3). The other was at the height of 1.2 m from the floor because the Building Standards Act specifies that the upper limit for air inlets is half the height of the room (“Middle,” Case 2, 4, 6, or 8 in Fig. 3).
-
d) The bed was placed adjacent to the wall on the exhaust side, either in a longitudinal position (A or C in Fig. 3) or in a lateral position (B or D in Fig. 3). The size of the single bed was based on Japan Industrial Standards,18) with width of 1 m and length of 2 m (adjusted from the standard dimensions of 0.97-m width by 1.95-m length). The height, including the bed frame and mattress, was set to 0.4 m from the floor.
For the All-direction spray, the aerosol can was positioned at a height of 1.6 m in the center of the room and sprayed at a slight upward angle of approximately 10° (θ=0.2 rad) in a rotational manner to ensure uniform 360° coverage for 10 sec. Here, vp (0) is the initial particle velocity, which was set to 12 m/s, as described in Section 2.2. The initial values for the horizontal components (vpx, vpy) and the vertical component (vpz) of the particle velocity were expressed using Eq. (9). To achieve uniform rotational spraying, φ is the angle in the xy-plane measured from the x-axis (defined as 0°), which was assigned random values within the range of 0° to 360°.
 | (9) |
For the One-direction spray, the aerosol can was positioned at a fixed point 0.3 m from the wall on the air inlet side and at the height of 1.6 m. It was sprayed slightly upward at an angle of approximately 10° (θ=0.2 rad) toward the wall on the air outlet side for 10 sec. Here, vp (0) is the initial particle velocity, which was set to 12 m/s, as described in Section 2.2. The initial values for the horizontal components (vpx, vpy) and the vertical component (vpz) of the particle velocity were expressed using Eq. (5).
The bed surface and sides were treated as no-slip walls, similar to the floor, walls, and ceiling. The behavior of the active substance, such as revolatilization from the bed surface, was treated in the same way as for the room materials using the fugacity equations. The fugacity capacity of the bed surface was calculated based on Eq. (7). Here, rm is the oil content ratio, which was set to 1 for the upper part of the bed, including the mattress (because it is composed primarily of materials such as cotton, linen, or polyester), and treated equivalently to that of the carpet.19) This setting also ensures sufficient absorption of the active substance. For the sides of the bed, which are coated with resin, rm was set to 0.04, i.e., the same as that used for the flooring material.15)
The fugacity of the active substance in the aerosol particles (fp,l) at t=0, immediately after spraying, was calculated as described in Section 2.2, and the fugacity of the active substance in the air (fair,i,j,k) was set to 0. The initial values for the fugacity of the active substance in the room materials and the bed were calculated using Eq. (6). However, a large amount of the active substance adheres to the ceiling immediately after spraying (either All-direction or One-direction for 10 sec), making it necessary to consider for the active substance to penetrate into room materials and the bed material during spraying. To address this, the elapsed time from when the aerosol particles first deposited in a calculation cell after the start of spraying until the end of the 10 sec spraying period was determined. This elapsed time was set as the initial value of tdep,i,j,k in Equation (8) for each calculation cell at t=0, immediately after spraying. For calculation cells where no particles adhered during spraying, the initial value of tdep,i,j,k was set to 10−6 s, as described in Section 2.2.
3. Risk assessment3.1. Prediction of exposureRisk assessments were conducted based on indoor concentrations calculated using the conventional calculation method used by the US EPA, as described in Section 2.1, the InPestCFD simulation for Four-direction spray, as described in Section 2.2, and the InPestCFD simulation for All-direction and One-direction sprays, as described in Section 2.3. For the All-direction and One-direction spraying scenarios, it was assumed that a bed was located in the room to reflect real-world conditions. Accordingly, two exposure scenarios were considered: one where residents remained awake after spraying and another where they went to sleep.
The residential exposure was calculated based on the Ministry of Health, Labour and Welfare guideline,1) assuming two groups: adults and children (3 years old). Exposure via inhalation, dermal, and oral routes was calculated using Eqs. (10)–(12), respectively (note that oral exposure linked to finger sucking applies only to children):
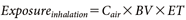 | (10) |
 | (11) |
 | (12) |
where, Cair (mg/m3) represents the concentration of the active substance in the breathing zone near the residents’ mouths, and Csur (mg/m2) represents the concentration on the surface with which residents come into contact. The definitions and values of the other terms are provided in Table 1 and Supplemental Table S1. The default values for each exposure factors shown in Table 1 are derived mainly from the measured data on human behavioral and physiological characteristics provided in the Exposure Factors Handbook.20) Estimated exposure values include uncertainties derived from these factors. To produce reasonably health-protective estimates of exposure, arithmetic mean inputs are typically utilized as exposure factors and coupled with chemical-specific inputs, such as concentration.2)
Table 1. Default values for risk assessment
1)| Parameter | Breathing volume | Exposure time | Body weight | Translodgeable fraction | Skin areas that contact floor | Skin areas mouthed | Fraction extracted in saliva | Frequency | Time mouthed |
|---|
| BV | ET | BW | Transl | SA | NM | FEXS | Freq | ETM |
|---|
| Unit | L/min/kg | hr/day | kg | — | m2 | m2 | — | /hr | hr/day |
|---|
| Adults | 0.213 | 16 | 50 | 0.05 | 9.12 | — | — | — | — |
| Children | 0.403 | 18 | 15 | 0.05 | 3.52 | 0.002 | 0.50 | 20 | 3 |
The average values of the airborne concentration in the breathing zone and the concentration on surfaces to which the residents were exposed were calculated for the period from immediately after spraying to the exposure times for adults and children (i.e., 16 and 18 hr, respectively1)). The breathing position and contact locations differ depending on whether residents remain awake after spraying or go to sleep; therefore, the calculations were performed as follows. For the position of Cair, the airborne concentration in the breathing zone, in the scenario where residents remain awake after spraying, the Ministry of Health, Labour and Welfare’s guideline for measuring indoor air concentrations of insecticides11) were followed. Adults were assumed to breathe at the height of 1.2 m above the floor, and children at the height of 0.2 m. Specifically, when calculating Cair from the results obtained following the methods described in Sections 2.2 and 2.3, the time-averaged values were calculated as the average across the plane at the height of 1.2 m for adults and 0.2 m above the floor for children. In the scenario where residents go to sleep after spraying, the time-averaged values of Cair were calculated from the results obtained following the methods described in Section 2.3 at a fixed point located 0.45 m from either end of the bed and 0.2 m above the bed surface (a, b, c, or d in Fig. 3). These values of 0.45 and 0.2 m were determined with reference to the width of a single-sized pillow (0.43 m) and the average head length of Japanese individuals (0.18–0.19 m21)).
For Csur, the concentration on the surfaces with which residents come into contact, in the scenario where residents remain awake after spraying, the time-averaged values were calculated as the average across the entire floor surface using the results obtained following the methods described in Sections 2.2 and 2.3. In the scenario where residents go to sleep after spraying, the time-averaged values were calculated based on the concentration over the entire bed surface using the results obtained following the methods described in Section 2.3.
3.2. Hazard assessment of d-tetramethrinTypically, d-tetramethrin and tetramethrin (isomer of d-tetramethrin) are of similar toxicological potency22); therefore, the No Observed Adverse Effect Levels (NOAELs) from toxicological studies with tetramethrin were adopted by the read-across approach. The inhalation No Observed Adverse Effect Concentration (NOAEC) was set at 0.02 mg/L based on liver and kidney toxicity, hematology, and acute effects from a 3-month inhalation toxicity study in rats with tetramethrin.23) The exposure duration for the toxicity test was 6 hr/day, and the respiratory rate of rats was 45 L/hr/kg.1) Therefore, inhalation NOAEL was calculated to be 5.4 mg/kg/day [=0.02 mg/L×45 L/hr/kg×6 hr/day]. Dermal NOAEL was above 1000 mg/kg/day based on no toxic effects at the highest level from a 21-day dermal toxicity study in rats with tetramethrin.24) In this study, dermal NOAEL was conservatively assumed to be the maximum dose of 1000 mg/kg/day. Oral NOAEL was set at 36 mg/kg/day based on liver toxicity and hematology from a 52-week oral toxicity study in dogs with tetramethrin.25) These NOAEL values are based on various mammalian toxicity tests. The tolerable daily intake (TDI) for humans, which is the amount of an active substance that can be taken by humans without adverse health effects, is derived by dividing the NOAEL by the assessment factor (AF).1) In this case, an AF of 100 was used, considering an extrapolation factor of 10 for species difference between animals and humans, and another factor of 10 for individual difference in human sensitivity.1) Based on this, the TDI values for d-tetramethrin via inhalation, dermal, and oral routes were determined to be 0.054, 10, and 0.36 mg/kg/day, respectively.
3.3. Derivation of risk quotientThe safety of residents after spraying an aerosol containing d-tetramethrin was evaluated by comparing the amount of d-tetramethrin exposure (Exposure, mg/kg/day) to the TDI (mg/kg/day). Specifically, the risk quotient (RQ) was calculated by dividing the exposure by the TDI. If the RQ is 1 or less, meaning that the Exposure is equal to or below the TDI, there is no concern regarding risk. Conversely, if the RQ exceeds 1, the exposure exceeds the TDI, indicating concern regarding risk.1)
When multiple exposure routes exist, and exposures occur simultaneously with similar toxicological effects, it is necessary to sum the RQs for each route. Regarding the toxicity of d-tetramethrin, although the endpoints differ slightly among the routes, all routes result in systemic effects. Therefore, conservative evaluation was conducted by combining the RQs using Eq. (13):
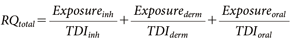 | (13) |
In this case, if the total RQ (RQtotal) for all routes is 1 or less, the exposure amount is deemed below the tolerable level and there is no concern regarding risk.3)
Results
The Results section is presented in the following order: comparison between measured values and InPestCFD-predicted values under the air exchange rate of 0.5 hr−1; comparison of InPestCFD prediction results under air exchange rates of 0.5 and 1.5 hr−1; comparison between InPestCFD and US EPA conventional prediction results under the air exchange rate of 0.5 hr−1; examination of the effects of spraying methods and indoor environmental conditions on the behavior of the active substance using InPestCFD; and results of risk assessments based on InPestCFD and US EPA conventional prediction results.
1. Behavior of the active substance in the room after Four-direction spray1.1. Comparison of temporal changes in airborne concentration between measured and predicted valuesThe measured and predicted airborne concentrations by using InPestCFD at the height of 1.2 m in the center of the floor over a 24-hr period following spraying from four-direction under the exchange rate of 0.5 hr−1 are shown in Fig. 4 for the purpose of comparison. The measured airborne concentration was obtained by sampling air for 20 min; therefore, predicted concentration was also calculated by dividing the sum of the amounts of the active substance in the air and particles passing through the calculation cell over 20 min by the cell volume. Both the measured and the predicted airborne concentrations exhibited a relatively rapid decay immediately after spraying owing to the settling of aerosol particles and air exchange. After 12 hr, the concentrations decayed gradually owing to the revolatilization of the active substance from the room materials into the air. When calculating the daily average airborne concentration based on the measured values (black circles) and the predicted values (solid line) in Fig. 4, the measured value was 13.4 µg/m3, and the predicted value was 18.1 µg/m3, showing no noticeable difference.
Regarding the predicted airborne concentration, the current method represents 10,000, 1000, and 1000 particles by a single hypothetical particle with diameter of 10, 30, and 50 µm, respectively. Recognizing that the results might vary depending on the number of particles passing through the calculation cells, a sensitivity analysis was conducted by increasing the number of particles by a factor of 10. The resulting daily average airborne concentration was 18.4 µg/m3, showing no noticeable change compared with the value obtained before increasing the number of particles. Based on these findings, for the purpose of estimating human exposure levels, it was considered that there was no need to increase the number of particles because the computational accuracy of the current method was deemed sufficient.
In a previous study,7) the behavior of the active substance indoors was predicted using InPestCFD following four-direction spraying in a room with the air exchange rate of 1.5 hr−1. In this study, the same room and the same spraying method were considered, but the air exchange rate was set to 0.5 hr−1. It was confirmed that the initial decay in concentration was more gradual, and the predicted values matched the measured values as in the previous study.7) In addition to the comparison at 1.2 m height, comparisons between the predicted and measured values were also conducted at 0.6 m and 1.8 m heights under the air exchange rate of 0.5 hr−1 (Supplemental Fig. S1). Furthermore, in addition to the air exchange rate of 0.5 hr−1, a comparison between the predicted and measured values at 1.2 m height was also performed under an air exchange rate of 4.5 hr−1 (Supplemental Fig. S2). In all cases, the predicted values showed good agreement with the measured values.
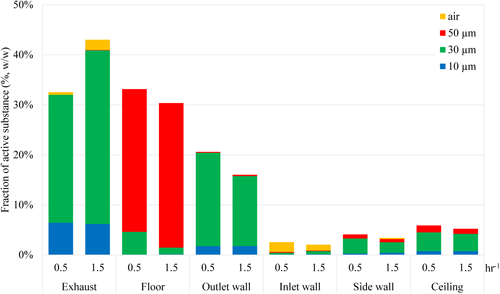
1.2. Changes in behavior with different air exchange ratesFig. 5 shows the differences in the indoor distribution of the active substance between air exchange rates of 0.5 and 1.5 hr−1. Regarding exhaust to the outdoors, the higher air exchange rate (i.e., 1.5 hr−1) increased the proportion of the active substance derived from 30-µm particles (green bars of “Exhaust” in Fig. 5). Additionally, at higher air velocities, more active substance re-evaporated from room materials, increasing the active substance in the air exhausted at the higher air exchange rate (yellow bars of “Exhaust” in Fig. 5). The residues on room materials 6 hr after spraying were generally higher at the air exchange rate of 0.5 hr−1. Most of the active substance from 50-µm particles settled on the floor, with the amount unchanged by the air exchange rate (red bars of “Floor” in Fig. 5). The active substance from 30-µm particles deposited mainly on the outlet-side wall (green bars of “Outlet wall” in Fig. 5). The airborne active substance that re-evaporated from room materials deposited mostly on the inlet-side walls at both air exchange rates. By contrast, more active substance was deposited at the lower air exchange rate (0.5 hr−1) (yellow bars of “Inlet wall” in Fig. 5). This was because the airflow around the air inlet swirled, making it easier for the re-evaporated substance to be deposited in that area.
1.3. Comparison of predicted behavior between InPestCFD and the conventional method used by the US EPAThe predicted airborne concentrations and floor residual concentrations after spraying d-tetramethrin-containing aerosols for 10 sec in a 6-tatami size room with the air exchange rate set at 0.5 hr−1 were compared between InPestCFD and the conventional method used by the US EPA, based on the exposure scenarios described in Method 3.1 (Table 2). Specifically, the average values of both the airborne concentrations and the floor residual concentrations were calculated for the period from immediately after spraying to the exposure time (16 hr for adults; 18 hr for children1)). For airborne concentrations, the US EPA method cannot predict spatial concentration distributions; therefore, only the exposure time was adjusted for adults and children. Conversely, InPestCFD can predict spatial behavior, enabling the calculation of the average airborne concentration on a plane at the height of 1.2 m for adults and 0.2 m for children. For floor residual concentrations, the US EPA method cannot predict temporal changes; thus, the value obtained by dividing the sprayed amount by the floor area was used. In contrast, InPestCFD calculated the average floor residual concentration based on its temporal changes over the exposure period (16 hr for adults; 18 hr for children). Compared with the InPestCFD results, both the airborne concentrations and the floor residual concentrations calculated using the US EPA method were noticeably higher. For airborne concentrations, the US EPA method uses the WMB model, which assumes that the active substance in aerosol particles is fully gaseous and uniformly distributed indoors, without considering the settling of aerosol particles or their deposition on room materials. Similarly, for floor residual concentrations, the US EPA method assumes that the entire sprayed amount settles on the floor, without accounting for removal through air exchange or adhesion to room materials.
Table 2. Comparison of predicted mean concentrations
| 16 hr-average | 18 hr-average |
|---|
| Air (µg/m3) | Floor (µg/m2) | Air (µg/m3) | Floor (µg/m2) |
|---|
| InPestCFD (Four-direction) | 27.9a) | 309.9 | 14.3b) | 311.4 |
| US EPA method | 65.8 | 1265 | 58.6 | 1265 |
a) Average concentration at the height of 1.2 m from the floor.
b) Average concentration at the height of 0.2 m from the floor
The indoor behavior of the active substance after All-direction or One-direction spraying was predicted. Under the air exchange rate of 0.5 hr−1, the air inlet position was set either at the lower or middle level of the room, and the bed was placed either longitudinally or laterally. Other conditions were kept the same as those in the Four-direction spraying scenario. Using InPestCFD, the behavior of the active substance after spraying was predicted, and the effects of various factors were analyzed. The average airborne concentration for scenarios where residents slept after spraying and those where they remained awake were shown in Supplemental Table S2. The results are presented below.
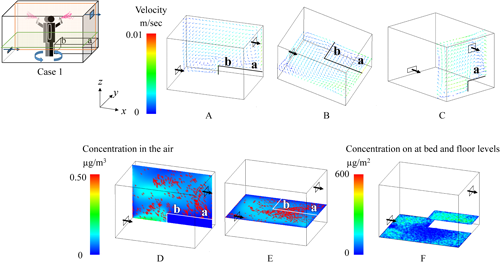
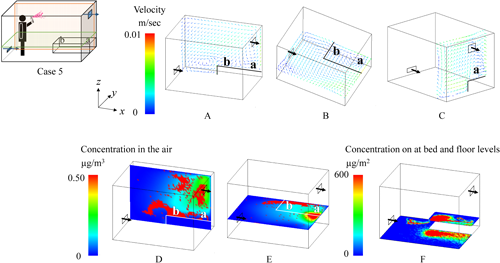
2.1. Effects of spraying methodsNotable differences in the behavior of the active substance between All-direction and One-direction spraying were observed under the condition where the air inlet was at the lower level, and the bed was placed longitudinally (Figs. 6 and 7). In the figures, the color of the velocity arrows in the upper row represents the speed, while the direction of the arrows indicates the flow direction. The color of the concentration in the lower row represents the concentration of the active substance. In this figures, higher concentrations are represented by red coloring, and because the red coloring is depicted as dots, it inherently represents aerosol particles with high concentrations of the active substances, while the blue areas represent the active substances in the air with relatively low concentrations. The particles after All-direction spraying were distributed relatively evenly throughout the room (D and E in Fig. 6). Additionally, in All-direction spraying, the aerosol was sprayed outward from the center of the room, meaning that the concentration near the center of the floor was relatively low, while the surrounding area showed a more uniform distribution (F in Fig. 6). The airborne concentration after One-direction spraying showed an uneven particle distribution, even 1 hr after spraying, which was influenced by the initial uneven dispersion of particles during spraying (D and E in Fig. 7). Regarding the residual concentrations on the bed and floor, deposition occurred from the center of the room toward the exhaust side, with the spraying method strongly affecting the deposition pattern (F in Fig. 7).
The effects of spraying methods (All-direction and One-direction) on human exposure were analyzed, and the results are summarized in Table 3 based on data from Supplemental Table S2. For all metrics, including airborne concentrations and residual concentrations on the bed or the floor, the values were noticeably higher for One-direction spraying. Although All-direction spraying produced a relatively uniform distribution of the active substance throughout the room, One-direction spraying led to an uneven distribution, as indicated by the larger standard deviation in the latter case. Specifically, the standard deviation for the residual concentration on the bed was noticeably higher. In One-direction spraying, unlike All-direction spraying, both the deposition of particles onto the bed during spraying and the transport of particles onto the bed via airflow were affected by the spray range and the position of the bed.
Table 3. Comparison of predicted concentrations based on differences in spraying method
| Concentration (Mean±S.D.) | Air (µg/m3) | Room material (µg/m2) |
|---|
| All-direction | Sleep | 3.3±3.3 | 102±23 (Bed) |
| Awake | 5.1±4.2 | 69±17 (Floor) |
| One-direction | Sleep | 6.1±12 | 258±170 (Bed) |
| Awake | 7.2±7.8 | 140±25 (Floor) |
Distinct differences in the behavior of the active substance were observed between the Low and Middle air inlet positions under the conditions where spraying was One-direction, the air inlet was positioned at the lower level, and the bed was placed longitudinally (Figs. 7 and 8). When the air inlet was at the Low position, the airflow entering from the inlet collided with the bed, creating turbulence in the airflow (A and B in Fig. 7). Furthermore, a swirling vortex formed above the bed (B and C in Fig. 7), resulting in a tendency for higher residual concentrations on the bed (F in Fig. 7). Conversely, when the air inlet was at the Middle position, the airflow entering from the inlet collided with the wall on the exhaust side and then flowed back toward the air inlet (A′ and C in Fig. 8), making it easier for aerosol particles to be exhausted. Additionally, there was almost no turbulence in the airflow above the bed (B and C in Fig. 8), and the sprayed particles settled directly onto the floor owing to the effect of gravity (F in Fig. 8).
To assess the impact from the perspective of human exposure, the average values from Supplemental Table S2 were calculated separately for the Low and Middle air inlet positions, and the results are presented in Table 4. The airborne concentration was higher at the Low position than at the Middle position in both the sleep and the awake scenarios because more particles remained suspended in the air at the Low position. Furthermore, at the Low position, particles were transported onto the bed by the airflow, leading to higher residual concentrations on the bed regardless of the spraying method.
Table 4. Comparison of predicted concentrations based on differences in inlet positions
| Concentration (Mean±S.D.) | Air (µg/m3) | Room material (µg/m2) |
|---|
| Low | Sleep | 7.5±1.2 | 243±173 (Bed) |
| Awake | 8.5±7.9 | 94±42 (Floor) |
| Middle | Sleep | 1.9±2.8 | 117±61 (Bed) |
| Awake | 3.8±2.8 | 115±39 (Floor) |
Clear differences in the behavior of the active substance were observed based on the position of the bed under the conditions where spraying was One-direction and the air inlet was positioned at the lower level (Figs. 7 and 9). When the bed was placed longitudinally, the airflow from the air inlet collided with the bed, creating a swirling motion (A in Fig. 7). In contrast, when the bed was placed laterally, the airflow from the air inlet accelerated unobstructed, collided with the side of the bed, and tended to flow directly toward the exhaust outlet (D′ in Fig. 9). For residual concentrations on the bed, in the longitudinal position, the airflow created a swirling motion that transported particles toward the bed (B and C in Fig. 7). In contrast, in the lateral position, no such swirling motion was observed (C in Fig. 9). Instead, the sprayed particles settled directly onto the bed owing to the effect of gravity, leading to localized areas of high concentration (F in Fig. 9).
To assess the impact from the perspective of human exposure, average values were calculated based on Supplemental Table S2, comparing the longitudinal and lateral bed positions. The results are presented in Table 5. The airborne concentration above the bed was extremely low in the lateral position, regardless of the spraying method. This was because the airflow colliding with the bed was directed straight toward the exhaust outlet (B in Fig. 9). For residual concentrations on the bed, although localized areas of high concentration were observed (F in Fig. 9), the overall average concentration was lower in the lateral position.
Table 5. Comparison of predicted concentrations based on differences in bed placement
| Concentration (Mean±S.D.) | Air (µg/m3) | Room material (µg/m2) |
|---|
| Longitudinal placement | Sleep | 8.9±11 | 207±189 (Bed) |
| Awake | 8.9±7.8 | 115±49 (Floor) |
| Lateral placement | Sleep | 0.47±0.27 | 153±67 (Bed) |
| Awake | 3.4±2.1 | 94±29 (Floor) |
Regarding differences in breathing zones above the bed, as shown in Supplemental Table S2, for the longitudinal position, the concentration at position “b” (the center of the airflow vortex) was generally higher than that at position “a,” except in Case 1. Conversely, for the lateral position, the concentration at position “c” was higher in the All-direction spraying method, while position “d” was higher in the One-direction spraying method. This was because, in the All-direction spraying method, the concentration near the sidewalls was higher than that at the center of the floor, causing particles to accumulate at position “c” owing to airflow transport. In the One-direction spraying method, position “d” was directly beneath the spray (F in Fig. 9), resulting in higher concentrations at that position.
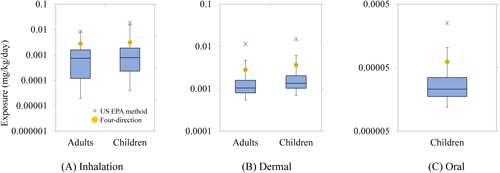
3. Risk assessment3.1. Comparison of the exposure levelsThe inhalation, dermal, and oral exposure levels for adults and children were calculated based on airborne concentrations and residual concentrations on the floor or the bed. For the real-world scenarios of All-direction and One-direction spraying, 24 scenarios were evaluated, comprising three exposure types (two sleep scenarios and one awake scenario) across eight cases. The two sleep scenarios were considered separately because the position of the head on the bed differs between them. The distribution of these exposure levels is presented in the box plot (Fig. 10). The exposure levels for Four-direction spraying (yellow circles in Fig. 10) were notably high, corresponding to approximately the 95th percentile of the exposure levels in the real-world scenarios. The exposure levels calculated by the US EPA method (asterisks in Fig. 10) were much higher than the exposure levels in the real-world scenarios.
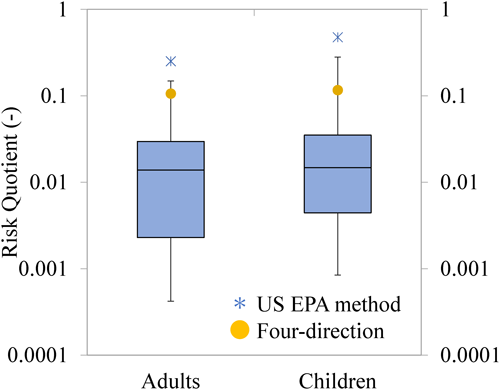
3.2. Calculation of RQsBased on the calculated exposure levels, the RQ was determined according to the approach described in Method 3.3. The RQ values obtained using the US EPA evaluation method (asterisks in Fig. 11) were 0.25 for adults and 0.47 for children, while the RQ values for Four-direction spraying (yellow circles in Fig. 11) were 0.11 for adults and 0.12 for children. In all cases, the RQ values were below 1, indicating no concern regarding risk.
The RQ values for the real-world scenarios are presented in Supplemental Tables S3 and S4, Supplemental Fig. S3, and Fig. 11. While inhalation exposure was slightly higher than dermal exposure (Fig. 10), the contribution to RQ was predominantly from inhalation, accounting for over 99% in most scenarios, with dermal and oral contributions being less than 1%. This is because d-tetramethrin has little dermal toxicity, and because the oral exposure levels were minimal. The total RQ values ranged from a minimum of 0.0004 (adults) and 0.0008 (children), to a 50th percentile of 0.014 (adults) and 0.015 (children), a 75th percentile of 0.030 (adults) and 0.035 (children), and a maximum of 0.15 (adults) and 0.28 (children). In all cases, the RQ values were below 1, indicating no concern regarding risk. The higher RQ values for children compared with those for adults were attributed to their higher breathing rate per unit body weight.
Discussion
In a previous study,7) it was confirmed that the spatiotemporal behavior of airborne concentrations and floor residual levels of the active substance after spraying an aerosol for 10 sec in a 6-tatami size room with an air exchange rate of 1.5 hr−1 matched the predictions made by InPestCFD. In this study, with the air exchange rate set to 0.5 hr−1, it was demonstrated that the temporal behavior of airborne concentrations also aligned with the predicted values (Fig. 4). Comparing the results for air exchange rates of 1.5 and 0.5 hr−1, the 0.5 hr−1 rate showed higher indoor concentrations of the active substance and higher residual levels on room materials (Fig. 5), which indicating a more conservative safety evaluation. Because 0.5 hr−1 is the minimum air exchange rate stipulated by the Building Standards Act,17) estimating residents’ exposure levels based on the spatiotemporal indoor behavior predicted by InPestCFD under this air exchange rate would provide a sufficiently conservative safety evaluation.
The airborne concentrations and the floor residual levels mentioned above are stipulated in the Ministry of Health, Labour and Welfare guideline, the actual airborne concentrations and floor residual levels under real-world usage conditions might differ. Therefore, using InPestCFD, the indoor behavior of the active substance was predicted under spraying methods and indoor environments that reflect real-world scenarios. This allowed for improved understanding of the range of resident exposure levels and analysis of the effects of various conditions on concentrations. The results showed that under the All-direction spraying method, the minimum and maximum values of the 16- or 18-hr average airborne concentrations near residents’ breathing zones differed by a factor of 40. In contrast, under the One-direction spraying method, the difference was as large as 660 times (Supplemental Table S2), indicating notable heterogeneity in indoor concentrations. The placement of the bed influenced the indoor concentration distribution; however, air inlets at the middle position tended to facilitate the outdoor exhaust of the active substance, whereas air inlets at the lower position resulted in higher residual levels indoors.
Based on airborne concentrations and residual levels on room materials under real-world scenarios, the exposure levels of residents across 24 scenarios were estimated and compared with exposure levels from existing methods. The results showed that exposure levels based on the US EPA method exceeded the 100th percentile value of real-world scenarios by a substantial margin, indicating overly conservative evaluation (Fig. 10). The US EPA method predicts airborne concentrations using the WMB model and assumes that the entire sprayed amount of the active substance settles on the floor. In reality, the active substance sprayed from aerosols does not instantly become a gas and mix uniformly in the air, nor does the entire amount settle on the floor. However, the exposure levels under the Four-direction spray method and the indoor environmental conditions with air inlets at the lower position and no bed corresponded to approximately the 95th percentile of real-world scenarios.
Several different factors are multiplied together to estimate exposure. If upper percentile values are used for all these factors, the resulting exposure estimate can become unrealistically high. Therefore, to avoid overestimation while still considering a realistic worst-case scenario, the 75th percentile value is typically selected for each factor.26) This approach allows for the assessment of higher-than-average exposures without resulting in excessive conservatism in the overall estimate. From this perspective, the exposure levels under the Four-direction spray method and the indoor environmental conditions with air inlets at the lower position and no bed can be considered to be sufficiently conservative.
Although aerosol spray labels include warnings such as “Do not spray directly at people” and “Thoroughly exchange the air after spraying,” the exposure levels were estimated under conditions contrary to these warnings, such as aerosol particles falling directly onto residents lying on beds and no air exchange after spraying. Considering these factors, the exposure levels under such spraying methods and environmental conditions adopted in this study can be regarded as sufficiently conservative.
The Four-direction spraying method adopted in this study has the advantage of suppressing spatial variation in airborne concentrations and floor residual levels. Additionally, as demonstrated by InPestCFD, air inlets at the lower position result in higher indoor residual levels, and sufficient safety evaluations can be conducted even in rooms without furniture. Therefore, for evaluating the safety of spatial aerosol spraying, a single condition of a 6-tatami size room with air inlets at the lower position and an air exchange rate of 0.5 hr−1 under Four-direction spraying is deemed sufficient. This study demonstrated that InPestCFD can predict indoor environments, even when the spraying method, air exchange rate, air inlet position, furniture placement, and residents’ breathing position, and locations vary. Utilizing this model, it becomes possible to understand the spatiotemporal distributions of airborne concentrations and residual levels on room materials, which were previously limited in scope. Furthermore, it is theoretically possible to predict the indoor behavior of the active substance after thorough air exchange, which product labels indicate should be standard practice. Although the model was developed for aerosols, it could also be applied to other formulations. For example, InPestCFD combines fugacity with CFD, making it suitable for describing the distribution of active substances released by heating, such as liquid vaporizer-type or mat-type mosquito repellents, which spread indoors via upward airflow. Additionally, using this model to predict the behavior of substances can be applied not only to safety evaluations but also to product design stages. Specifically, the concentration of active substances during insecticide spraying must be high enough to exceed the minimum effective concentration against mosquitoes and other pests, as determined by efficacy tests, while remaining below the tolerable concentration for humans and other non-target organisms, as determined by toxicity tests. This requires selecting active substances and solvents, as well as designing particle size, usage methods, and dosages to meet these conditions. Using the model is expected to contribute to the efficiency of such product development.
Conclusion
Using InPestCFD, which integrates a fugacity model with a CFD model, the behavior of the active substance in an aerosol intended for controlling mosquitos and flies was predicted under real-world scenarios. The spraying methods included Four-direction, One-direction, and All-direction, with air inlet positions set at low and middle levels, and a bed placed in a corner of the room. The predictions revealed the spatiotemporal indoor behavior of the active substance under various conditions, which had previously been unclear when based solely on analysis of measurements. Furthermore, considering the predicted behavior, a risk assessment for residents was conducted. The Four-direction spraying condition showed high exposure levels, corresponding to the 95th percentile of real-world scenarios. In contrast, the conventional risk assessment method involving the WMB model exceeded the 100th percentile and yielded excessively conservative results, highlighting the risk that active substances with no actual safety concerns might be excluded from use. Based on the findings obtained in this study, it is recommended to adopt appropriate risk assessment methods that reflect real-world scenarios.
Electronic supplementary materials
The online version of this article contains supplementary material, which is available at https://www.jstage.jst.go.jp/browse/jpestics/.
References
- 1) Ministry of Health: Labour and Welfare: “Guideline for the method of risk assessment on indoor use of insecticides which are over-the-counter drugs and quasi-drugs (proposal)”, Pharmaceutical Foods Division, Tokyo, 2007 (in Japanese).
- 2) US Environmental Protection Agency: “Standard Operating Procedures for Residential Pesticide Exposure Assessment,” US Environmental Protection Agency, Washington, D.C., 2012.
- 3) European Chemicals Agency: “Guidance on the Biocidal Products Regulation Volume III Human Health-Assessment & Evaluation (Parts B+C),” ECHA-17-G-27-EN, European Chemicals Agency, Helsinki, 2017.
- 4) Y. Matoba, Y. Takimoto and T. Kato: Indoor Behavior and Risk Assessment Following Space Spraying of d-Tetramethrin and d-Resmethrin. Am. Ind. Hyg. Assoc. J. 59, 181–190 (1998).
- 5) S. Tsuda, I. Nishibe and G. Shinjo: Influence of Droplet Sizes on the Percentage of Airborne Spray Droplets in Oil-based Aerosols. J. Pestic. Sci. 13, 253–260 (1988).
- 6) M. Abuhegazy, K. Talaat, O. Anderoglu and S. V. Poroseva: Numerical investigation of aerosol transport in a classroom with relevance to COVID-19. Phys. Fluids 32, 103311 (2020).
- 7) S. Tanaka, Y. Matoba, H. Kondo and T. Ihara: Fugacity model incorporating computational fluid dynamics for analyzing the behavior of an insecticide sprayed indoors. J. Pestic. Sci. 48, 187–201 (2023).
- 8) D. Mackay, S. Paterson, B. Cheung and W. B. Neely: Evaluating the environmental behavior of chemicals with a level III fugacity model. Chemosphere 14, 335–374 (1985).
- 9) D. Mackay and S. Paterson: Evaluating the multimedia fate of organic chemicals: A level III fugacity model. Environ. Sci. Technol. 25, 427–436 (1991).
- 10) S. V. Patankar: “Numerical heat transfer and fluid flow,” Hemisphere Publishing Corporation, New York, 1980.
- 11) Ministry of Health: Labour and Welfare: “Guideline for the method of measuring indoor air concentration of active ingredients of insecticides which are over-the-counter drugs and quasi-drugs,” Ministry of Health, Labour and Welfare, Tokyo, 2007 (in Japanese). https://www.mhlw.go.jp/web/t_doc?dataId=00ta8044&dataType=1&pageNo=1 (Accessed 10 Oct., 2025)
- 12) US Environmental Protection Agency: “The Standard Operating Procedures for Residential Pesticide Exposure Assessment, Indoor Environments SOP (xlsx),” US Environmental Protection Agency, Washington, D.C., 2012. https://www.epa.gov/sites/production/files/2015-08/usepa-opp-hed_residential_sops_indoor_environments_october2012.xlsx (Accessed 10 Oct., 2025)
- 13) B. E. Launder and D. B. Spalding: The numerical computation of turbulent flows. Comput. Methods Appl. Mech. Eng. 3, 269–289 (1974).
- 14) C. D. Hall: The simulation of particle motion in the atmosphere by a numerical random-walk model. Q. J. R. Meteorol. Soc. 101, 235–244 (1975).
- 15) Y. Matoba, J. Yoshimura, J. Ohnishi, N. Mikami and M. Matsuo: Development of the simulation model InPest for prediction of the indoor behavior of pesticides. J. Air Waste Manag. Assoc. 48, 969–978 (1998).
- 16) Japan Pest Control Products Council: “Voluntary Standards for Household Pest Control Products,” Japan Pest Control Products Council, Tokyo, 2023 (in Japanese). https://www.mhlw.go.jp/content/11120000/001443863.pdf (Accessed 10 Oct., 2025)
- 17) Ministry of Land: Infrastructure, Transport and Tourism: “Building Standards Act,” Ministry of Land, Infrastructure, Transport and Tourism, Tokyo, 2022 (in Japanese).
- 18) Japan Standards Association: “JIS S 1102:2017 Beds for domestic use,” Japan Standards Association, Tokyo, 2017 (in Japanese).
- 19) Y. Matoba, J. Ohnishi and M. Matsuo: Indoor simulation of insecticides in broadcast spraying. Chemosphere 30, 345–365 (1995).
- 20) US Environmental Protection Agency: “The Exposure Factors Handbook,” US Environmental Protection Agency, Washington, D.C., 1997.
- 21) M. Kouchi and M. Mochimaru: Anthropometric Database of Japanese Head 2001. H16PRO-212, National Institute of Advanced Industrial Science and Technology, Ibaraki, 2008. https://www.airc.aist.go.jp/dhrt/head/index.html (Accessed 10 Oct., 2025)
- 22) US Environmental Protection Agency: “Tetramethrin Draft Human Health Risk Assessment for Registration Review,” EPA-HQ-OPP-2011-0907-0011, U.S. Environmental Protection Agency, Washington, D.C., 2016.
- 23) S. Kawaguchi: Three-month inhalation toxicity study of Neo-Pynamin in rats (Determination of the no observed effect level), Unpublished study performed by Sumitomo Chemical Company, 1991.
- 24) M. R. Osheroff: 21-day dermal toxicity study in rats with Neo-Pynamin, Unpublished study performed by Sumitomo Chemical Company, 1991.
- 25) M. D. Walker: 52-week toxicity study in dogs with Neo-Pynamin, Unpublished study performed by Sumitomo Chemical Company, 1996.
- 26) H. J. Bremmer, W. M. Blom, P. H. van Hoeven-Arentzen, L. C. H. Prud’homme de Lodder, M. T. M. van Raaij, E. H. F. M. Straetmans, M. P. van Veen and J. G. M. van Engelen: “Pest Control Products Fact Sheet,” RIVM report 320005002/2006, National Institute for Public Health and the Environment, Bilthoven, 2006.