Notes
Use of image analysis to estimate anthocyanin and UV-excited fluorescent phenolic compound levels in strawberry fruit
2013 年 63 巻 2 号 p. 211-217
詳細
2013 年 63 巻 2 号 p. 211-217
Strawberry is rich in anthocyanins, which are responsible for the red color, and contains several colorless phenolic compounds. Among the colorless phenolic compounds, some, such as hydroxycinammic acid derivatives, emit blue-green fluorescence when excited with ultraviolet (UV) light. Here, we investigated the effectiveness of image analyses for estimating the levels of anthocyanins and UV-excited fluorescent phenolic compounds in fruit. The fruit skin and cut surface of 12 cultivars were photographed under visible and UV light conditions; colors were evaluated based on the color components of images. The levels of anthocyanins and UV-excited fluorescent compounds in each fruit were also evaluated by spectrophotometric and high performance liquid chromatography (HPLC) analyses, respectively and relationships between these levels and the image data were investigated. Red depth of the fruits differed greatly among the cultivars and anthocyanin content was well estimated based on the color values of the cut surface images. Strong UV-excited fluorescence was observed on the cut surfaces of several cultivars, and the grayscale values of the UV-excited fluorescence images were markedly correlated with the levels of those fluorescent compounds as evaluated by HPLC analysis. These results indicate that image analyses can select promising genotypes rich in anthocyanins and fluorescent phenolic compounds.
Anthocyanins, which are phenolic compounds, are responsible for the external and internal colors in strawberry (Fragaria × ananassa Duchesne). Accordingly, anthocyanin content has inevitably been an important selection criterion in strawberry breeding. Anthocyanins have also attracted attention as an important phytochemicals with potential health-promoting effects, such as antioxidative activity (Wang et al. 1997, Wu and Prior 2005). Generally, phytochemicals with potential health-promoting effects include phenolic compounds such as flavonoids, nitrogenous compounds such as chlorophyll derivatives and tocopherols, carotenoids, and ascorbic acids. Of the phenolic compounds, strawberry is abundant in anthocyanins, catechin and flavonols such as quercetin and kaempferol (Hannum 2004). Besides these flavonoids, strawberry fruits are also abundant in several phenolic acids and their derivatives such as ellagic acid (Hannum 2004, Heinonen et al. 1998, Wang and Lin 2000, Zhang et al. 2008). These phenolic compounds are products of plant metabolism that likely serve many functions essential to the growth and survival of the plant; some of them are clearly bioactive in the animals and humans who consume them (Hannum 2004). Recently, in strawberry breeding, as well as other fruit and vegetable, it has become increasingly important to breed new cultivars that are rich in phytochemicals that have potential health benefits, such as antioxidant, anticarcinogenic and antimutagenic effects.
The kinds and amounts of anthocyanins and other phenolic compounds vary widely among existing cultivars (Andersen et al. 2004, Wang and Lin 2000, Yoshida and Tamura 2005), indicating that it may be possible to breed new cultivars that contain higher levels of these compounds. The levels of anthocyanins and other phenolic compounds are usually evaluated by using spectrophotometric and HPLC analyses (Lopes-da-Silva et al. 2002, Wu and Prior 2005). However, these methods require expensive equipment and are time- and labor-intensive to evaluate even a few fruits. Moreover, anthocyanins and other phenolic compound levels vary quantitatively with growing conditions, degree of ripeness and handling after harvest even in the same cultivar. In breeding programs, this means that breeders must evaluate a large amount of fruit throughout the long harvest period to correctly select a promising genotype rich in phytochemicals. Therefore, from the breeder’s viewpoint, a simplified method to roughly estimate phytochemical composition is desirable to avoid the time and monetary expense of a more accurate evaluation.
The depth of the red color of strawberry fruits is determined by anthocyanins, and the anthocyanin content can be estimated by evaluating fruit color (e.g., Maegawa et al. 1992, Urata et al. 1991, Yoshida et al. 2002). Therefore, more accurate color evaluation could provide a more precise estimate of the anthocyanin content in strawberry fruits. Fruit color has long been quantified by colorimeters. But since the aperture of many colorimeters is limited in size and shape, it is difficult to efficiently and accurately evaluate strawberry fruit that has an uneven surface color, such as skin color with red gradation, existence of green seeds, cut surface color with gradation from red to white. In contrast, digital image analyses can evaluate fruit color more objectively and quantitatively than traditional methods, such as human visual assessment and colorimeters and thus have been successfully used to evaluate plant organ color in other species (e.g., Darrigues et al. 2008, Lootens et al. 2007, Venora et al. 2009, Yoshioka et al. 2004, Yoshioka and Fukino 2010). In addition, imaging techniques under non-visible light (i.e., infrared and ultraviolet) are well known as efficient tools to detect and evaluate colorless compounds in plant organs. For example, near-infrared imaging techniques have recently been developed to evaluate sugar content in fruit (Martinsen and Schaare 1998, Sugiyama 1999, Tsuta et al. 2002) and ultraviolet imaging techniques can be used to detect some flavonoids and carotenoids in flowers (Fukuta et al. 2005, Nakayama et al. 2006, Sasaki and Takahashi 2002, Yoshioka et al. 2005). Observation under UV-light can also detect UV-excited fluorescent compounds such as phenolic acids (Buschmann et al. 2000, Chaerle et al. 2007, Lichtenthaler and Schweiger 1998) and fluorescent chlorophyll catabolites (Moser et al. 2008, 2009) in plant organs. Therefore, digital image analysis should be useful as a simplified method for estimating anthocyanin content and may have potential applications to the detection and evaluation of colorless compounds in strawberry fruits.
In this study, we demonstrate the effectiveness of image analyses in estimating the levels of anthocyanins and UV-excited fluorescent compounds in strawberry fruits. First, we photographed strawberry fruits of several Japanese strawberry cultivars under visible light, as well as by using UV reflected and UV fluorescence photography. Since color models, the way colors can be represented as typically three or four color components, have different characteristics, the estimate accuracy of the compounds depends on the color components and models used in the image analysis. For example, CIE-Lab color models, that is designed so that the Euclidean distance between color coordinates approximates how well colors are discriminated by the human eye, has three color components: L*, a* and b*. Scores of L*, a* and b* represent the lightness of the color, position between red/magenta and green and position between yellow and blue, respectively. Therefore, in order to establish more appropriate estimation methods, we evaluated skin and cut-surface colors on the basis of the color information from three color models: RGB (red, green, blue), HSL (hue, saturation, lightness) and CIE-Lab (L*, a*, b*). Second, we evaluated anthocyanin and UV-excited fluorescent compound levels by using spectrophotometric and high performance liquid chromatography (HPLC) analyses. Finally, we analyzed the relationships between the compound levels and the image data. We discuss the potential application of image analyses in strawberry breeding programs.
Strawberry fruits of 12 cultivars were obtained from several grocery stores and from the glasshouse at the Institute of Vegetable and Tea Science (Tsu, Mie, Japan) in April 2010 (Table 1). These cultivars were chosen to represent the wide variety of external and internal fruit colors in current cultivars in Japan. We used eight to ten fruits of each cultivar except for ‘Sachinoka’, which provided 30 fruits from three different lots (Table 1). After removing the calyx, each fruit was cut into two equal parts vertically along the central axis of the fruit. We randomly chose one of each pair of longitudinal halves and used it for the image and spectrophotometric analyses. In addition, of the materials used for the image and spectrophotometric analyses, 51 fruits were subjectively selected so as to cover the variation of UV-excited fluorescence, and used for HPLC analysis to measure fluorescent compound levels.
| Cultivar | n | Skin | Cut surface | Anthocyanin | |||||
|---|---|---|---|---|---|---|---|---|---|
| L* | a* | b* | L* | a* | b* | Gr | |||
| Akihime | 10 | 45.8 ± 3.8 a | 55.1 ± 2.9 ab | 33.3 ± 4.4 ab | 75.6 ± 4.1 bcd | 18.2 ± 6.2 def | 8.0 ± 2.2 f | 13.9 ± 2.6 defg | 0.053 ± 0.017 ef |
| Amaou | 10 | 35.6 ± 2.6 fg | 49.0 ± 2.6 cde | 20.3 ± 4.0 f | 57.4 ± 2.4 h | 45.0 ± 2.8 a | 25.5 ± 2.0 a | 4.6 ± 0.8 g | 0.163 ± 0.020 a |
| Asukaruby | 10 | 41.0 ± 3.1 bcd | 53.4 ± 3.6 abc | 25.7 ± 5.4 cdef | 64.1 ± 5.4 g | 30.6 ± 5.0 b | 11.0 ± 3.2 def | 19.8 ± 6.5 cdef | 0.089 ± 0.028 cd |
| Benihoppe | 10 | 41.2 ± 3.1 bcd | 48.8 ± 3.0 cde | 27.9 ± 3.4 bcde | 75.6 ± 3.2 bcd | 19.5 ± 5.6 cde | 12.7 ± 2.6 cde | 18.1 ± 3.9 cdefg | 0.072 ± 0.019 de |
| Hinoshizuku | 10 | 39.7 ± 2.2 def | 52.3 ± 1.4 bc | 25.9 ± 3.0 cdef | 70.0 ± 4.4 def | 25.7 ± 3.2 bc | 9.5 ± 1.6 ef | 22.4 ± 7.8 bcdef | 0.089 ± 0.013 cd |
| Kaorino | 10 | 44.3 ± 2.7 abc | 54.8 ± 2.6 ab | 30.9 ± 1.8 bc | 80.3 ± 2.1 ab | 12.6 ± 4.0 fg | 9.8 ± 2.1 def | 28.7 ± 9.1 abc | 0.042 ± 0.014 f |
| Karenberry | 10 | 40.3 ± 1.3 cde | 49.1 ± 2.3 cde | 23.0 ± 3.4 ef | 64.7 ± 4.9 fg | 30.6 ± 1.9 b | 13.1 ± 1.0 cd | 12.5 ± 1.6 efg | 0.094 ± 0.013 cd |
| Nyoho | 8 | 37.8 ± 0.8 defg | 51.3 ± 1.1 bcd | 23.0 ± 1.3 def | 68.9 ± 2.0 efg | 28.8 ± 1.7 b | 12.8 ± 1.5 cde | 18.7 ± 2.2 cdefg | 0.094 ± 0.005 bcd |
| Sachinoka | 10 | 37.0 ± 3.1 defg | 50.5 ± 3.4 bcde | 26.0 ± 5.3 cdef | 69.9 ± 5.6 ef | 25.9 ± 7.9 bc | 14.4 ± 3.4 c | 40.4 ± 22.2 a | 0.108 ± 0.019 bc |
| Sachinoka | 10 | 33.8 ± 2.7 g | 46.2 ± 4.1 e | 20.5 ± 5.1 f | 68.2 ± 2.8 efg | 29.2 ± 4.0 b | 18.1 ± 2.5 b | 27.9 ± 18.4 abcd | 0.124 ± 0.015 b |
| Sachinoka | 10 | 36.2 ± 4.1 efg | 46.8 ± 4.4 de | 21.6 ± 6.8 ef | 69.5 ± 2.2 efg | 28.9 ± 3.0 b | 15.3 ± 1.4 bc | 36.2 ± 9.0 ab | 0.115 ± 0.029 bc |
| Sagahonoka | 10 | 47.1 ± 2.5 a | 57.8 ± 1.8 a | 37.8 ± 1.9 a | 83.1 ± 2.0 a | 7.3 ± 2.8 g | 7.8 ± 1.5 f | 24.5 ± 3.4 bcde | 0.033 ± 0.008 f |
| Sanukihime | 10 | 45.0 ± 3.5 ab | 50.0 ± 3.9 cde | 29.9 ± 3.9 bcd | 76.8 ± 3.2 bc | 15.5 ± 4.5 ef | 9.6 ± 2.4 ef | 9.7 ± 1.8 fg | 0.060 ± 0.019 ef |
| Tochiotome | 10 | 39.0 ± 3.4 def | 47.0 ± 3.7 de | 21.3 ± 5.5 f | 72.0 ± 3.7 cde | 24.7 ± 3.8 bcd | 13.2 ± 1.8 cd | 19.1 ± 5.2 cdef | 0.093 ± 0.026 cd |
| Average | 40.3 | 50.9 | 26.2 | 71.1 | 24.5 | 12.9 | 21.2 | 0.088 | |
| C.V. | 0.10 | 0.07 | 0.20 | 0.10 | 0.38 | 0.36 | 0.47 | 0.39 | |
n, number of fruits; C.V., Coefficient of variation.
Lots (cultivars) labeled with different letters differed significantly at p < 0.05, Tukey-Kramer multiple-comparison test.
For photography under visible light conditions, a handmade lighting chamber was used to provide uniform illumination during image acquisition (Fig. 1). We placed each longitudinally halved fruit in the center of the lighting chamber, and photographed it with or without a cylindrical white Kent paper (approximately 10 cm in diameter), which was used to convert irradiated light from the two fluorescent lights (Fluorescent High Frequency Linear Light, Edmund Optics Inc., Barrington, NJ, USA) into diffused light. The distance from the camera lens to the fruit was maintained at approximately 60 cm. We photographed both sides of each fruit half (that is, the fruit skin and the cut surface) using a Nikon D70 camera (Nikon Corp., Tokyo, Japan) with a Nikon UV-105 mm F4.5 lens (Tochigi Nikon Corp., Ohtawara, Tochigi, Japan). Images were saved in JPEG file format and converted into BMP format after preprocessing steps such as trimming the image and changing the background color. For fruit skin or cut surface part of each image, we calculated the average red (R), green (G) and blue (B) values of the RGB color model, the hue (H), saturation (S) and lightness (L) values of the HSL color model and the L*, a* and b* values of the CIE-Lab color model as color features of the fruit skin or cut surface of each fruit.

Schematic diagrams of the photographic equipment under (A) visible light and (B) ultraviolet (UV) light.
For photography under ultraviolet light conditions, a lighting chamber (CSN-15AC/AC, Cosmo Bio Co., Ltd., Tokyo, Japan) consisting of two black light (UV) lamps (CST-15A, Cosmo Bio Co., Ltd., Tokyo, Japan) that emitted near-UV rays (around 365 nm) was used. The fruit skin and cut surface were photographed through several different types of filters mounted on the Nikon UV-105 mm F4.5 lens fitted to the Nikon D70. The filters used were a band-pass filter (U-360, Hoya Corp., Tokyo Japan) that transmits ultraviolet light and absorbs visible light and long-pass filters (GG455, GG475, GG495 and OG515, Schott AG, Mainz, Germany) that attenuated shorter wavelengths and transmitted longer wavelengths over the active range of the target spectrum. For example, the stopband limit λs (specified at 0.001% internal transmittance), cut-off position λs (specified at 50% internal transmittance) and pass-band limit λp (specified at 92% internal transmittance for this filter) of GG475 are 410 nm, 475 ± 6 nm and 550 nm, respectively. All necessary adjustments, such as focus control and f-stop, were determined under visible light conditions in a pilot study. Images were saved in JPEG file format and converted into BMP format after preprocessing steps such as trimming and changing the background color. Since the strength of blue fluorescence can be represented by grayscale values (Gr = 0.299R + 0.587G + 0.114B), average grayscale values (Gr) for the fruit skin and cut surface were calculated as color features.
Spectrophotometric and HPLC analysesAnthocyanin and fluorescent compound levels per unit weight of strawberry fruit were measured by means of spectrophotometry and HPLC, respectively, based on the following simplified methods. Each longitudinally halved fruit was weighed and finely crushed with a plastic stirring rod in a 250-mL plastic bottle. Each sample (at x g) was extracted with a solvent (at 9 × x mL), methanol : formic acid : water (19 : 1 : 20 v/v/v), in a refrigerator for 24 h. After visual confirmation that the solid residue had decolorized almost completely, the supernatant (25 mL) was placed in polypropylene centrifugation tubes and centrifuged at 10,000 rpm for 10 minutes at 15°C. The filtrates were then diluted 10-fold with distilled water. The absorption of each diluted filtrate was measured spectrophotometrically at 510 nm (U-2810, Hitachi High-Technologies Corp., Tokyo, Japan). The HPLC analysis was performed on an LC10-vp system (Shimadzu, Kyoto, Japan) with a fluorimetric detector. Twenty μL of each diluted filtrate was injected into a Mightysil RP-18GP (Kanto Chemical Co., Inc., Tokyo, Japan) column (5 μm, 150 × 4.6 mm), which was eluted with a gradient of 1% acetic acid (A) and 90% acetonitrile (B) at a flow rate of 1 mL/min. The gradient profile used was 0–2 min., isocratic 0% B, 2–42 min. 0%–20% B and 42–45 min. isocratic 20% B. The signals were monitored through excitation and emission wavelengths at 360 nm and 450 nm, respectively.
Statistical analysesDifferences between pairs of cultivars (or lots) in terms of color features, anthocyanin content and fluorescent compound content were examined by using the Tukey-Kramer multiple-comparison procedure. Correlations between color components and anthocyanins levels were analyzed by using Pearson’s product-moment correlation analysis using averages of cultivars (or lots). To obtain the best set of parameters (color components) for predicting anthocyanin content, we conducted stepwise multiple regression analyses separately for each color model (i.e., RGB, HSL and CIE-Lab) using average values for the cultivars (or lots). Forward selection of independent variables was performed by using a significance level of 5%. Relationship between the Gr values for the UV-excited fluorescence images and fluorescent compounds level was also analyzed by correlation analysis. All statistical analyses were performed using the JMP 8.0 software (SAS Institute Inc., Cary, NC, USA).
Skin and cut surface colors differed greatly among cultivars (or lots) under visible light (Fig. 2A, 2C). Since both the skin and the cut surface of strawberry fruit strongly reflect light, placement of the white Kent paper on the space between the light source and the object was very helpful when evaluating the color (Fig. 2A). The UV absorption (or reflection) of strawberry skin did not differ among cultivars (Fig. 2B), and UV-excited fluorescence was not observed for all cultivars (figure not shown). In contrast, the UV absorption (or reflection) of the strawberry’s cut surface varied widely among cultivars (Fig. 2D) and strong UV-excited fluorescence was observed for several cultivars (Fig. 2E, 2F and Table 1). Fig. 2E and 2F shows cut surface images under ultraviolet light with long-pass filters GG475 and GG495 respectively. These two images were similar to those with other two filters, GG455 and OG515 (figure not shown). The cut surface area that absorbed UV light corresponded to the red-pigmented area, where anthocyanins were present (Fig. 2C, 2D). The area that did not excite fluorescence also tended to correspond to the red-pigmented area, whereas the white area, which has little to no anthocyanins, did not necessarily excite fluorescence (Fig. 2E, 2F). For example, the central part of the cut surface of the ‘Sagahonoka’ and ‘Akihime’ cultivars tended to be white, but did not excite fluorescence strongly (Fig. 2E, 2F). In contrast, the white central part of the ‘Sachinoka’ and ‘Kaorino’ cultivars exhibited strong fluorescence (Fig. 2E, 2F). In addition, in some cultivars, such as ‘Sachinoka’ the edges of the fruit, which were moderately red, excited fluorescence strongly (Fig. 2E, 2F). For further image analyses, we used the following images that differed among the cultivars: skin and cut surface images photographed under visible light conditions with white Kent paper (Fig. 2A, 2C) and UV-excited fluorescence images photographed with a GG475 filter (Fig. 2E).
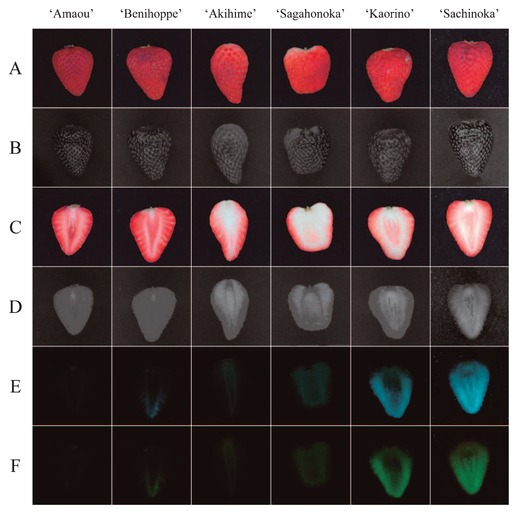
Examples of skin and cut surface images of seven cultivars photographed in several ways: (A) skin images under visible light with a cylindrical white Kent paper; (B) skin images under ultraviolet light with a band-pass filter that transmits ultraviolet light and absorbs visible light; (C) cut surface images under visible light with a cylindrical white Kent paper, (D) cut surface images under ultraviolet light with a band-pass filter that transmits ultraviolet light and absorbs visible light, and with long-pass filters (E) GG475 and (F) GG495 that attenuate shorter wavelengths and transmit longer wavelengths over the active range of the target spectrum.
In the visible images there were significant differences between cultivars (or lots) for all of the color component values of the CIE-Lab (Table 1), RGB and HSL (data not shown) color models. The coefficients of variation (CVs) for these color components in the skin and cut surface ranged from 0.02 for the H value to 0.20 for the b* value and from 0.02 for the R value to 0.38 for the a* value, respectively. For most of the color components, the CVs for the cut surface were larger than those for the skin, and the a* and b* values were particularly high for the cut surface (Table 1). Anthocyanin content, evaluated by means of spectrophotometric analysis, also differed significantly among cultivars (or lots) and its CV was higher than that of any color component (Table 1).
Significant correlations were observed between color components and anthocyanin content. In each color model, the highest correlation coefficients between color components and anthocyanin content were −0.954 for the B value of the cut surface in the RGB model, 0.947 for the S value of the cut surface in the HSL color model and 0.942 for the a* values of the cut surface in the CIE-Lab color model (Fig. 3). Forward stepwise multiple regression analyses indicated that the B value of the cut surface and the R and B values of the skin were significant predictors of anthocyanin content in the RGB color model (R2 = 0.978, F = 150.12, p < 0.0001), as were the S and L values of the cut surface and the L value of the skin in the HSL color model (R2 = 0.948, F = 100.46, p < 0.0001) and the a* and b* values of the cut surface in the CIE-Lab color model (R2 = 0.980, F = 160.09, p < 0.0001) (Table 2). Due to concerns of multicollinearity in the model, we calculated the variation inflation factor (VIF) for each predictor variable. None of the VIFs were greater than 4.0, indicating that multicollinearity among the independent variables was not an issue.
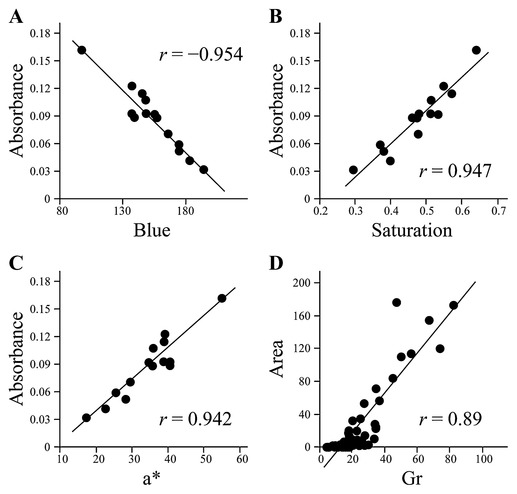
Scatterplot diagrams for several color components of cut surface images and levels of anthocyanins and UV-excited fluorescent compounds evaluated by means of spectrophotometric and HPLC analyses, respectively. (A) blue of the RGB color model vs. anthocyanin content (n = 14), (B) saturation of the HSL color model vs. anthocyanin content (n = 14), (C) a* of the CIE-Lab color model vs. anthocyanin content (n = 14), (D) grayscale value of UV-excited fluorescence images vs. fluorescent compounds (n = 51). r, Pearson’s correlation coefficient.
| Variable | Estimate | SE | t value | Pr > |t| |
|---|---|---|---|---|
| RGB (R2 = 0.978, F = 150.12, p < 0.0001) | ||||
| Intercept | 0.4214 | 0.0286 | 14.71 | <0.0001 |
| Cut surface B | −0.0010 | 0.0001 | −8.76 | <0.0001 |
| Skin R | −0.0007 | 0.0002 | −4.37 | 0.0014 |
| Skin B | −0.0011 | 0.0005 | −2.24 | 0.0488 |
| HSL (R2 = 0.948, F = 100.46, p < 0.0001) | ||||
| Intercept | 0.1368 | 0.0683 | 2.00 | 0.0704 |
| Cut surface S | 0.2485 | 0.0433 | 5.74 | 0.0001 |
| Cut surface L | −0.2287 | 0.0697 | −3.28 | 0.0073 |
| CIE-Lab (R2 = 0.980, F = 160.09, p < 0.0001) | ||||
| Intercept | 0.1334 | 0.0357 | 3.74 | 0.0038 |
| Cut surface a* | 0.0016 | 0.0003 | 4.83 | 0.0007 |
| Cut surface b* | 0.0022 | 0.0006 | 3.41 | 0.0067 |
| Skin L | −0.0028 | 0.0007 | −3.96 | 0.0027 |
We also found significant differences between cultivars (or lots) in terms of the Gr values of the UV-excited fluorescence images (photographed with the GG475 filter) of the cut surface. The CV of the Gr value was 0.47, which was higher than the CVs of the color components of the visible images (Table 1). Fig. 4 shows a typical HPLC chromatogram of extracts from non-, weakly, intermediately and strongly UV-excited fluorescent fruits. The chromatograms of UV-excited fluorescent fruits had two relatively strong peaks at retention times of near 15 and 17 min. The first eluting peak was smaller than the second, especially for strongly UV-excited fluorescent fruit (Fig. 4D). The areas of the two peaks were then summed and the resultant value used as the level of the fluorescent compounds. As expected, the Gr values for the UV-excited fluorescence images were significantly correlated with the levels of fluorescent compounds (Fig. 3D).
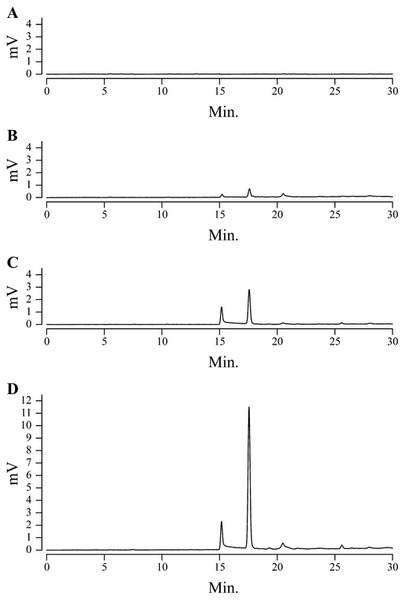
HPLC chromatograms of UV-excited fluorescent compounds of (A) non-, (B) weakly, (C) intermediately and (D) strongly fluorescent fruits.
The red color of strawberry fruit is essentially determined by anthocyanins and as a result, breeders and researchers can estimate anthocyanin levels by visual assessment and colorimeters (e.g., Maegawa et al. 1992, Urata et al. 1991, Yoshida et al. 2002). Therefore, it can easily be seen how image analysis of the red depth of fruit could provide more objective and accurate estimates of anthocyanin content. However, there was little research to support clear and strong relationships between image information and pigment content in the strawberry. In this study, we successfully demonstrated the usefulness of a simple method to estimate anthocyanin levels based on image analyses. Using this method, we found that the cut surface (flesh) color was a more effective estimator than was skin color. Yoshida and Tamura (2005) revealed that the difference in the concentration of anthocyanins among cultivars was larger in inner flesh than in skin. Similarly, there was wider variation in cut surface color than in skin color among our samples (Table 1), particularly cultivars whose inside does not turn red, such as ‘Sagahonoka’ and ‘Kaorino’ (Fig. 2C). The wider variation would partly result in superiority of the cut surface colors as estimators of anthocyanin levels. Anthocyanin content was efficiently estimated by using a single color component of each color model, such as the blue of the RGB model, saturation of the HSL model, or a* of the CIE-Lab color model in the cut surface image (Fig. 3). However, analysis of more than one color component of the skin or cut surface images improved the accuracy of the estimation of anthocyanin content (Table 2). No one color model was far superior to the others, indicating that any of the three color models could be used to estimate anthocyanin content.
The cut surface of the strawberry fruits of some cultivars emits fluorescence under UV light, indicating that the fruits of these cultivars bear fluorescent compounds in their internal parts. Previous studies have shown that the UV-induced blue-green fluorescence emission of banana fruit is due to chlorophyll catabolites (Moser et al. 2008, 2009). Similar fluorescence emission observed from the leaves of many species is thought to be primarily due to hydroxycinammic acid derivatives (that is, phenolic acid compounds) such as ferulic acid, p-coumaric acid and caffeic acid and to flavonoids such as kaempferol and quercetin (Lichtenthaler and Schweiger 1998, Morales et al. 1996). In the case of the strawberry, the kind and the amount of compounds in the fruit (Määttä-Riihinen et al. 2004, Mattila et al. 2006, Zhang et al. 2008) and their light-absorbing characteristics suggest that hydroxycinnamic acid derivatives, especially coumaric acid and its glycosides, are most likely responsible for the blue-green fluorescence. The hydroxycinnamic acid derivatives are well known to be associated with antioxidant activity and other human health benefits (Balasundram et al. 2006, Szajdek and Borowska 2008). The significant correlation between the fluorescent signal strength and the level of the phenolic acid compounds, as determined by HPLC analysis, indicates that UV-excited fluorescence photography techniques and image analysis will be useful tools to obtain information about phenolic acid compound levels and their distribution within a fruit.
Optical instruments such as digital cameras and scanners are now commonplace and it is easy to acquire digitized photographs. In fact, many breeders photograph their breeding materials and store the images on their computers. In many cases, the purpose of photography has been limited to recording plant part appearance and image data have not been widely used for other purposes. However, we can expand the use of image data if we modify the photographic techniques and environments slightly. Our approach not only provides more objective and quantitative evaluation of red color compared with human visual assessment, but it also allows estimates of levels of anthocyanins and colorless phenolic acids that are invisible to the naked eye. These days, it is hard to argue with the health benefits of a diet rich in vegetables and fruits, and those that contain large amounts of phenolic compounds such as flavonoids and phenolic acids have enhanced marketability. Therefore, we anticipate that breeders will have an increased need to evaluate the phenolic compound content of the strawberries in their breeding programs. The estimation methods described here have the potential to replace lengthy lab work and expensive lab equipment with rapid image analyses and relatively inexpensive computers and optical instruments. From a long-range viewpoint, this should promote efficiency and reduce costs in breeding programs. Therefore, the image analyses described here represent useful tools for evaluating genotypes rich in phenolic compounds and for selecting promising genotypes in strawberry breeding.
We thank the Fukuoka Agricultural Research Center, Saga Prefectural Agricultural Research Center and Shizuoka Prefectural Research Institute of Agriculture and Forestry for providing seedlings, and Emi Kitadani (NARO), Nobuko Fukino (NARO) and Takaharu Kameoka (Mie University) for their technical advice. This work was supported by KAKENHI (20880035).