Abstract
Micronutrient malnutrition, especially zinc (Zn) and iron (Fe) deficiency in diets, has aroused worldwide attention. Biofortification of food crops has been considered as a promising approach for alleviating this deficiency. Quantitative trait locus (QTL) analysis was performed to dissect the genetic mechanism of Zn and Fe content in maize grains using a total of 218 F2:3 families derived from a cross between inbred lines 178 and P53. Meta-analysis was used to integrate genetic maps and detect Meta-QTL (MQTL) across several independent QTL researches for traits related to Zn or Fe content. Five significant QTLs and 10 MQTLs were detected. Two informative genomic regions, bins 2.07 and 2.08, showed a great importance for Zn and Fe content QTLs. The correlation between Zn and Fe level in maize grains was proposed by MQTLs as 8 of the 10 involved both traits. The results of this study suggest that QTL mapping and meta-analysis is an effective approach to understand the genetic basis of Zn and Fe accumulation in maize grains.
Introduction
A diversified diet with adequate micronutrients is prerequisite for human health. These nutrient elements include vitamins and trace minerals, of which zinc (Zn), iron (Fe) and vitamin A are defined as the most frequently deficient elements in diets by WHO (2002). The micronutrient Zn, required as a cofactor in over 300 enzymes (Coleman 1998), is essential for living organisms. This element participates not only in DNA transcription, protein, nucleic acid, carbohydrate and lipid metabolism (Broadley et al. 2007, Ishimaru et al. 2011, Palmer and Guerinot 2009), but also in the control of gene transcription and the coordination of other biological processes (Rhodes and Klug 1993, Vallee and Falchuk 1993). A deficiency in Zn leads to diarrhoeal diseases, lower respiratory infections and malaria (Maret and Sandstead 2006, WHO 2002). Fe is also an important micronutrient required by all organisms and plays an essential role in several metabolic pathways including photosynthesis, respiration, chlorophyll synthesis and other fundamental redox reactions (Briat et al. 1995, Briat and Lobréaux 1997). Fe deficiency-induced anemia has been reported to affect approximately 1/3 of world population, especially children and women (Boccio and Iyengar 2003, FAO 2006, Stein 2010).
Dietary diversification and supplementation with efficient micronutrients might be a practical approach to alleviate mineral deficiencies (Maberly et al. 1994, Zhao and Shewry 2011). However, many people in developing countries do not eat a balanced diet and rely on a staple diet of cereals such as rice (Oryza sativa) and maize (Zea mays L.), which is low in Zn and Fe content (Bouis 2000, Welch and Graham 2002). Therefore, biofortification, a process relies on conventional plant breeding and biotechnology to increase the micronutrient content in crop plants, has emerged as an alternative approach to tackle malnutrition in the developing world (Bouis and Welch 2010, Nestel 2006, Pfeiffer and McClafferty 2007, White and Broadley 2005).
Finding genes which control accumulation of Zn and Fe in grains of major cereals is the precondition for biofortified breeding program. Previous studies have shown that the Zn and Fe metabolism, involving processes of mobilization, up-taking, translocation and accumulation, is a complex process regulated by many genes (Bashir et al. 2012, Kobayashi and Nishizawa 2012, Lee et al. 2012, Palmgren et al. 2008). In addition, other factors such as metal chaperones, chelators and Zn analogues might also contribute to ultimate mineral density in grains. QTL mapping is a powerful and widely-used tool for dissecting the genetic basis of complex trait in plants and animals. Recent QTL analyses have been performed in Arabidopsis thaliana (Waters and Grusak 2008), rice (Garcia-Oliveira et al. 2009, Stangoulis et al. 2007), bean (Blair et al. 2009, Cichy et al. 2009, Gelin et al. 2007), wheat (Genc et al. 2009, Peleg et al. 2009, Tiwari et al. 2009) and even mungbean (Sompong et al. 2012) to identify locus associated with minerals. A few QTL mapping researches have also been conducted on micronutrient content in maize (Lung’aho et al. 2011, Qin et al. 2012, Šimić et al. 2012, Zhou et al. 2010); however, the results were inconsistent possibly due to the differences in mapping populations, genotypes and environments used in these studies (Austin and Lee 1996, Li et al. 2007). Therefore, it is necessary to carry out more QTL analyses for such traits as Zn and Fe content in order to detect more loci and ultimately identify consistent QTLs for future fine mapping, marker-assisted selection (MAS) and map-based cloning.
To obtain consensus QTLs and gain more information on the genetic architecture of grain Zn and Fe content, it is necessary to make a comprehensive comparison among QTLs reported in independent studies. QTL meta-analysis is an approach to integrate such QTLs and determined true QTLs with more accurate position and smaller confidence interval (CI) (Arcade et al. 2004, Goffinet and Gerber 2000). This method has been used in various integrations of traits and species (Li et al. 2013, Qi et al. 2011, Shi et al. 2009, Swamy et al. 2011). In maize, 313 QTLs for flowering time found in 22 studies were synthesized into 62 consensus QTLs (Chardon et al. 2004). Truntzler et al. (2010) obtained 26 and 42 MQTLs for digestibility and cell wall composition traits from 50 and 150 QTLs, respectively. Also, compiling and comparing 239 QTLs for drought tolerance under water stressed conditions and 160 detected under control conditions, Hao et al. (2010) identified 39 consensus QTLs under water stressed condition and 36 under control condition from 12 populations tested in 22 experiments.
The objectives of this study were 1) to detect associations between QTLs and Zn and Fe content of maize grains based on QTL mapping with 218 F2:3 families derived from a cross between two maize inbred lines with different grain Zn content and 2) to identify consistent QTLs from this study and other independent experiments using meta-analysis and ultimately find informative genetic regions for next research steps in maize.
Materials and Methods
Plant material and field trial
Two maize inbred lines 178 and P53, which were significantly different in grain Zn and Fe content according to our previous study (Gao et al. 2008), were crossed to develop a F2:3 mapping population in this study. The 218 F2:3 families of the population, along with both parents, were grown in field plots with 4 m long and space between rows being 60 cm and density of 60,000 plants ha−1 at the Experimental Station of Hebei Agricultural University, Baoding, China, in the spring of 2009, through single seed descent method. The maize plants were managed following local standard cultivation management practices. When the maize matured, the grains were harvested and used for the evaluation of Zn and Fe content.
Micronutrient testing
All harvested grain samples were cleaned, dried, ground with stainless steel grain crusher and oven-dried at 60–70°C for 2 hours to get sample powder. Two samples were collected for each line and the sample (1 g) was weighed and then charred using electric hot plate at 300°C until smoke appeared. Ashed samples were burned at 500°C for 5 hours by muffle furnace (until the samples were black to white or off-white in color), allowed to cool at room temperature and then dissolved in 5 ml of 1 : 1 hydrochloric acid (Gorsuch 1970). The same process was carried out for the preparation of blank solution. Micronutrient analysis of the samples was conducted by Atomic Absorption Spectrophotometer (Hitachi Z-5300 AA Spectrophotometer, Hitachi, Japan), following the atomic absorption method.
Map construction and QTL mapping
Leaf samples were collected at seedling (with three leaves) stage for isolation of total genomic DNA using a standard CTAB extraction method (Saghai-Maroof et al. 1984). A total of 240 SSR primer pairs selected from MaizeGDB (http://www.maizegdb.org/) based on their uniform coverage of all 10 maize chromosomes were used in this study. For the detection of SSR amplified products, electrophoreses were performed on 6% polyacrylamide gel. Ultimately, 93 markers were screened according to their polymorphism between the parents, 178/P53. Segregation distortion was tested for each marker (the proportion was 5.4%) and a few markers were excluded. The genetic linkage map was built using MAPMAKER/EXP3.0 (Lincoln et al. 1992) with an overall length of 1,042 cM and an average interval of 13.53 cM. Linkage groups were inferred at a log of the odds (LOD) threshold of 3.0 and map distances were obtained with the Kosambi mapping function (Kosambi 1943).
QTL analysis was conducted using composite interval mapping (CIM) by the software WinQTLCart2.5 (Wang et al. 2007) with the following parameters: standard model, 10 cM window size, five significant background markers, 2 cM walkspeed and 1,000 permutations of the phenotypic data at 1% level to determine the significance threshold for QTL detection.
Statistic analysis
The t test was performed to evaluate the difference between two parents in grain Zn and Fe content by Microsoft Office Excel 2003. Histograms of grain Zn and Fe content in 218 F2:3 families and Kolmogorov-Smirnov test for phenotypic data were conducted by SPSS Statistics17. Broad heritability (h2b) for the two traits was estimated as h2b = MSbetween families/(MSbetween families + MSwithin families) using one-way ANOVA.
QTL meta-analysis
QTL information was collected from four previous QTL studies which reported maize grain Zn and Fe content and the present study (Table 1). BioMercator2.1 software was used to conduct meta-analysis and estimate the number and positions of MQTLs initially presented by several QTLs mapped on the same or similar chromosome regions for the same or related traits detected under various conditions (Arcade et al. 2004, Goffinet and Gerber 2000). The integrated genetic map was obtained by projecting all the genetic linkage groups corresponding to reports mentioned above onto the reference map, IBM2 2008 neighbors, with homothetic function. A modified Akaike’s information criterion (AIC) was calculated to select the QTL model with varying numbers of MQTLs and the one with the lowest AIC value was chosen as a significant model to indicate the number of MQTLs on each chromosome. The consensus genetic map with the information of initial QTLs and MQTLs was constructed by MapChart 2.1 software (Voorrips 2002).
Table 1
Summary of recent QTL studies considered for Zn and Fe content in maize grain
| QTL study |
Population type |
Parents |
No. of environment |
Software and method |
Chromosome |
No. of QTL |
Range of R2a |
| Zn |
Fe |
Zn |
Fe |
| Lung’aho et al. (2011) |
RIL |
B73/Mo17 |
6 |
QTL Cartographer v2.5;
Composite Interval Mapping |
|
2, 5, 9 |
3 |
|
9.3–12 |
| Šimić et al. (2012) |
F4 |
B84/Os6-2 |
3 |
PLABQTL;
Composite Interval Mapping |
4 |
2, 6, 8 |
4 |
7.8 |
6.8–7.5 |
| Qin et al. (2012) |
F2:3(Mus) |
Mu6/SDM |
2 |
QTL IciMappping v3.0;
Forward Regression Analysis |
1, 2, 6, 7, 9, 10 |
2, 9 |
14 |
6.3–21.3 |
10–21.1 |
|
F2:3(Mos) |
Mo17/SDM |
2 |
|
|
|
|
|
|
| Zhou et al. (2010) |
DH(a) |
DH8/DH40 |
2 |
QTL Mapper 1.6;
Mixed Linear Model |
2, 3, 4, 6, 7, 10 |
1, 2, 4, 6, 7, 10 |
17 |
9.4–48.8 |
10.2–43.7 |
|
DH(b) |
DH86/S137 |
2 |
|
|
|
|
|
|
| Present study |
F2:3 |
178/P53 |
1 |
QTL Cartographer v2.5; Composite Interval Mapping |
2, 5, 10 |
5 |
5 |
5.9–17.6 |
16.9 |
a Coefficient of determination: percentage of phenotypic variance explained by the QTL.
Results
Performance for grain Zn and Fe content
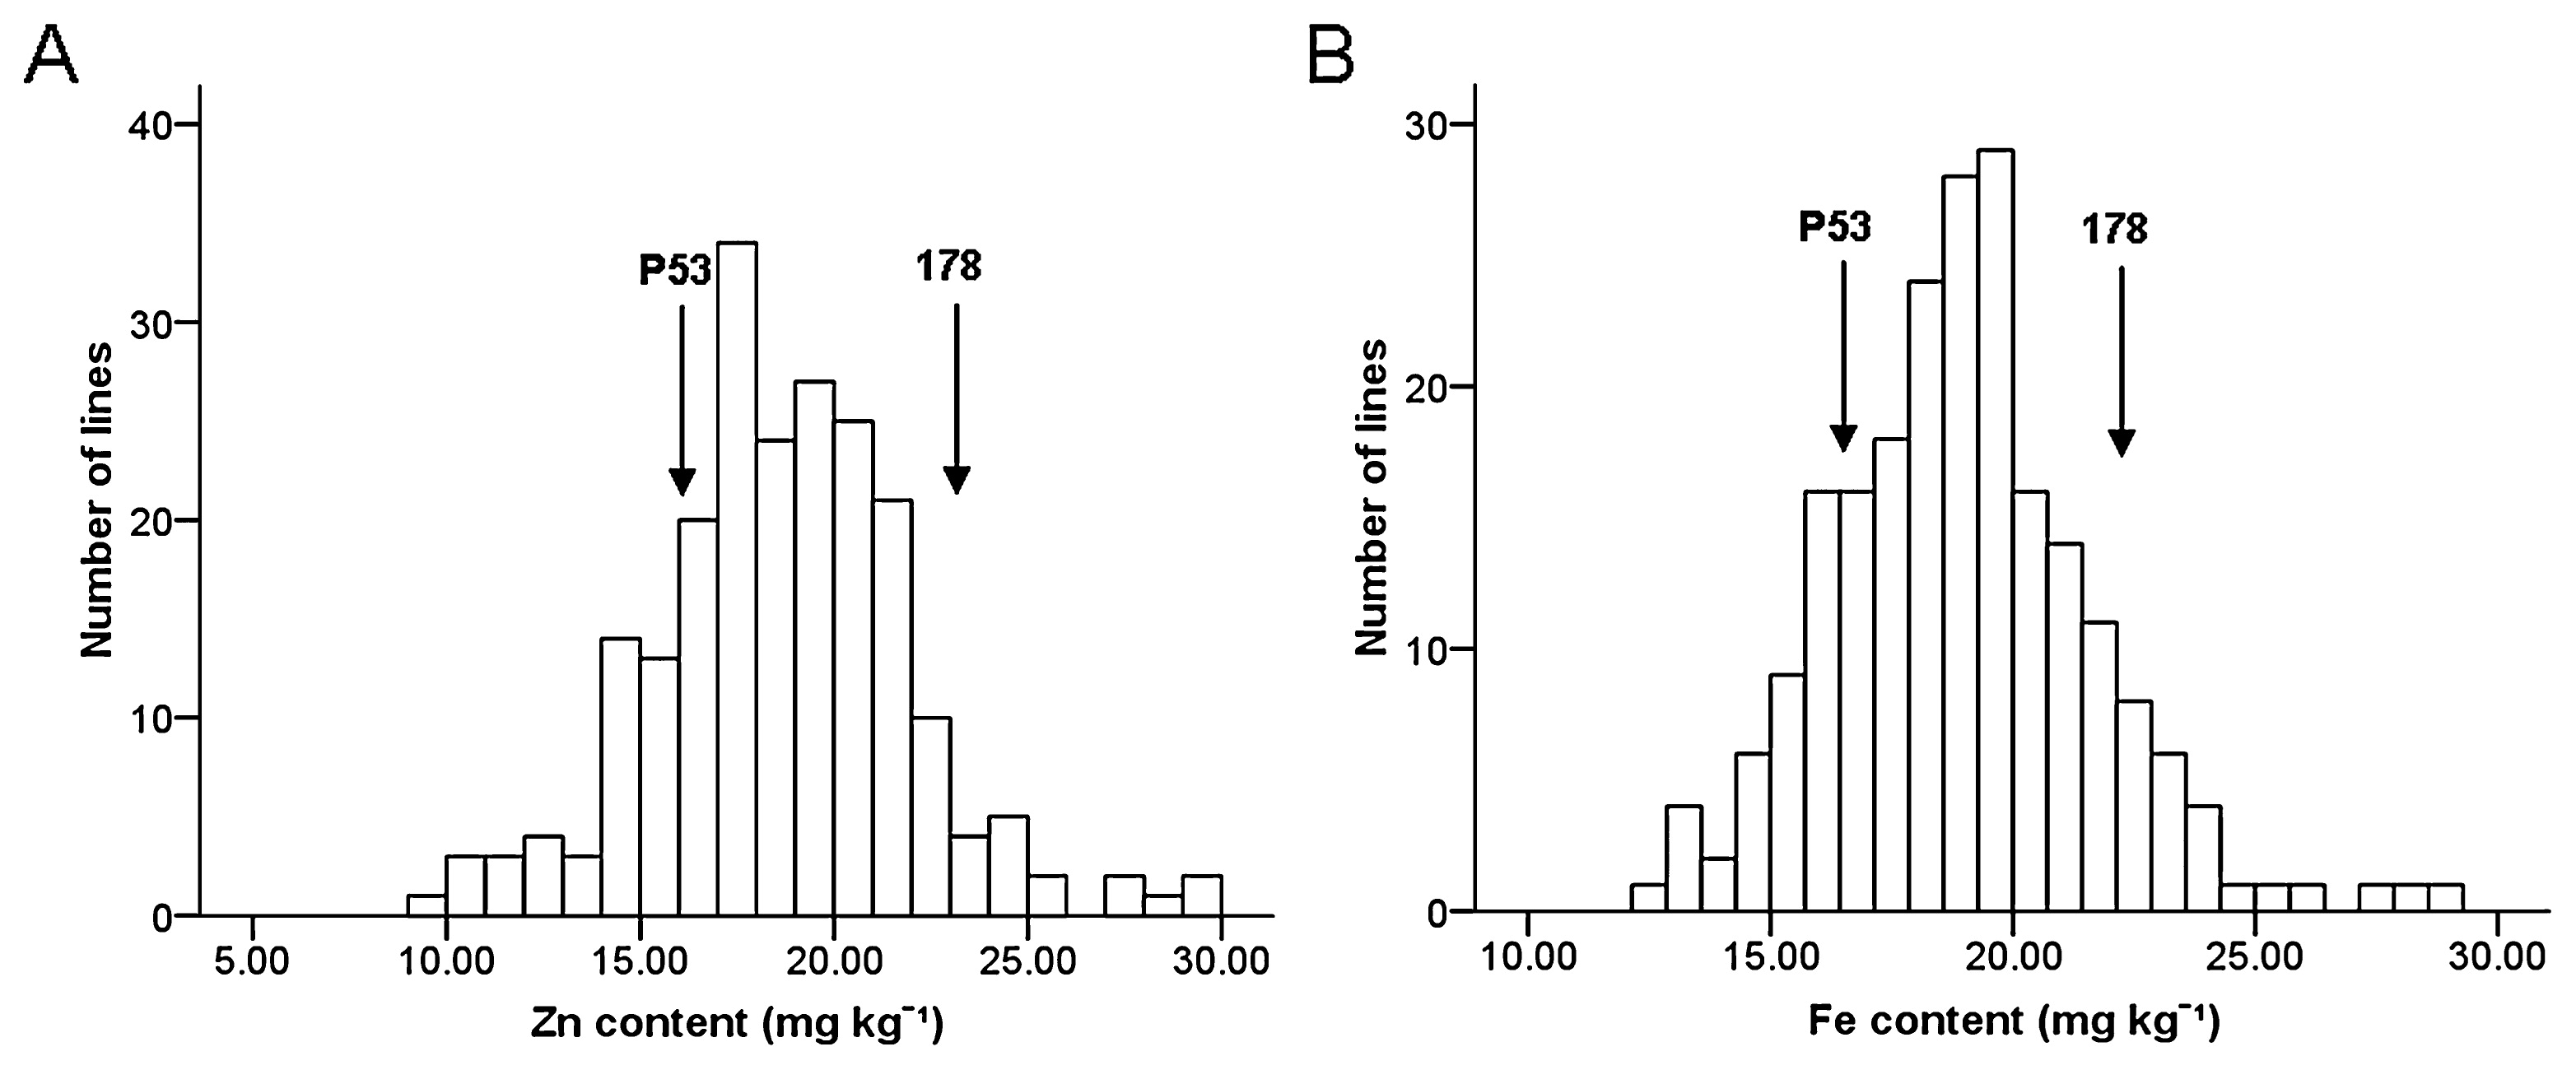
Fig. 1 shows the distribution of two grain mineral nutrients content of the F2:3 mapping population and the mean values of two parents grown during 2009. Significant differences (p < 0.05) between two parental lines for Zn and Fe were found by t test, with line 178 having higher mean values relative to P53. A considerable variation was observed for levels of the two traits in 218 F2:3 families, presenting a continuous segregation and normal distribution with P value greater than 0.05 (0.731 for Zn and 0.377 for Fe) derived from Kolmogorov-Smirnov test. In addition, transgressive segregation was found for both Zn and Fe content in this population. Broad heritability estimates were 0.57 for Zn and 0.36 for Fe content.
QTL analysis for Zn and Fe content
A total of 5 significant QTLs controlling grain Zn and Fe content were detected in this F2:3 mapping population (Table 2). For Zn content, 4 QTLs were identified on chromosomes 2, 5 and 10, whereas for Fe content, only one QTL was found on chromosome 5. The detected QTLs for Zn content explained 5.85–17.57% of phenotypic variation with LOD scores ranging from 3.01 to 5.58, of which qZn5 located on chromosome 5 exhibited the largest proportion of variance. The detected QTL, qFe5, for Fe content accounted for 16.89% of phenotypic variation with LOD score of 3.49. What noteworthy, in this case, was the co-localization of qZn5 and qFe5 on chromosome 5 in the marker interval umc1429–umc1060. Both additive and dominant effects were detected for all the QTLs on which the alleles from inbred line 178 had positive additive effect, except for qZn10 which had negative effect. The genes that control Zn content were mainly based on additive effect with dominant degrees less than 0.2, while the QTL detected for Fe content was partial dominant with dominant degree of 0.204.
Table 2
Significant QTL for maize grain micronutrient in the F
2:3 mapping population grown during 2009
| Trait |
QTL |
Marker interval |
LOD |
Aa |
Db |
|D|/|A|c |
Gene action |
R2f |
| Zn |
qZn2-1 |
bnlg1633–bnlg1138 |
3.01 |
1.2501 |
−0.234 |
0.187 |
Ad |
6.29 |
|
qZn2-2 |
umc1536–bnlg1633 |
3.17 |
1.1867 |
−0.200 |
0.168 |
A |
5.85 |
|
qZn5 |
umc1429–umc1060 |
5.58 |
2.5752 |
0.408 |
0.158 |
A |
17.57 |
|
qZn10 |
umc1506–umc2350 |
4.23 |
−1.3044 |
−0.092 |
0.071 |
A |
7.10 |
| Fe |
qFe5 |
umc1429–umc1060 |
3.49 |
1.7460 |
0.357 |
0.204 |
PDe |
16.89 |
f Coefficient of determination: percentage of phenotypic variance explained by the QTL.
In total, 54 QTLs responsible for Zn or Fe level in maize grains were collected from 5 researches, including this study. Based on the definition of meta-analysis, chromosome regions with only one QTL located were excluded from the analysis and then 28 QTLs were used for meta-analysis. After integration, 10 MQTLs mapped on six chromosomes at CI of 95% were found (Table 3). There were 3 MQTLs on chromosome 2; 2 on chromosome 4 and 9 and one on chromosome 3, 5 and 10 (Fig. 2). The mean phenotypic variation of the QTLs synthesized for corresponding MQTLs ranging from 8.75% to 28.30%. Seven out of 10 MQTLs had phenotypic variation more than 10%, and each MQTL consisted of 2 to 5 initial QTLs. Compared with original QTLs, CIs of all the MQTLs were narrowed, varying from 9.53 cM at bin 2.07 to 212.71 cM at bin 3.04–3.06. All the MQTLs except for MQTL1 and MQTL6 involved both Zn and Fe content related traits. All the QTLs found through QTL mapping in this study were integrated into MQTLs revealed through meta-analysis, of which MQTL2 included qZn2-1 and qZn2-2; MQTL7 included qZn5 and qFe5 and MQTL10 included qZn10.
Table 3
MQTLs identified by meta-analysis for maize grain Zn and Fe content across different studies
| MQTL |
Chromosomebin |
Position (cM) |
QTL region |
AICa |
QTL Model |
No of initial QTL |
Mean phenotypic variance of the QTL |
Mean initial QTL CIb (cM) |
MQTLc CI (95%) (cM) |
Related trait |
Present QTL integrated |
| MQTL1 |
2.04–2.07 |
424.41 |
bnlg1690-umc1890 |
110.96 |
3 |
2 |
9.15 |
177.91 |
101.25 |
Fe, Fe/P |
|
| MQTL2 |
2.07 |
515.02 |
umc1042-bnlg2077 |
|
|
4 |
12.85 |
24.78 |
9.53 |
Zn, Fe |
qZn2-1, qZn2-2 |
| MQTL3 |
2.08 |
623.09 |
umc1992-umc2374 |
|
|
5 |
15.37 |
80.36 |
32.48 |
Zn, Fe |
|
| MQTL4 |
3.04–3.06 |
305.19 |
mmp144a-umc1266 |
31.12 |
2 |
2 |
8.75 |
303.73 |
212.71 |
Zn/P, Fe/P |
|
| MQTL5 |
4.06 |
504.04 |
bnlg1621a-dupssr16 |
51.03 |
2 |
3 |
22.59 |
129.59 |
22.62 |
Zn, Fe, Fe/P |
|
| MQTL6 |
4.08 |
611.81 |
umc2009-umc2041 |
|
|
2 |
28.30 |
117.93 |
33.19 |
Zn |
|
| MQTL7 |
5.04 |
345.27 |
umc1110-bnlg1208 |
20.85 |
2 |
2 |
17.23 |
28.15 |
19.87 |
Zn, Fe |
qZn5, qFe5 |
| MQTL8 |
9.01 |
76.88 |
bnlg1583-umc2362 |
63.85 |
3 |
3 |
9.40 |
38.69 |
24.46 |
Zn, Fe |
|
| MQTL9 |
9.06–9.07 |
557.83 |
umc1310-bnlg128 |
|
|
2 |
11.47 |
124.70 |
85.08 |
Zn, Fe |
|
| MQTL10 |
10.04 |
327.87 |
umc1677-umc1054 |
37.82 |
2 |
3 |
14.85 |
144.38 |
67.32 |
Zn, Fe/P |
qZn10 |
a AIC = Akaike information criterion.
b CI = confidence interval.

Discussion
Feasibility of QTL mapping for mineral concentration in maize grains
Biofortification, especially Zn and Fe enhancement in crop food through genetic improvement, has been receiving much attention in recent years. Previous studies with maize have focused on germplasm assessment related to the genetic potential for increasing the density of Zn and Fe in grains (Bänziger 2000, Oikeh et al. 2003, Šimić et al. 2009). Until very recently, QTL analysis has been applied to biofortification traits in maize, and proved to be a powerful tool in the clarifying the genetic basis and molecular-physiological mechanisms conferring high level of grain micronutrient (Lung’aho et al. 2011, Qin et al. 2012, Šimić et al. 2012, Zhou et al. 2010). In the F2:3 mapping population applied in this study, we discovered QTLs for grain Zn and Fe content. Although our results were supported by one environmental experiment, all the five QTLs identified under this genetic background were included in MQTLs revealed through meta-analysis. The results demonstrated that QTL mapping of mineral content in maize grain is feasible and may be a practical approach to proceed with biofortification at the genetic and ultimately molecular level.
Consensus QTLs and informative genomic regions
Comparison of QTL results from different studies is difficult and tedious because results of QTL mapping may be influenced by such factors as genetic effects (genotypes, populations and generations), environments, mapping methods and even markers and population sizes (Boer et al. 2007, Brondani et al. 2002, Li et al. 2007, Li et al. 2011, Mihaljevic et al. 2004, Su et al.2010). Meta-analysis proposed by Goffinet and Gerber (2000) could effectively integrate QTLs detected across different studies and true QTLs with more accurate positions and reduced CIs could be provided. In the present study, meta-analysis was used to combine the QTL information related to maize grain Zn or Fe level derived from five independent researches, and total QTL number was decreased by 64% accompanied by reduced rate of CI varied from 29% to 83%. This illustrates the integration power of QTL meta-analysis.
Criterions for choosing MQTLs for MAS has been put forward by Löffler et al. (2009), that is (1) a small CI of the MQTL, (2) a high number of initial QTLs comprised in a MQTL and (3) a high mean effect of the MQTL corresponding to high mean explained phenotypic variances of initial QTLs. Meeting those criterions, 6 active regions for grain moisture content and 2 active regions for ear rot were highlighted by Xiang et al. (2012) through QTL meta-analysis. In this study, the genomic region of MQTL2 located on chromosome 2 (bin 2.07) in the marker interval umc1042–bnlg2077 might be a hot spot of important QTLs controlling grain Zn and Fe amount in maize, because MQTL2 was comprised of 4 initial QTLs with CI less than 10 cM and 12.85% of mean phenotypic variation. In addition, MQTL3 detected on chromosome 2 (bin 2.08) might be interesting to researchers as it consisted of the maximum number of initial QTLs with the mean phenotypic variation up to 15.37%, although it had a relatively broader CI. Since the two chromosome regions of MQTL2 and MQTL3 are informative, they may be worth for further research, such as fine mapping, MAS and map-based cloning. Construction of secondary mapping population, including introgression lines, is our work in progress.
Co-localization for mineral concentration
A co-localization of two QTLs, qFe5 and qZn5 located in the marker interval umc1429–umc1060 on chromosome 5, was discovered in this study. This is consistent with a previous study by Šimić et al. (2012) who reported a colocalization of three QTLs on chromosome 3 for Fe/P, Zn/P and Mg/P ratios and overlapping chromosome regions of 4 QTLs on chromosome 6 for Fe/P ratio, P, Fe and Mg concentration. Co-localizing QTLs for Fe and Zn concentration in bean grains on linkage group B11 were also identified (Blair et al. 2009), coinciding with the same marker or with closely linked markers in the intervals AN034D–V104D and K126G–Bng1.
Meta-analysis is not only a powerful tool for QTL integration, but also an effective approach to reveal the genetic correlations among traits. Eight of the 10 MQTLs found in the present study involved both Zn and Fe content or their related traits, demonstrating a huge tendency of colocalization of the two traits. Co-integration of QTLs responsible for several grain yield components was observed by Li et al. (2011), which were consistent with significant correlations among grain yield and its component traits. Also, 47 out of 55 QTLs related to seed yield co-localized with QTLs for other yield traits (Shi et al. 2009).
The phenomenon of co-localization of nutrient element QTLs may be due to tight linkage of distinct genes or pleiotropism, physiological association of micronutrient accumulation, suggesting the relationship at the molecular level among these traits. MQTLs derived from both Zn and Fe content QTLs would be helpful to crop improvement with enhanced density of grain Zn and Fe because the tightly conjoint traits could be selected simultaneously through MAS.
In conclusion, the results of this study indicate that two candidate chromosome regions, bin 2.07 and 2.08, had obvious associations with QTLs for Zn and Fe content in maize grains. Developing secondary mapping populations with regard to MQTLs is advisable and helpful to a thorough understanding of the genetic mechanism of micronutrient level in grains. In addition, the correlation of Zn content with Fe content at the molecular level revealed by MQTLs comprising both two traits would facilitate the simultaneous improvement of them through MAS.
Acknowledgements
This work was supported by a grant from the Hebei Province Science and Technology Support Program, China (12225510D) and National High Technology Research and Development Program (“863” Program) of China (2011AA10A103-3). We thank Drs. Xunzhong Zhang and John Fike at Virginia Polytechnic Institute and State University, Blacksburg, VA, USA for the critical review and comments of this manuscript.
Literature Cited
- Arcade, A., A. Labourdette, M. Falque, B. Mangin, F. Chardon, A. Charcosset and J. Joets (2004) BioMercator: integrating genetic maps and QTL towards discovery of candidate genes. Bioinformatics 20: 2324–2326.
- Austin, D.F. and M. Lee (1996) Comparative mapping in F2:3and F6:7generations of quantitative trait loci for grain yield and yield components in maize. Theor. Appl. Genet. 92: 817–826.
- Bänziger, M. and J. Long (2000) The potential for increasing the iron and zinc density of maize through plant-breeding. Food Nutr. Bull. 21: 397–400.
- Bashir, K., Y. Ishimaru and N.K. Nishizawa (2012) Molecular mechanisms of zinc uptake and translocation in rice. Plant Soil 361: 189–201.
- Blair, M.W., C. Astudillo, M.A. Grusak, R. Graham and S.E. Beebe (2009) Inheritance of seed iron and zinc concentrations in common bean (Phaseolus vulgaris L.). Mol. Breed. 23: 197–207.
- Boccio, J.R. and V. Iyengar (2003) Iron deficiency. Biol. Trace Elem. Res. 94: 1–31.
- Boer, M.P., D. Wright, L.Z. Feng, D.W. Podlich, L. Luo, M. Cooper and F.A. Van Eeuwijk (2007) A mixed-model quantitative trait loci (QTL) analysis for multiple-environment trial data using environmental covariables for QTL-by-environment interactions, with an example in maize. Genetics 177: 1801–1813.
- Bouis, H.E. (2000) Enrichment of food staples through plant breeding: a new strategy for fighting micronutrient malnutrition. Nutrition 16: 701–704.
- Bouis, H.E. and R.M. Welch (2010) Biofortification—a sustainable agricultural strategy for reducing micronutrient malnutrition in the global south. Crop Sci. 50: S20–S32.
- Briat, J.F., I. Fobis-Loisy, N. Grignon, S. Lobreaux, N. Pascal, G. Savino, S. Thoiron, N.V. Wiren and O.V. Wuytswinkel (1995) Cellular and molecular aspects of iron metabolism in plants. Biol. Cell 84: 69–81.
- Briat, J.F. and S. Lobréaux (1997) Iron transport and storage in plants. Trends Plant Sci. 2: 187–193.
- Broadley, M.R., P.J. White, J.P. Hammond, I. Zelko and A. Lux (2007) Zinc in plants. New Phytol. 173: 677–702.
- Brondani, C., P.H.N. Rangel, R.P.V. Brondani and M.E. Ferreira (2002) QTL mapping and introgression of yield-related traits from Oryza glumaepatula to cultivated rice (Oryza sativa) using microsatellite markers. Theor. Appl. Genet. 104: 1192–1203.
- Chardon, F., B. Virlon, L. Moreau, M. Falque, J. Joets, L. Decousset, A. Murigneux and A. Charcosset (2004) Genetic architecture of flowering time in maize as inferred from quantitative trait loci meta-analysis and synteny conservation with the rice genome. Genetics 168: 2169–2185.
- Cichy, K.A., G.V. Caldas, S.S. Snapp and M.W. Blair (2009) QTL analysis of seed iron, zinc, and phosphorus levels in an Andean bean population. Crop Sci. 49: 1742–1750.
- Coleman, J.E. (1998) Zinc enzymes. Curr. Opin. Chem. Biol. 2: 222–234.
- FAO (2006) The State of Food Insecurity in the World 2006, FAO.
- Gao, X.K., Y.Q. Huang and J.T. Chen (2008) Combining ability analysis of Zn and Fe content in maize seed. Journal of Plant Genetic Resources 9: 36–40.
- Garcia-Oliveira, A.L., L.B. Tan, Y.C. Fu and C.Q. Sun (2009) Genetic identification of quantitative trait loci for contents of mineral nutrients in rice grain. J. Integr. Plant Biol. 51: 84–92.
- Gelin, J.R., S. Forster, K.F. Grafton, P.E. McClean and G.A. Rojas-Cifuentes (2007) Analysis of seed zinc and other minerals in a recombinant inbred population of navy bean (Phaseolus vulgaris L.). Crop Sci. 47: 1361–1366.
- Genc, Y., A.P. Verbyla, A.A. Torun, I. Cakmak, K. Willsmore, H. Wallwork and G.K. McDonald (2009) Quantitative trait loci analysis of zinc efficiency and grain zinc concentration in wheat using whole genome average interval mapping. Plant Soil 314: 49–66.
- Goffinet, B. and S. Gerber (2000) Quantitative trait loci: a meta-analysis. Genetics 155: 463–473.
- Gorsuch, T.T. (1770) The destruction of organic matter. Pergamon Press, London.
- Hao, Z.F., X.H. Li, X.L. Liu, C.X. Xie, M.S. Li, D.G. Zhang and S.H. Zhang (2010) Meta-analysis of constitutive and adaptive QTL for drought tolerance in maize. Euphytica 174: 165–177.
- Ishimaru, Y., K. Bashir and N.K. Nishizawa (2011) Zn uptake and translocation in rice plants. Rice 4: 21–27.
- Kobayashi, T. and N.K. Nishizawa (2012) Iron uptake, translocation, and regulation in higher plants. Annu. Rev. Plant Biol. 63: 131–152.
- Kosambi, D.D. (1943) The estimation of map distances from recombination values. Ann. Hum. Genet. 12: 172–175.
- Lee, S., J.S. Jeon and G. An (2012) Iron homeostasis and fortification in rice. J. Plant Biol. 55: 261–267.
- Li, J.Z., Z.W. Zhang, Y.L. Li, Q.L. Wang and Y.G. Zhou (2011) QTL consistency and meta-analysis for grain yield components in three generations in maize. Theor. Appl. Genet. 122: 771–782.
- Li, W.T., C.J. Liu, Y.X. Liu, Z.E. Pu, S.F. Dai, J.R. Wang, X.J. Lan, Y.L. Zheng and Y.M. Wei (2013) Meta-analysis of QTL associated with tolerance to abiotic stresses in barley. Euphytica 189: 31–49.
- Li, Y.L., S.Z. Niu, Y.B. Dong, D.Q. Cui, Y.Z. Wang, Y.Y. Liu and M.M. Wei (2007) Identification of trait-improving quantitative trait loci for grain yield components from a dent corn inbred line in an advanced backcross BC2F2population and comparison with its F2:3population in popcorn. Theor. Appl. Genet. 115: 129–140.
- Lincoln, S.E., M.J. Daly and E.S. Lander (1992) Constructing genetic maps with MAPMAKER/EXP 3.0. Whitehead Institute Technical Report, Whitehead Institute, Cambridge, Massachusetts, USA.
- Löffler, M., C.C. Schön and T. Miedaner (2009) Revealing the genetic architecture of FHB resistance in hexaploid wheat (Triticum aestivum L.) by QTL meta-analysis. Mol. Breed. 23: 473–488.
- Lung’aho, M.G., A.M. Mwaniki, S.J. Szalma, J.J. Hart, M.A. Rutzke, L.V. Kochian, R.P. Glahn and O.A. Hoekenga (2011) Genetic and physiological analysis of iron biofortification in maize kernels. PLoS One 6: e20429 doi: 10.1371/journal.pone.0020429.
- Maberly, G.F., F.L. Trowbridge, R. Yip, K.M. Sullivan and C.E. West (1994) Programs against micronutrient malnutrition: ending hidden hunger. Annu. Rev. Public Health 15: 277–301.
- Maret, W. and H.H. Sandstead (2006) Zinc requirements and the risks and benefits of zinc supplementation. J. Trace Elem. Med. Biol. 20: 3–18.
- Mihaljevic, R., H.F. Utz and A.E. Melchinger (2004) Congruency of quantitative trait loci detected for agronomic traits in testcrosses of five populations of European maize. Crop Sci. 44: 114–124.
- Nestel, P., H.E. Bouis, J. Meenakshi and W. Pfeiffer (2006) Biofortification of staple food crops. J. Nutr. 136: 1064–1067.
- Oikeh, S.O., A. Menkir, B. Maziya-Dixon, R. Welch and R.P. Glahn (2003) Assessment of concentrations of iron and zinc and bioavailable iron in grains of early-maturing tropical maize varieties. J. Agric. Food Chem. 51: 3688–3694.
- Palmer, C.M. and M.L. Guerinot (2009) Facing the challenges of Cu, Fe and Zn homeostasis in plants. Nat. Chem. Biol. 5: 333–340.
- Palmgren, M.G., S. Clemens, L.E. Williams, U. Krämer, S. Borg, J.K. Schjørring and D. Sanders (2008) Zinc biofortification of cereals: problems and solutions. Trends Plant Sci.13: 464–473.
- Peleg, Z., I. Cakmak, L. Ozturk, A. Yazici, Y. Jun, H. Budak, A.B. Korol, T. Fahima and Y. Saranga (2009) Quantitative trait loci conferring grain mineral nutrient concentrations in durum wheat× wild emmer wheat RIL population. Theor. Appl. Genet. 119: 353–369.
- Pfeiffer, W.H. and B. McClafferty (2007) HarvestPlus: Breeding crops for better nutrition. Crop Sci. 47: S88–S105.
- Qin, H.N., Y.L. Cai, Z.Z. Liu, G.Q. Wang, J.G. Wang, Y. Guo and H. Wang (2012) Identification of QTL for zinc and iron concentration in maize kernel and cob. Euphytica 187: 345–358.
- Qi, Z.M., Q. Wu, X. Han, Y.N. Sun, X.Y. Du, C.Y. Liu, H.W. Jiang, G.H. Hu and Q.S. Chen (2011) Soybean oil content QTL mapping and integrating with meta-analysis method for mining genes. Euphytica 179: 499–514.
- Rhodes, D. and A. Klug (1993) Zinc fingers. Sci. Am. 268: 56–65.
- Saghai-Maroof, M.A., K.M. Soliman, R.A. Jorgensen and R.W. Allard (1984) Ribosomal DNA spacer-length polymorphisms in barley: Mendelian inheritance, chromosomal location, and population dynamics. Proc. Natl. Acad. Sci. USA 81: 8014–8018.
- Shi, J.Q., R.Y. Li, D. Qiu, C.C. Jiang, Y. Long, C. Morgan, I. Bancroft, J.Y. Zhao and J.L. Meng (2009) Unraveling the complex trait of crop yield with quantitative trait loci mapping in Brassica napus. Genetics 182: 851–861.
- Šimić, D., R. Sudar, T. Ledenčan, A. Jambrović, Z. Zdunić, I. Brkić and V. Kovačević (2009) Genetic variation of bioavailable iron and zinc in grain of a maize population. J. Cereal Sci. 50: 392–397.
- Šimić, D., S.M. Drinić, Z. Zdunić, A. Jambrović, T. Ledenčan, J. Brkić, A. Brkić and I. Brkić (2012) Quantitative trait loci for biofortifica tion traits in maize grain. J. Hered. 103: 47–54.
- Sompong, U., P. Somta, V. Raboy and P. Srinives (2012) Mapping of quantitative trait loci for phytic acid and phosphorus contents in seed and seedling of mungbean (Vigna radiata (L.) Wilczek). Breed. Sci. 62: 87–92.
- Stangoulis, J.C.R., B.L. Huynh, R.M. Welch, E.Y. Choi and R.D. Graham (2007) Quantitative trait loci for phytate in rice grain and their relationship with grain micronutrient content. Euphytica 154: 289–294.
- Stein, A.J. (2010) Global impacts of human mineral malnutrition. Plant Soil 335: 133–154.
- Su, C.F., W.G. Lu, T.G. Zhao and J.Y. Gai (2010) Verification and fine-mapping of QTLs conferring days to flowering in soybean using residual heterozygous lines. Chin. Sci. Bull. 55: 499–508.
- Swamy, B.P.M., P. Vikram, S. Dixit, H.U. Ahmed and A. Kumar (2011) Meta-analysis of grain yield QTL identified during agricultural drought in grasses showed consensus. BMC Genomics 12: 319.
- Tiwari, V.K., N. Rawat, P. Chhuneja, K. Neelam, R. Aggarwal, G.S. Randhawa, H.S. Dhaliwal, B. Keller and K. Singh (2009) Mapping of quantitative trait loci for grain iron and zinc concentration in diploid A genome wheat. J. Hered. 100: 771–776.
- Truntzler, M., Y. Barrière, M.C. Sawkins, D. Lespinasse, J. Betran, A. Charcosset and L. Moreau (2010) Meta-analysis of QTL involved in silage quality of maize and comparison with the position of candidate genes. Theor. Appl. Genet. 121: 1465–1482.
- Vallee, B.L. and K.H. Falchuk (1993) The biochemical basis of zinc physiology. Physiol. Rev.73: 79–118.
- Voorrips, R.E. (2002) MapChart: software for the graphical presentation of linkage maps and QTLs. J. Hered. 93: 77–78.
- Wang, S., C.J. Basten and Z.B. Zeng (2007) Windows QTL Cartographer 2.5. Department of Statistics, North Carolina State University, Raleigh, NC. http://statgen.ncsu.edu/qtlcart/WQTLCart.htm
- Waters, B.M. and M.A. Grusak (2008) Quantitative trait locus mapping for seed mineral concentrations in two Arabidopsis thaliana recombinant inbred populations. New Phytol. 179: 1033–1047.
- Welch, R.M. and R.D. Graham (2002) Breeding crops for enhanced micronutrient content. Plant Soil 245: 205–214.
- White, P.J. and M.R. Broadley (2005) Biofortifying crops with essential mineral elements. Trends Plant Sci.10: 586–593.
- World Health Organization (2002) World Health Report 2002. http://www.who.int/whr/2002/en/
- Xiang, K., L.M. Reid, Z.M. Zhang, X.Y. Zhu and G.T. Pan (2012) Characterization of correlation between grain moisture and ear rot resistance in maize by QTL meta-analysis. Euphytica 183: 185–195.
- Zhao, F.J. and P.R. Shewry (2011) Recent developments in modifying crops and agronomic practice to improve human health. Food Policy 36: S94–S101.
- Zhou, J.F., Y.Q. Huang, Z.Z. Liu, J.T. Chen, L.Y. Zhu, Z.Q. Song and Y.F. Zhao (2010) Genetic analysis and QTL mapping of zinc, iron, copper and manganese contents in maize seed. Journal of Plant Genetic Resources 11: 593–595.