Abstract
In Hokkaido, northern Japan, soybean [Glycine max (L.) Merr.] crops are damaged by cold weather. Chilling temperatures result in the appearance of cracking seeds (CS) in soybean crops, especially those grown in eastern and northern Hokkaido. Seed coats of CS are severely split on the dorsal side, and the cotyledons are exposed and frequently separated. CS occurrence causes unstable production because these seeds have no commodity value. However, little is known about the CS phenomenon. The aims of this study were to identify the cold-sensitive stage associated with CS occurrence and to develop a method to select CS-tolerant lines. First, we examined the relationship between chilling temperatures after flowering and CS occurrence in field tests. The average temperature 14 to 21 days after flowering was negatively correlated with the rate of CS. Second, we evaluated differences in CS tolerance among soybean cultivars and breeding lines in field tests. ‘Toyohomare’ and ‘Toiku-238’ were more CS-tolerant than ‘Yukihomare’ and ‘Toyomusume’. Third, we developed a selection method in which plants were subjected to 21-day chilling-temperature treatment from 10 days after flowering in a phytotron. This enabled comparisons of CS tolerance among cultivars. This selection method will be useful for breeding CS-tolerant soybeans.
Introduction
In Hokkaido, northern Japan, soybean [Glycine max (L.) Merr.] crops are damaged by cold weather (Funatsuki and Ohnishi 2009). Severe cold-weather damage occurs almost every four years in northern and eastern Hokkaido (Tanaka 1997). Previous studies conducted in the field of Tokachi Agricultural Experiment Station (TAES) found seed yield reductions of 36% and 78%, respectively, due to cold-weather damage in 1993 and 2003 compared with yields during normal years (Hagihara et al. 2003, Tsunoda et al. 1993). Chilling temperatures result in decreased seed yield, which can be attributed to three main factors: poor growth during the early growth stage, abscission of flowers and pods at the flowering stage, and insufficient grain filling at the pod-filling stage (Yamamoto and Narikawa 1966). The abscission of flowers and pods is the most important factor in terms of reduced yield (Matsukawa 1994). Previous studies showed that there are differences in chilling tolerance among cultivars at the flowering stage (Kurosaki and Yumoto 2003, Kurosaki et al. 2003, 2004). Ohnishi et al. (2010) reported that chilling temperature stress at an early stage of flower development affected pod set. Chilling temperatures can also negatively affect seed appearance; for example, by causing seed coat discoloration and concomitant seed coat cracking (Funatsuki and Ohnishi 2009, Morrison et al. 1998, Srinivasan and Arihara 1994, Takahashi and Abe 1994, 1999). A selection method for breeding soybeans tolerant to seed coat discoloration has been developed (Yumoto and Sasaki 1991), and the mechanism underlying seed coat discoloration has been clarified (Kasai et al. 2009, Ohnishi et al. 2011, Senda et al. 2013).
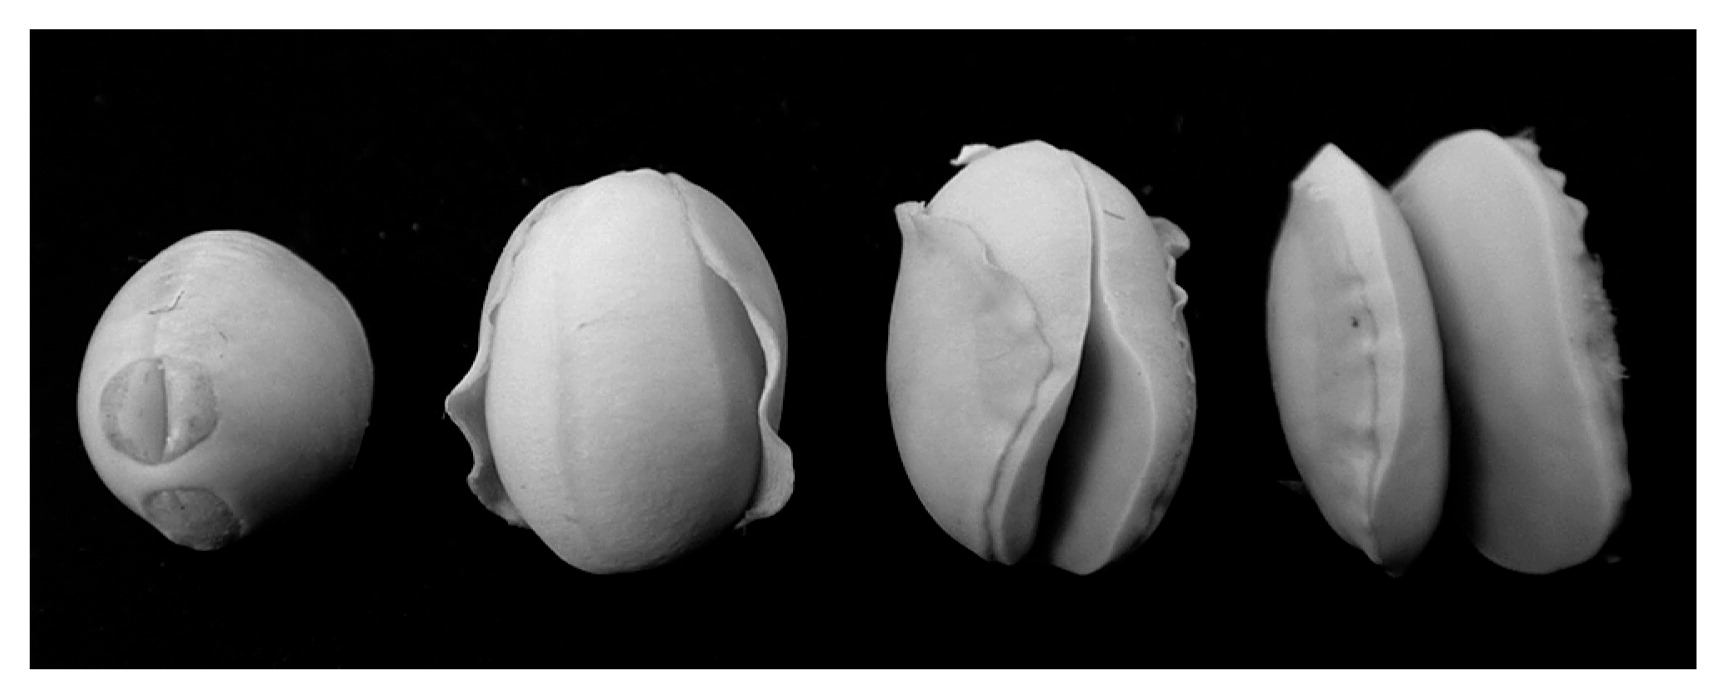
In the years of cold weather, ‘cracking seeds’ (CS) also appear in soybean crops, especially those grown in eastern and northern Hokkaido. Previous studies found that seed coat cracking along with seed coat discoloration occurs around the hilum region (Takahashi and Abe 1994, 1999). Conversely, seed coats of CS are severely split on the dorsal side, and the cotyledons are exposed and frequently separated (Fig. 1). The occurrence of CS affects production detrimentally because these seeds have no commodity value. Yukihomare (YH), a leading variety in Hokkaido, is early maturing and tolerant to chilling temperature with respect to seed yield (Tanaka et al. 2003). It has therefore been planted in the eastern and northern parts of the island. However, soybean production has become apparently unstable because of CS in those areas. More recently, CS has also appeared during years of high temperature (Yamaguchi et al. 2010). Nevertheless, little is known about the CS phenomenon.
The aim of this study was to identify the cold-sensitive stage associated with the occurrence of CS, and to develop a simple method to test the CS tolerance of soybean cultivars.
Materials and Methods
Plant materials
For the field tests, we used seven soybean cultivars and three breeding lines, YH, Toyomusume (TM), Toyohomare (TH), Toyokomachi (TK), Yukipirika (YP), Kitamusume (KM), Hayahikari (HH), Toiku-238 (T238), Toiku-239 (T239) and Toiku-240 (T240). These cultivars and breeding lines are determinate and reach maturity at similar times. For the development of a selection method, we used YH, TM, T238, and TH. All of the cultivars and breeding lines were developed at TAES (Sasaki et al. 1988, 1990, Tanaka et al. 2003, Yumoto et al. 1995, 2000).
Field test procedures
All the field tests were performed in Hokkaido, northern Japan. The field test sites were in Tokachi, Okhotsk (eastern Hokkaido), and Kamikawa (northern Hokkaido), where soybean crops have been severely damaged by cold weather in recent years. Memuro (a field at TAES) and Kamishihoro (in the Tokachi area) are located at a northern latitude of 42°. Kun-neppu (a field at Kitami Agricultural Experiment Station), Abashiri and Tsubetsu (in the Okhotsk area), and Pippu (a field at Kamikawa Agricultural Experiment Station, in the Kamikawa area) are located at a northern latitude of 43°. We conducted 27 field tests between 2001 to 2012. Each cultivar was planted between May and June at a density of 16.7 plants m−2. A randomized complete block design with two replicates was used for these experiments. The flowering time was scored as the number of days from sowing until the time at which more than 50% of plants in the plot were flowering. All cultivars reached maturity from September to October. After harvesting, we determined the weight of CS. Although various types of CS seeds were examined in this study, we did not differentiate between them because none had a commodity value (Fig. 1). For each plot, the CS weight ratio was calculated as follows: CS weight ratio (%) = (weight of CS / weight of total seeds) × 100. Data were arcsine transformed before statistical analyses. Two-way analysis of variance (ANOVA) was used to test the significance of differences in CS ratios. Cultivar × field interactions were considered when testing the significance of differences in CS ratios among the cultivars (Tukey–Kramer multiple comparison test). The average temperatures shown in figures are those reported by the Japan Meteorological Agency (http://www.jma.go.jp/jma/).
Selection method using a phytotron
To optimize the chilling treatment period using a phytotron, the experiments were conducted at TAES in 2009. Seeds (10 per pot) were planted in plastic pots (25 L) on 18 May 2009. Pots were filled with low-humic Andosol supplemented with a chemical fertilizer (N, 0.12 g; P2O5, 1.00 g; K2O, 0.52 g per pot). Two pots were prepared for each cultivar. Two weeks after seedling emergence, two plants were selected. The plants were grown in an experimental facility under a plastic roof without walls. The flowering date was scored for the plants in each pot. At 0, 7, 10, 14, 21, and 28 days after the flowering date, the pots were transferred to the phytotron and grown for 14 or 21 days under the following chilling-temperature conditions: 18°C days (08:00–18:00), 13°C nights (18:00–08:00), with 55% shading to avoid excessive heating from sunlight. After this treatment, the pots were returned to the experimental facility and the plants were grown to maturity. After harvesting, we determined the number of CS and calculated the CS ratio for each pot as follows: CS number ratio (%) = (number of CS / total number of seeds) × 100. Data were arcsine transformed before statistical analysis. One-way ANOVA was used to determine treatment effects on CS ratios. The Tukey–Kramer multiple comparison test was used for testing the significance of differences in CS ratios among chilling treatments.
For evaluation of CS tolerance levels, the experiments were conducted at TAES from 2010 to 2012. The experimental methods were almost the same as above. Seeds were planted in plastic pots on 17 May 2010, 23 May 2011, and 16 May 2012. Three pots were prepared for each cultivar. Ten days after flowering, the pots were transferred to the phytotron and grown for 21 days under chilling-temperature conditions as above. Two-way ANOVA was used to test the significance of differences in CS ratios. Cultivar × year interactions were considered when testing the significance of differences in CS ratios among cultivars (Tukey–Kramer multiple comparison test).
Results and Discussion
Relationship between chilling temperatures and seed cracking
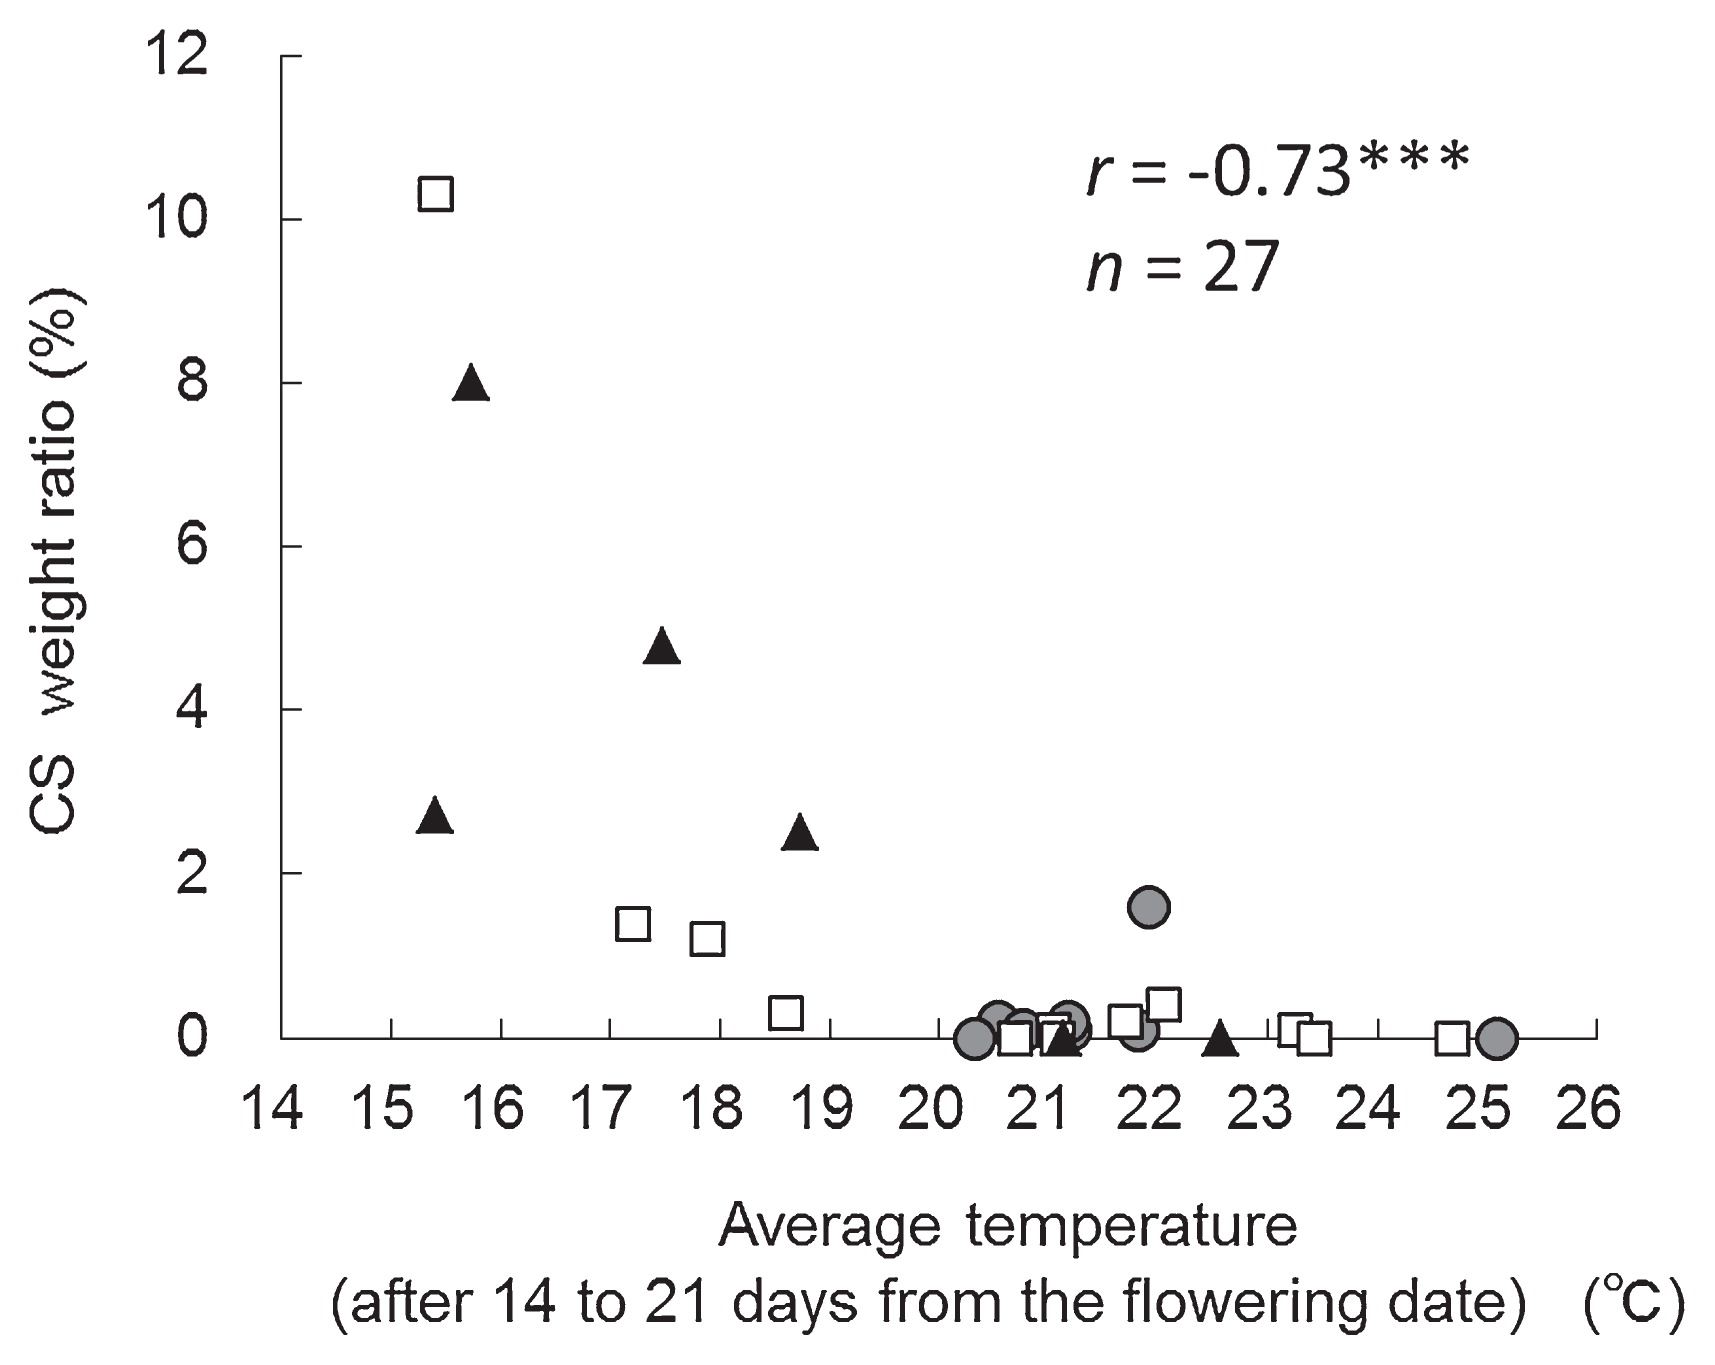
Seed coats of CS were severely split on the dorsal side, and the cotyledons were exposed and frequently separated (Fig. 1). We examined the relationship between chilling temperatures before and after flowering and the occurrence of CS in YH in field tests conducted at TAES from 2001 to 2012. CS weight ratios >1.0% was defined as ‘CS occurrence’; we observed CS occurrence in 2001, 2002, and 2012. There was ‘non-occurrence’ of CS (CS weight ratio <1.0%) in 2003–2011. In the years of CS occurrence, the mean average temperatures after the flowering date were lower than those in the years of ‘non-occurrence’ (Fig. 2). We evaluated the correlation between average temperatures after flowering and the CS weight ratio in the field tests in the three areas (Tokachi, Okhotsk (eastern Hokkaido) and Kamikawa (northern Hokkaido)). The CS weight ratio and flowering date of YH were examined in 2001 to 2012 (n = 27). The mean average temperature from 14 to 21 days after the flowering date was negatively correlated with the CS weight ratio (r = −0.73***, Fig. 3 and Table 1). There was no significant correlation between the mean average temperature from 0 to 7 days and the CS weight ratio (Table 1). The mean average temperature from 7 to 14 days and 21 to 28 days was negatively correlated with the CS weight ratio, but the correlation coefficient was low (Table 1). These results indicated that the cold-sensitive stage associated with the occurrence of CS in YH was about 14 to 21 days after the flowering date.
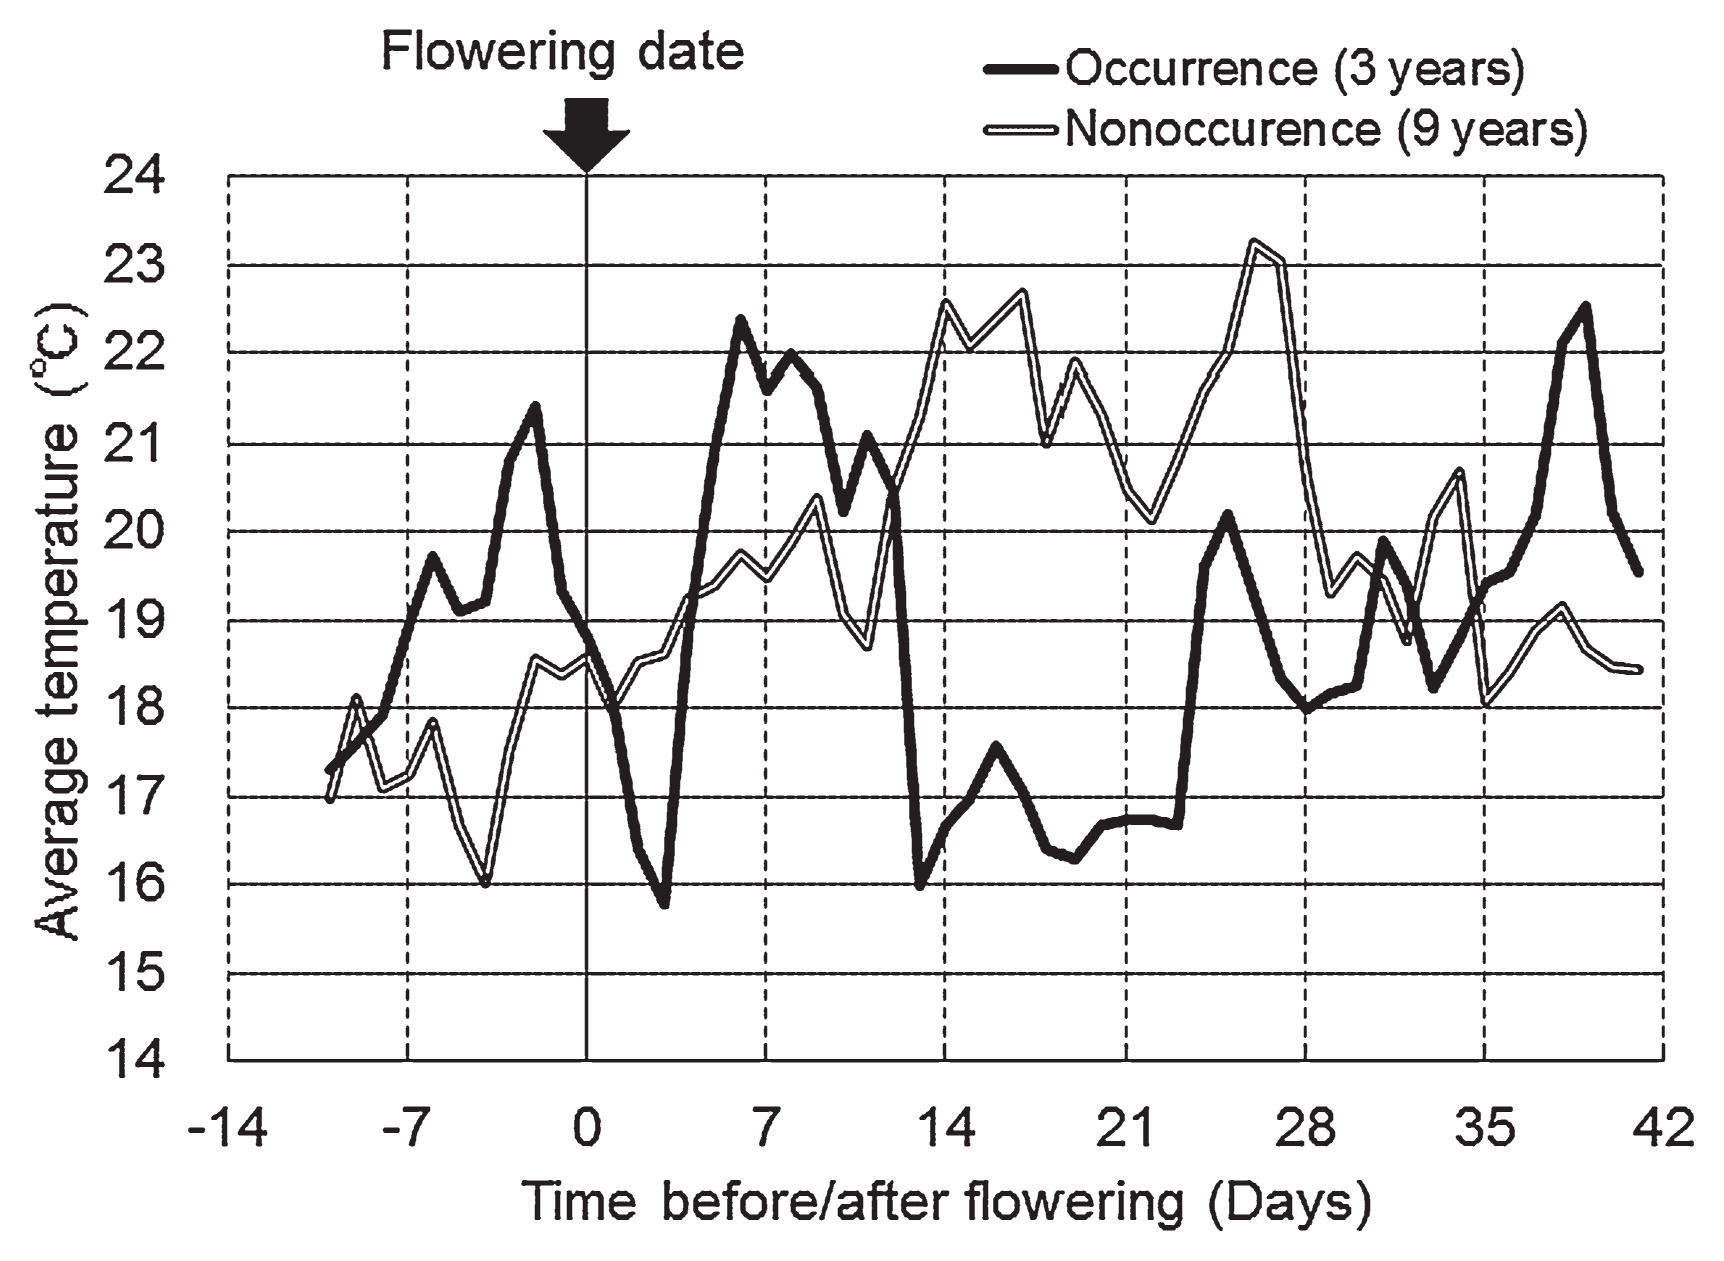
Table 1
Correlation between average temperature after flowering and CS weight ratio of Yukihomare in field tests in three areas from 2001 to 2012
| Period (days)a |
Correlation coefficient (r) |
| 0–7 |
−0.29 nsb |
| 7–14 |
−0.48* |
| 14–21 |
−0.73*** |
| 21–28 |
−0.44* |
a The flowering date was defined as 0.
b ns: not significant (
p > 0.05).
* Significant at
p = 0.05.
*** Significant at
p = 0.001.
There was a higher rate of CS occurrence in Tokachi and Okhotsk areas than in the Kamikawa area, probably because the average temperature was higher in the Kamikawa area than in Tokachi and Okhotsk areas (Fig. 3). These results also indicated that the occurrence of CS is related to chilling temperatures after flowering.
Differences in CS weight ratios among cultivars in field tests
First, we estimated the CS tolerance levels of the seven cultivars and three breeding lines in the TAES field in 2001 (Table 2). CS tolerance was rated as ‘Weak’ if the CS weight ratio was greater than 1.0%, and ‘Strong’ otherwise. CS tolerance of YH, TM, T239, and YP was estimated as ‘Weak’ (Table 2). In contrast, CS tolerance of T238, TH, KM, HH, TK, and T240 was rated as ‘Strong’ (Table 2). YH, TM, T238, and TH were selected as the materials for the subsequent field tests, because their agronomic traits were similar (data not shown).
Table 2
Differences in CS weight ratio among soybean cultivars in the TAES field in 2001
| Cultivar or line |
CS weight ratio (%) |
Estimated tolerance levela |
Selection for field tests |
| YH |
10.3 |
Weak |
Selected |
| TM |
2.4 |
Weak |
Selected |
| T239 |
2.1 |
Weak |
|
| YP |
2.3 |
Weak |
|
| T238 |
0.0 |
Strong |
Selected |
| TH |
0.0 |
Strong |
Selected |
| KM |
0.1 |
Strong |
|
| HH |
0.0 |
Strong |
|
| TK |
0.0 |
Strong |
|
| T240 |
0.0 |
Strong |
|
a Tolerance level was rated as ‘Weak’ if the CS weight ratio was greater than 1.0%, and ‘Strong’ other wise.
Second, we tested the CS tolerance of three cultivars and a breeding line in field tests in Tokachi, Okhotsk, and Kamikawa areas. The results of the field tests in Memuro corresponded to those at TAES (Table 3). Among the field tests, there were ten in which the CS weight ratio of YH exceeded 1.0% between 2001 and 2012 (Table 3). We excluded one set of results (from Memuro in 2012) because neither TH nor T238, both CS-tolerant, were assayed. We therefore used the results of nine tests in the statistical analysis (Table 3). The field tests revealed highly significant differences among cultivars in the CS weight ratio (p < 0.001, Table 4). The CS weight ratios of TH and T238 were significantly lower than those of YH and TM (Table 3). Therefore, the CS tolerance of TH and T238 was higher than that of YH and TM.
Table 3
Differences in CS tolerance among soybean cultivars in field tests
| Cultivar or line |
CS weight ratio (%) |
Tolerance Level |
| Fielda |
Mean |
| 01-Me |
02-Me |
03-Ka |
08-Ka |
03-Pi |
02-Ts |
02-Ab |
02-Ku |
08-Ku |
| YH |
10.3 |
1.4 |
2.3 |
11.8 |
1.6 |
4.8 |
8.0 |
3.2 |
2.5 |
5.1 ab |
Weak |
| TM |
2.4 |
0.0 |
2.6 |
1.9 |
3.9 |
2.4 |
– |
2.7 |
– |
2.3 a |
Weak |
| T238 |
0.0 |
0.0 |
0.3 |
– |
0.1 |
0.3 |
– |
0.1 |
– |
0.2 b |
Strong |
| TH |
0.0 |
0.0 |
0.1 |
1.3 |
0.0 |
– |
0.1 |
0.2 |
0.2 |
0.2 b |
Strong |
a Among the field tests from 2001 to 2012, there were ten in which the CS weight ratio of YH was greater than 1.0%. We excluded one set of results (from Memuro in 2012) because neither TH nor T238, both CS-tolerant, were assayed. Fields are denoted by year and location. Years are abbreviated as follows: 01, 2001; 02, 2002; 03, 2003; and 08, 2008. Locations are abbreviated as follows: Me, Memuro; Ka, Kamishihoro; Pi, Pippu; Ts, Tsubetsu; Ab, Abashiri; and Ku, Kun-neppu. Me and Ka are located at Tokachi; Pi at Kamikawa, and Ts, Ab, and Ku at Okhotsk.
b Means followed by the same superscript letters are not significantly different at the 5% level (Tukey–Kramer multiple comparison test).
Table 4
ANOVA for the effects of cultivar on CS weight ratio in field tests
| Factor |
df |
Sum of Squares |
Mean Square |
F |
p-value |
| Cultivar |
3 |
564.45 |
188.15 |
18.93 |
<0.001 |
| Field |
8 |
146.94 |
18.37 |
1.85 |
0.13 |
| Error |
18 |
178.95 |
9.94 |
|
|
| Total |
29 |
945.90 |
|
|
|
To develop a simple selection method for breeding program application, we optimized the chilling treatment period using a phytotron. YH was grown in pots and subjected to 14- or 21-day chilling-temperature treatments beginning 0, 7, 10, 14, 21, and 28 days after flowering. The ratio of the number of CS to the number of normal seeds was used as an index of the CS tolerance level, because no significant difference was detected in the weight between CS and normal seeds (data not shown), and counting the number of CS was easier than weighing them. This approach allowed us to evaluate the CS tolerance of many breeding lines.
The tests revealed highly significant differences among treatments in the CS number ratio (p < 0.001). In the 14-day treatment, the CS number ratio varied from 0 to 18% (Table 5). The highest CS number ratio was obtained in chilling-temperature treatment beginning 14 days after flowering (Table 5). The 14-day treatment did not appear to be sufficient for evaluation of CS tolerance levels. In the 21- day treatment, the CS number ratio ranged from 20 to 40% (Table 5), with the highest value measured in chilling-temperature treatment beginning 10 days after flowering (Table 5). This period corresponded to the period of chilling temperature in the CS occurrence years (Table 1 and Fig. 2). These results indicated that 21-day treatment from 10 days after flowering was optimum for evaluating CS tolerance levels.
Table 5
Differences in CS occurrence in Yukihomare among chilling periods determined in the controlled phytotron experiment
| Treatment Period (days) |
Start–end (days from flowering date)a |
CS number ratio (%) |
| 0 |
No treatment |
0.0 db |
| 14 |
0–14 |
4.1 cd |
|
7–21 |
13.1 bc |
|
14–28 |
18.4 abc |
|
21–35 |
4.2 cd |
|
28–42 |
0.0 d |
| 21 |
7–28 |
22.7 ab |
|
10–31 |
40.8 a |
|
14–35 |
30.5 ab |
a The flowering date was defined as 0.
b Means followed by the same superscript letters are not significantly different at the 5% level (Tukey–Kramer multiple comparison test).
We evaluated the CS tolerance levels of the three soybean cultivars and a breeding line in a phytotron. YH, TM, T238, and TH were grown in pots and subjected to 21-day chilling-temperature treatment from 10 days after flowering. ANOVA revealed significant differences in the CS number ratio among cultivars (p < 0.001, Table 7). The CS number ratios of TH and T238 were significantly lower than those of YH and TM (Table 6). The results of the phytotron trial were similar to those obtained in field tests (Tables 3, 6). Therefore, this method produced reliable results that enabled us to compare CS tolerance among different soybean cultivars.
Table 6
Differences in CS tolerance and seed yield among soybean cultivars as determined in the controlled phytotron experiment
| Cultivar or line |
CS tolerance |
Seed yield (g plant−1) |
| CS number ratio (%) |
Level |
Year |
Mean |
| Year |
Mean |
| 2010 |
2011 |
2012 |
2011 |
2012 |
| YH |
21.9 ba |
45.9 a |
29.3 a |
32.4 a |
Weak |
17.2 a |
17.2 ab |
17.2 ab |
| TM |
66.1 a |
23.4 ab |
53.3 a |
47.6 a |
Weak |
16.9 a |
13.4 b |
15.2 b |
| T238 |
2.2 c |
5.4 bc |
6.0 b |
4.5 b |
Strong |
16.6 a |
20.5 ab |
18.6 ab |
| TH |
1.4 c |
0.6 c |
4.2 b |
2.1 b |
Strong |
17.2 a |
22.9 a |
20.1 a |
a Means followed by the same superscript letters are not significantly different at the 5% level (Tukey–Kramer multiple comparison test).
Table 7
ANOVA for effects of cultivar and year on CS number ratio
| Factor |
df |
Sum of Squares |
Mean Square |
F |
p-value |
| Cultivar |
3 |
8222.01 |
2740.67 |
30.67 |
<0.001 |
| Year |
2 |
130.73 |
65.36 |
0.73 |
0.49 |
| Error |
30 |
2680.37 |
89.35 |
|
|
| Total |
35 |
11033.11 |
|
|
|
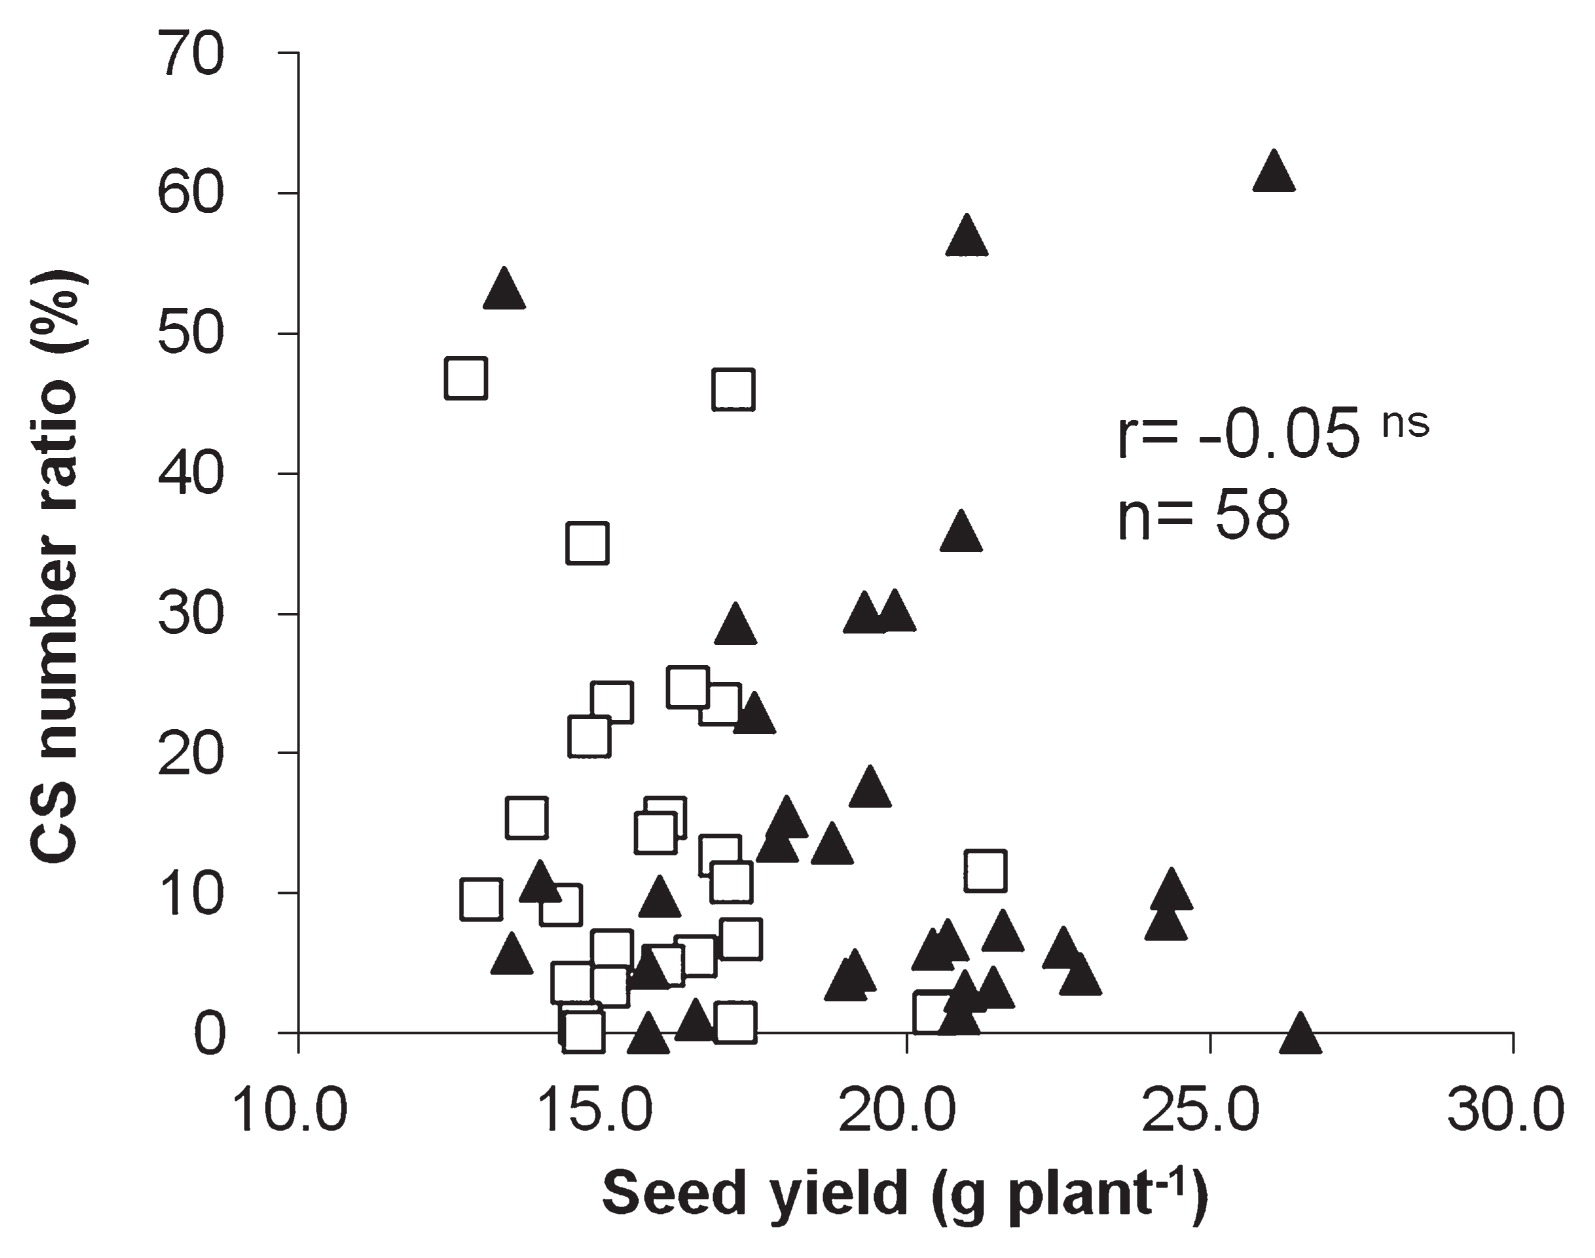
We compared seed yields of the soybean plants evaluated using our selection method. There were no significant differences among the cultivars in 2011 (Table 6). In 2012, the seed yield of TH was significantly higher than that of TM (Table 6). These results indicated that seed yields of CS-tolerant cultivars were not lower than those of CS-sensitive cultivars. An examination based on 100-seed weights gave similar results (data not shown). We also examined the relationship of seed yield and 100-seed weight to CS-tolerance levels of the 10 cultivars and 48 breeding lines evaluated by the selection method in 2011 and 2012 (n = 58). No significant correlation was found either between seed yield and the CS number ratio (r = −0.05, Fig. 4) or between 100-seed weight and the CS number ratio (r = −0.10). We can therefore select CS-tolerant lines by the selection method without considering seed yield and 100-seed weight.
The reproductive stages of soybean are defined as R1 to R8 (Fehr et al. 1971), as follows: R1 (beginning bloom), R2 (full bloom), R3 (beginning pod), R4 (full pod), R5 (beginning seed), R6 (full seed), R7 (beginning maturity), and R8 (full maturity). Kurosaki and Yumoto (2003) and Funatsuki et al. (2004) developed methods to evaluate chilling tolerance at the reproductive stage. In those methods, the plants were exposed to chilling temperatures from the R1 stage. The chilling-temperature treatment in our selection method was applied after the R1 stage. Therefore, it should be possible to evaluate CS tolerance independently of pollen development or flower abscission tolerance to chilling.
The mechanism of seed cracking is still unclear. Clarifying the mechanism of seed cracking may make it possible to develop indirect selection methods to breed CS-tolerant cultivars.
Acknowledgements
We thank the regional technology groups of Kamikawa Agricultural Experimental Station and Kitami Agricultural Experiment Station for the field tests. This study was supported by a grant from the Ministry of Agriculture, Forestry, and Fisheries of Japan (Genomics-based Technology for Agricultural Improvement, SFC1006).
Literature Cited
- Fehr, W.R., C.E. Caviness, D.T. Burmood and J.S. Pennington (1971) Stage of development descriptions for soybeans, Glycine max (L.) Merr. Crop Sci. 11: 929–931.
- Funatsuki, H., S. Matsuba, K. Kawaguchi, T. Murakami and Y. Sato (2004) Methods for evaluation of soybean chilling tolerance at the reproductive stage under artificial climatic conditions. Plant Breed. 123: 558–563.
- Funatsuki, H. and S. Ohnishi (2009) Recent advances in physiological and genetic studies on chilling tolerance in soybean. JARQ 43: 95–101.
- Hagihara, S., S. Ohnishi, S. Shirai, H. Yamazaki and C. Suzuki (2003) Damages of soybean growth under the cool weather in Tokachi area in 2003. Rep. Hokkaido Branch, Crop Sci. Soc. Jpn and Hokkaido Branch, Jpn. Soc. Breeding 44: 39–40.
- Kasai, A., S. Ohnishi, H. Yamazaki, H. Funatsuki, T. Kurauchi, T. Matsumoto, S. Yumoto and M. Senda (2009) Molecular mechanism of seed coat discoloration induced by low temperature in yellow soybean. Plant Cell Physiol. 50: 1090–1098.
- Kurosaki, H. and S. Yumoto (2003) Effects of low temperature and shading during flowering on the yield components in soybeans. Plant Prod. Sci. 6: 17–23.
- Kurosaki, H., S. Yumoto and I. Matsukawa (2003) Pod setting pattern during and after low temperature and the mechanism of cold-weather tolerance at the flowering stage of soybeans. Plant Prod. Sci. 6: 247–254.
- Kurosaki, H., S. Yumoto and I. Matsukawa (2004) Correlation of cold-weather tolerance with pubescence color and flowering time in yellow hilum soybeans in Hokkaido. Breed. Sci. 54: 303–311.
- Matsukawa, I. (1994) Report of cool weather damage in 1993 in Hokkaido. Miscellaneous Publication of Hokkaido Prefect. Agric. Exp. Stn. 23: 36–41.
- Morrison, M.J., L.N. Pietrzak and H.D. Voldeng (1998) Soybean seed coat discoloration in cool-season climates. Agronomy J. 90: 471– 474.
- Ohnishi, S., T. Miyoshi and S. Shirai (2010) Low temperature stress at different flower developmental stages affects pollen development, pollination, and pod set in soybean. Environ. Exp. Bot. 69: 56–62.
- Ohnishi, S., H. Funatsuki, A. Kasai, T. Kurauchi, N. Yamaguchi, T. Takeuchi, H. Yamazaki, H. Kurosaki, S. Shirai, T. Miyoshi et al. (2011) Variation of GmIRCHS (Glycine max inverted-repeat CHS pseudogene) is related to tolerance of low temperature-induced seed coat discoloration in yellow soybean. Theor. Appl. Genet. 122: 633–642.
- Sasaki, K., K. Sunada, T. Tsuchiya, S. Sakai, M. Kamiya, T. Ito and T. Sanbuichi (1988) A new soybean variety ‘Toyomusume’. Bull. Hokkaido Pref. Agric. Exp. Stn. 57: 1–12.
- Sasaki, K., K. Sunada, M. Kamiya, T. Ito, S. Sakai, T. Tsuchiya, K. Shirai, S. Yumoto and T. Sanbuichi (1990) A new soybean variety ‘Toyokomachi’. Bull. Hokkaido Pref. Agric. Exp. Stn. 60: 45–58.
- Senda, M., S. Nishimura, A. Kasai, S. Yumoto, Y. Takada, Y. Tanaka, S. Ohnishi and T. Kuroda (2013) Comparative analysis of the inverted repeat of a chalcone synthase pseudogene between yellow soybean and seed coat pigmented mutants. Breed. Sci. 63: 384– 392.
- Srinivasan, A. and J. Arihara (1994) Soybean seed discoloration and cracking in response to low temperatures during early reproductive growth. Crop Sci. 34: 1611–1617.
- Tanaka, Y. (1997) Report of field crops production under abnormal climate. Misc. Publ. of Hokkaido Pref. Agric. Exp. Stn. 29: 34–41.
- Tanaka, Y., K. Tomita, S. Yumoto, H. Kurosaki, H. Yamazaki, C. Suzuki, I. Matsukawa, T. Tsuchiya, K. Shirai and M. Tsunoda (2003) A new soybean variety ‘Yukihomare’. Bull. Hokkaido Pref. Agric. Exp. Stn. 84: 13–24.
- Takahashi, R. and J. Abe (1994) Genetic and linkage analysis of low temperature-induced browning in soybean seed coats. J. Heredity 85: 447–450.
- Takahashi, R. and J. Abe (1999) Soybean maturity genes associated with seed coat pigmentation and cracking in response to low temperatures. Crop Sci. 39: 1657–1662.
- Tsunoda, M., H. Kurosaki, S. Yumoto, Y. Tanaka and I. Matsukawa (1993) Serious damages of soybean growth under the unusual cool weather in 1993.: I. Understanding of the cool weather damage by the successive growth and meteorological data. Rep. Hokkaido Branch, Crop Sci. Soc. Jpn. and Hokkaido Branch, Jpn. Soc. Breeding 34: 36–37.
- Yamaguchi, N., C. Suzuki, S. Hagihara, T. Miyoshi and Y. Tanaka (2010) Effect of high temperature on soybean seed yield in Tokachi area in 2010. Rep. Hokkaido Branch, Crop Sci. Soc. Jpn. and Hokkaido Branch, Jpn. Soc. Breeding 51: 85–86.
- Yamamoto, T. and T. Narikawa (1966) Survey report on cool weather injury in Hokkaido. Part III. Upland crops. Agriculture, Forestry and Fishes Research Council, Ministry of Agriculture and Forestry, pp. 161–180.
- Yumoto, S. and K. Sasaki (1991) Seed coat staining caused by treatment of cool temperature in soybeans with yellow hilum. Rep. Hokkaido Branch, Crop Sci. Soc. Jpn. and Hokkaido Branch, Jpn. Soc. Breeding 30: 39.
- Yumoto, S., I. Matsukawa, Y. Tanaka, H. Kurosaki, M. Tsunoda, T. Tsuchiya, K. Shirai, K. Tomita, K. Sasaki, M. Kamiya et al. (1995) A new soybean variety ‘Toyohomare’. Bull. Hokkaido Pref. Agric. Exp. Stn. 68: 33–49.
- Yumoto, S., Y. Tanaka, H. Kurosaki, H. Yamazaki, C. Suzuki, I. Matsukawa, T. Tsuchiya, K. Shirai, K. Tomita, K. Sasaki et al. (2000) A new soybean variety ‘Hayahikari’. Bull. Hokkaido Pref. Agric. Exp. Stn. 78: 19–37.