Abstract
In this study, 520 cultivated and 14 wild accessions of black gram (Vigna mungo (L.) Hepper) were assessed for diversity using 22 SSR markers. Totally, 199 alleles were detected with a mean of 9.05 alleles per locus. Wild black gram showed higher gene diversity than cultivated black gram. Gene diversity of cultivated accessions among regions was comparable, while allelic richness of South Asia was higher than that of other regions. 78.67% of the wild gene diversity presented in cultivated accessions, indicating that the domestication bottleneck effect in black gram is relatively low. Genetic distance analysis revealed that cultivated black gram was more closely related to wild black gram from South Asia than that from Southeast Asia. STRUCTURE, principal coordinate and neighbor-joining analyses consistently revealed that 534 black gram accessions were grouped into three major subpopulations. The analyses also revealed that cultivated black gram from South Asia was genetically distinct from that from West Asia. Comparison by SSR analysis with other closely related Vigna species, including mungbean, azuki bean, and rice bean, revealed that level of gene diversity of black gram is comparable to that of mungbean and rice bean but lower than that of azuki bean.
Introduction
The genus Vigna is a large leguminous taxon comprising 104 described species distributed in tropical and subtropical regions of Africa, Asia, America, and Australia (Lewis et al. 2005). It is an important and interesting taxon because up to nine species in this taxon are domesticated as food crops in Asia, Africa, and America. These species include V. subterranea (L.) Verdc. (Bambara groundnut), V. unguiculata (L.) Walp. (cowpea), V. vexillata (L.) (zombi pea), V. radiata (L.) Wilczek (mungbean), V. angularis (Ohwi) Ohwi & Ohashi (azuki bean), V. mungo (L.) Hepper (black gram), V. aconitifolia Jacq. (moth bean), V. umbellata (Thunb.) Ohwi & Ohashi (rice bean), and V. reflexo-pilosa Hayata (créole bean) (Tomooka et al. 2006). Seeds, pods, and tubers of these species are sources of dietary proteins, amino acids, carbohydrates, vitamins, and minerals for humans. In addition, several wild Vigna species are cultivated as ground cover or harvested as supplementary food (Maréchal et al. 1978, Tomooka et al. 2006). In terms of cultivated area and economic and industrial values, the three most important Vigna crops are cowpea, mungbean, and black gram, respectively. Cowpea is mainly cultivated in Africa, while mungbean and black gram are principally grown in Asia.
Cultivated black gram (also known as urd, urad, or mash; Vigna mungo var. mungo (L.) Hepper) is believed to have been domesticated in India from its wild progenitor, Vigna mungo var. silvestris Lukoki, Maréchal, and Otoul (Chandel et al. 1984). Based on archeological evidence found in India (Fuller and Harvey 2006), domestication of black gram may have occurred about 4,500 years ago. Early finds of black gram were from Gujarat and the Northern Peninsula in India, where wild black gram populations persist (Fuller and Harvey 2006).
Black gram seeds contain about 25% protein and 65% carbohydrates. The seeds are mainly consumed as soup. Black gram flour and powder are used as major ingredients for several kinds of foods, such as cakes, biscuits, snacks, cookies, and doughnuts. Sprouts produced from black gram are also consumed as a vegetable source of vitamins and minerals. In Thailand and Japan, sprouts from black gram are more preferable than those from mungbean because of their longer shelf life. Black gram is mainly grown in South and Southeast Asian countries, including Afghanistan, Bangladesh, India, Pakistan, Nepal, Myanmar, the Philippines, Sri Lanka, and Thailand. Due to its relative drought tolerance, short life cycle (75–90 days), and ability to fix atmospheric nitrogen in association with soil Rhizobium and Bradyrhizobium bacteria, the crop is grown as a component in various cropping systems, but chiefly following rice and wheat. Although there is no official record of growing area of black gram, the area is expected to be higher than 5 Mha. India is the largest producer (about 3 Mha), followed by Myanmar (about 1 Mha) and Pakistan (0.5 Mha). Black gram production in Myanmar and Thailand are mainly for exporting seeds to India and Japan.
Seed yield of black gram is low, being about 450–800 kg/ha. There are not many breeding programs for black gram, and most of them are in India, Pakistan, and Thailand. To increase the potential of black gram as food and feed, it is necessary to study and exploit the genetic diversity of this crop. Compared to cowpea and mungbean, there has been less research on black gram, especially in terms of molecular genetic diversity. Genetic variability of black gram has been studied based on morphological and agronomic traits (Ghafoor et al. 2001, Gupta et al. 2001), seed storage protein (Ghafoor and Ahmad 2005), isozyme markers (Singh et al. 2009), DNA markers including random amplified polymorphic DNA (RAPD), inter simple sequence repeat (ISSR), amplified fragment length polymorphism (AFLP), and simple sequence repeat (SSR) (Gupta and Gopalakrishna 2009, Sivaprakash et al. 2004, Souframanien and Gopalakrishna 2004). However, these studies have provided little information on the extent of genetic diversity in black gram because each study, except Gupta et al. (2001) and Ghafoor et al. (2001), employed less than 150 accessions, and the germplasm used in each study originated from only a single geographical region (country). Moreover, the dominant nature of RAPD, ISSR, and AFLP markers make them unsuitable for diversity analysis, because they complicate the calculation of population genetics parameters based on allele frequency (Lynch and Milligan 1994).
SSR (also known as microsatellite) is the marker of choice for molecular genetics study in crops because of its advantages of being co-dominant, multi-allelic, reliable, PCR-based, and easy to score, and requiring a small amount of DNA for analysis. SSR markers from one species can also be used in other related species. Although no SSR marker has been developed from black gram, thousands of them have been developed in other Vigna crops, including azuki bean (Wang et al. 2004), cowpea (Gupta and Gopalakrishna 2010, Kongjaimun et al. 2012), and mungbean (Seehalak et al. 2009, Somta et al. 2008, 2009, Tangphatsornruang et al. 2009). SSR markers from azuki bean, cowpea, and mungbean have shown a high rate of amplification in black gram and thus are useful for genomics study in this crop (Chaitieng et al. 2006, Gupta and Gopalakrishna 2010, Somta et al. 2009, Tangphatsornruang et al. 2009).
In this study, a set of 534 black gram accessions from various origins were assessed by SSR markers from azuki bean and cowpea, with the aims of determining the level of genetic diversity and population structure. The results will be useful for black gram breeders/geneticists to better understand diversity and domestication of the crop.
Materials and Methods
Plant materials and DNA extraction
Five hundred and thirty-four accessions of black gram, including 520 cultivated and 14 wild accessions from various geographical origins covering major growing areas, were used in this study (Table 1 and Supplemental Table 1).
Table 1
Sources and number of cultivated black gram accessions used in this study with number of alleles (
NA), gene diversity (
HE), observed heterozygosity (
HO), allelic richness (
AR), and estimated outcrossing rate (
t)
| Form (status) |
Origin |
No. of accessions |
NA |
HE |
HO |
AR |
t (%) |
| Cultivated |
All |
520 |
178 |
0.59 |
0.06 |
105.77 |
4.38 |
|
South Asia (C_SA) |
245 |
156 |
0.57 |
0.06 |
62.08 |
4.60 |
|
Bangladesh (BGD) |
2 |
35 |
0.55 |
0.07 |
32.00 |
2.30 |
|
India (IND) |
240 |
154 |
0.57 |
0.06 |
44.10 |
4.66 |
|
Sri Lanka (SLK) |
3 |
43 |
0.60 |
0.06 |
36.46 |
2.62 |
|
West Asia (C_WA) |
143 |
136 |
0.52 |
0.07 |
57.00 |
6.21 |
|
Afghanistan (AFG) |
8 |
39 |
0.26 |
0.03 |
27.84 |
2.35 |
|
Pakistan (PAK) |
134 |
127 |
0.51 |
0.07 |
40.72 |
6.61 |
|
Iran (IRN) |
1 |
23 |
ND |
0.05 |
ND |
ND |
|
Himalayan region (Nepal; C_NEP) |
92 |
125 |
0.51 |
0.04 |
56.94 |
4.17 |
|
Southeast Asia (C_SEA) |
25 |
98 |
0.54 |
0.07 |
58.60 |
3.73 |
|
Myanmar (MMR) |
1 |
22 |
ND |
0.00 |
ND |
ND |
|
Philippines (PHL) |
3 |
42 |
0.49 |
0.09 |
34.26 |
4.17 |
|
Singapore (SGP) |
1 |
22 |
ND |
0.00 |
ND |
ND |
|
Thailand (THA) |
20 |
90 |
0.54 |
0.07 |
42.26 |
3.79 |
|
Africa (C_AF) |
7 |
67 |
0.58 |
0.06 |
55.58 |
2.30 |
|
Cote D’Ivoier (CIV) |
2 |
28 |
0.40 |
0.00 |
26.00 |
0.00 |
|
Mauritius (MUS) |
1 |
22 |
ND |
0.00 |
ND |
ND |
|
Senegal (SEN) |
2 |
32 |
0.43 |
0.09 |
28.00 |
6.27 |
|
Zaire (ZAR) |
2 |
34 |
0.18 |
0.09 |
24.00 |
16.69 |
|
America (C_AM) |
6 |
63 |
0.60 |
0.03 |
57.24 |
1.27 |
|
Argentina (GRG) |
1 |
24 |
ND |
0.09 |
ND |
ND |
|
Colombia (COL) |
1 |
22 |
ND |
0.00 |
ND |
ND |
|
Trinidad (TTO) |
2 |
29 |
0.33 |
0.00 |
26.00 |
0.00 |
|
United states of America (USA) |
1 |
22 |
ND |
0.00 |
ND |
ND |
|
Venezuela (VEN) |
1 |
22 |
ND |
0.00 |
ND |
ND |
|
Unknown (C_NA) |
2 |
34 |
0.52 |
0.05 |
31.00 |
2.20 |
| Wild |
All |
14 |
115 |
0.75 |
0.08 |
112.81 |
4.44 |
|
South Asia (India; W_SA) |
9 |
96 |
0.77 |
0.10 |
72.98 |
5.71 |
|
Southeast Asia (Thailand; W_SEA) |
5 |
46 |
0.41 |
0.05 |
42.19 |
4.00 |
| Overall |
|
534 |
199 |
0.60 |
0.06 |
198.10 |
4.33 |
Note; ND = not determined.
Seeds of each accession were sown in an experimental field of Kasetsart University, Kamphaeng Saen Campus, Nakhon Pathom, Thailand. Young leaves from two or three plants of each accession were collected and extracted for DNA following the method described by Lodhi et al. (1994), with the exception that absolute ethanol was used instead of 95% ethanol for DNA precipitation. The DNA concentration was determined by comparison with a known concentration of λ DNA and adjusted to 1 ng/μl for SSR marker analysis.
SSR marker analysis
Ninety-four SSR markers from azuki bean [18 genomic SSRs reported by Wang et al. (2004) and 37 EST-SSRs reported by Chankaew et al. (2014)] and from cowpea [1 genomic SSR reported by Li et al. (2001) and 38 EST-SSRs reported by Kongjaimun et al. (2012)] were used to screen for PCR amplification and for potential detection of polymorphism in five black gram accessions (Supplemental Table 2). PCR amplification was performed as follows: the PCR mixture was prepared in a total volume of 10 μl containing 4 ng of genomic DNA, 5 ρmo1 of each forward and reverse primer, 1× Taq buffer, 200 mM dNTPs, 2 mM MgCl2, and 1 U Taq DNA polymerase (Thermo Scientific, Wilmington, USA). The PCR cycling profile for the genomic SSR markers was the same as that described by Somta et al. (2008), while that for the EST-SSR markers was the same as that noted by Kongjaimun et al. (2012). The SSR markers were amplified using GeneAmp® PCR System 9700 thermocycler (Applied Biosystems, Foster City, USA) or PTC-200 thermocycler (MJ Research, Waltham, USA). The PCR products were separated on 5% denatured polyacrylamide gel (w/v; 19 : 1 acrylamide-bisacrylamide) with 7M urea and 1×TBE buffer. Electrophoresis was run at 80 W constant power for 2 to 3 h (depending on allele size) using Model S2 Sequencing Gel Electrophoresis Apparatus (Biometra, Goettingen, Germany). φX174 DNA/HinfI marker (Thermo Scientific, Wilmington, USA) was used as a size standard. The PCR products were visualized by silver staining. Twenty-two polymorphic SSR markers with clear bands were then used to analyze all the DNA samples.
Data analysis
Number of alleles, observed heterozygosity (HO), gene diversity (expected heterozygosity; HE), Wright’s fixation index (FIS), and allelic richness (AR) were calculated with software FSTAT 2.9.3.2 (Goudet 2002). FIS was then employed to calculate outcrossing rate (t) using an equation proposed by Weir (1996): t = (1 − FIS)/(1 + FIS). Polymorphism information content (PIC) of each marker was calculated following Anderson et al. (1993).
Genetic admixture among black gram accessions was determined with software STRUCTURE 2.3.4 (Pritchard et al. 2000). Initially, 20 simulation runs of STRUCTURE were performed based on an independent allele frequency model using K (number of clusters) varying from 1 to 10 with a burn-in period of 10,000 and 50,000 replicates of Markov Chain Monte Carlo (MCMC); the optimum K was then determined based on the ad-hoc ΔK method of Evanno et al. (2005). Finally, a run with the optimum K, 100,000 burn-in period, and 500,000 MCMC replications were performed to assign individual black gram accessions to clusters.
Nei’s genetic distance (DA) (Nei et al. 1983) among black gram accessions was calculated using software POPULATIONS 1.2.31 (Langella 2002) and was then used in a principal coordinate analysis (PCoA) and neighbor-joining analysis using R-program 2.10.0 (R Development Core Team 2012) and MEGA6 (Tamura et al. 2013), respectively, to depict relationships among the accessions. The neighbor-joining tree was obtained with 1,000 bootstraps.
Results
SSR polymorphism
Of the 94 SSR markers screened in the five accessions of black gram, 87 markers (92.55%) were able to successfully amplify their DNAs, and 37 of the amplifiable markers (42.53%) showed polymorphism (Supplemental Table 2). Twenty-two polymorphic markers (12 azuki bean genomic SSRs, 4 azuki bean EST-SSRs, and 6 cowpea EST-SSRs) showing unambiguous DNA bands were selected and used for further analysis of the 534 black gram accessions (Supplemental Table 3). The 22 SSR markers detected 199 alleles in total, with the number of alleles per locus ranging from 3 (cp01038 and VES0019) to 23 (CEDG305 and cp05325) and an average of 9.05 alleles per marker (Tables 1, 2).
Table 2
Number of detected alleles, polymorphism information content (
PIC), and allelic richness of 22 SSR markers in cultivated and wild black gram
| Primer (allele size range) |
No. of alleles |
PIC |
Allelic richness |
| Oa |
Cb |
Wc |
Oa |
Cb |
Wc |
Oa |
Cb |
Wc |
| CEDG013 (82–100) |
8 |
7 |
5 |
0.66 |
0.66 |
0.66 |
8.00 |
4.56 |
4.95 |
| CEDG015 (151–200) |
4 |
2 |
3 |
0.02 |
0.02 |
0.25 |
4.00 |
1.16 |
2.78 |
| CEDG056 (200–250) |
9 |
9 |
6 |
0.75 |
0.75 |
0.81 |
9.00 |
5.70 |
6.00 |
| CEDG088 (110–140) |
7 |
4 |
6 |
0.13 |
0.10 |
0.71 |
6.74 |
1.74 |
5.53 |
| CEDG092 (140–150) |
8 |
5 |
4 |
0.72 |
0.70 |
0.56 |
7.97 |
4.04 |
3.96 |
| CEDG097 (82–118) |
16 |
13 |
8 |
0.73 |
0.73 |
0.78 |
15.83 |
6.97 |
7.45 |
| CEDG103 (80–110) |
8 |
6 |
5 |
0.66 |
0.64 |
0.72 |
7.89 |
3.42 |
4.96 |
| CEDG111 (150–200) |
4 |
3 |
4 |
0.19 |
0.17 |
0.72 |
4.00 |
1.95 |
4.00 |
| CEDG173 (110–142) |
16 |
14 |
6 |
0.79 |
0.78 |
0.76 |
15.98 |
6.71 |
5.95 |
| CEDG279 (153–205) |
7 |
7 |
5 |
0.77 |
0.77 |
0.69 |
7.00 |
5.30 |
5.00 |
| CEDG305 (106–118) |
23 |
22 |
7 |
0.92 |
0.92 |
0.81 |
22.95 |
11.46 |
6.91 |
| CEDG006 (100–132) |
4 |
3 |
3 |
0.08 |
0.07 |
0.59 |
4.00 |
1.55 |
3.00 |
| cp01038 (267–350) |
3 |
3 |
3 |
0.49 |
0.48 |
0.57 |
3.00 |
2.77 |
2.98 |
| cp01354 (213–267) |
8 |
8 |
7 |
0.80 |
0.80 |
0.80 |
8.00 |
5.46 |
6.88 |
| cp05325 (200–500) |
23 |
23 |
10 |
0.92 |
0.92 |
0.87 |
23.00 |
11.45 |
9.97 |
| cp07770 (350–434) |
8 |
8 |
4 |
0.79 |
0.79 |
0.72 |
8.00 |
5.74 |
4.00 |
| cp10549 (234–300) |
12 |
12 |
7 |
0.85 |
0.85 |
0.84 |
11.87 |
7.40 |
6.92 |
| cp11079 (210–250) |
7 |
6 |
5 |
0.59 |
0.58 |
0.77 |
6.98 |
3.35 |
4.98 |
| VES0019 (213–234) |
3 |
3 |
3 |
0.45 |
0.43 |
0.66 |
3.00 |
2.48 |
3.00 |
| VES0287 (192–234) |
10 |
10 |
4 |
0.69 |
0.67 |
0.64 |
10.00 |
5.55 |
3.79 |
| VES0670 (102–126) |
5 |
4 |
5 |
0.54 |
0.52 |
0.73 |
4.97 |
2.47 |
4.92 |
| VES1246 (124–184) |
6 |
6 |
5 |
0.69 |
0.69 |
0.67 |
6.00 |
4.55 |
4.88 |
| Average |
9.05 |
8.10 |
5.23 |
0.60 |
0.59 |
0.70 |
9.01 |
4.81 |
5.13 |
| Total |
199 |
178 |
155 |
|
|
|
|
|
|
The PIC values varied from 0.02 (CEDG015) to 0.92 (CEDG305 and cp05325), with an average of 0.60 (Table 2). In general, markers showed higher PIC in wild accessions than in cultivated accessions. SSR markers showed comparable AR between wild and cultivated accessions (Table 2).
HO in cultivated black gram germplasm from different regions or between cultivated and wild germplasm were comparable (Table 1). Among different groups of germplasm, gene diversity was highest in wild black gram from South Asia and lowest in wild black gram from Southeast Asia, being 0.77 and 0.41, respectively (Table 1). Among the cultivated black gram, gene diversity of America was the greatest but comparable with that of other regions (Table 1). Among germplasm from major growing areas (South Asia, West Asia, the Himalayan region, and Southeast Asia), that from South Asia possessed the highest gene diversity, followed by Southeast Asia, West Asia, and the Himalayan region. AR values in these four regions were almost the same (Table 1). However, wild black gram possessed greater AR than cultivated black gram. Wild black grams from South Asia had higher AR than those from Southeast Asia (Table 1).
Genetic admixture
Population admixture among black gram accessions was determined by STRUCTURE analysis which uses Bayesian algorithm. Based on the ad-hoc ΔK measurement method (Evanno et al. 2005), the 534 black gram accessions were an admixture of three subpopulations (Supplemental Figs. 1 and 2). Subpopulation I, II, and III comprised 159, 188, and 187 accessions, respectively. The majority in subpopulation I were cultivated accessions from South Asia (52%) and all cultivated accessions except one from Southeast Asia (15%), some accessions from West Asia (9%) and Himalayan region (8%). All the wild accessions were included in this subpopulation. Most of the accessions in subpopulation II were from South Asia (82%), with some accessions from the Himalayan region (13%) and West Asia (4%). The majority of accessions in subpopulation III were from West Asia (65%) and the Himalayan region (28%), together with some accessions from South Asia (4%).
Principal coordinate analysis
PCoA revealed that the first three PCs together accounted for 37.37% of the total variation. The first, second, and third PCs accounted for 14.89%, 13.03%, and 9.45%, respectively. Although the scatter plot of black gram germplasm based on PC1 and PC2 showed that there were no clear distinct groups of germplasm, it demonstrated that accessions in the same subpopulation as identified by STRUCTURE analysis were mainly scattered together on the PCoA plot (Fig. 1A).
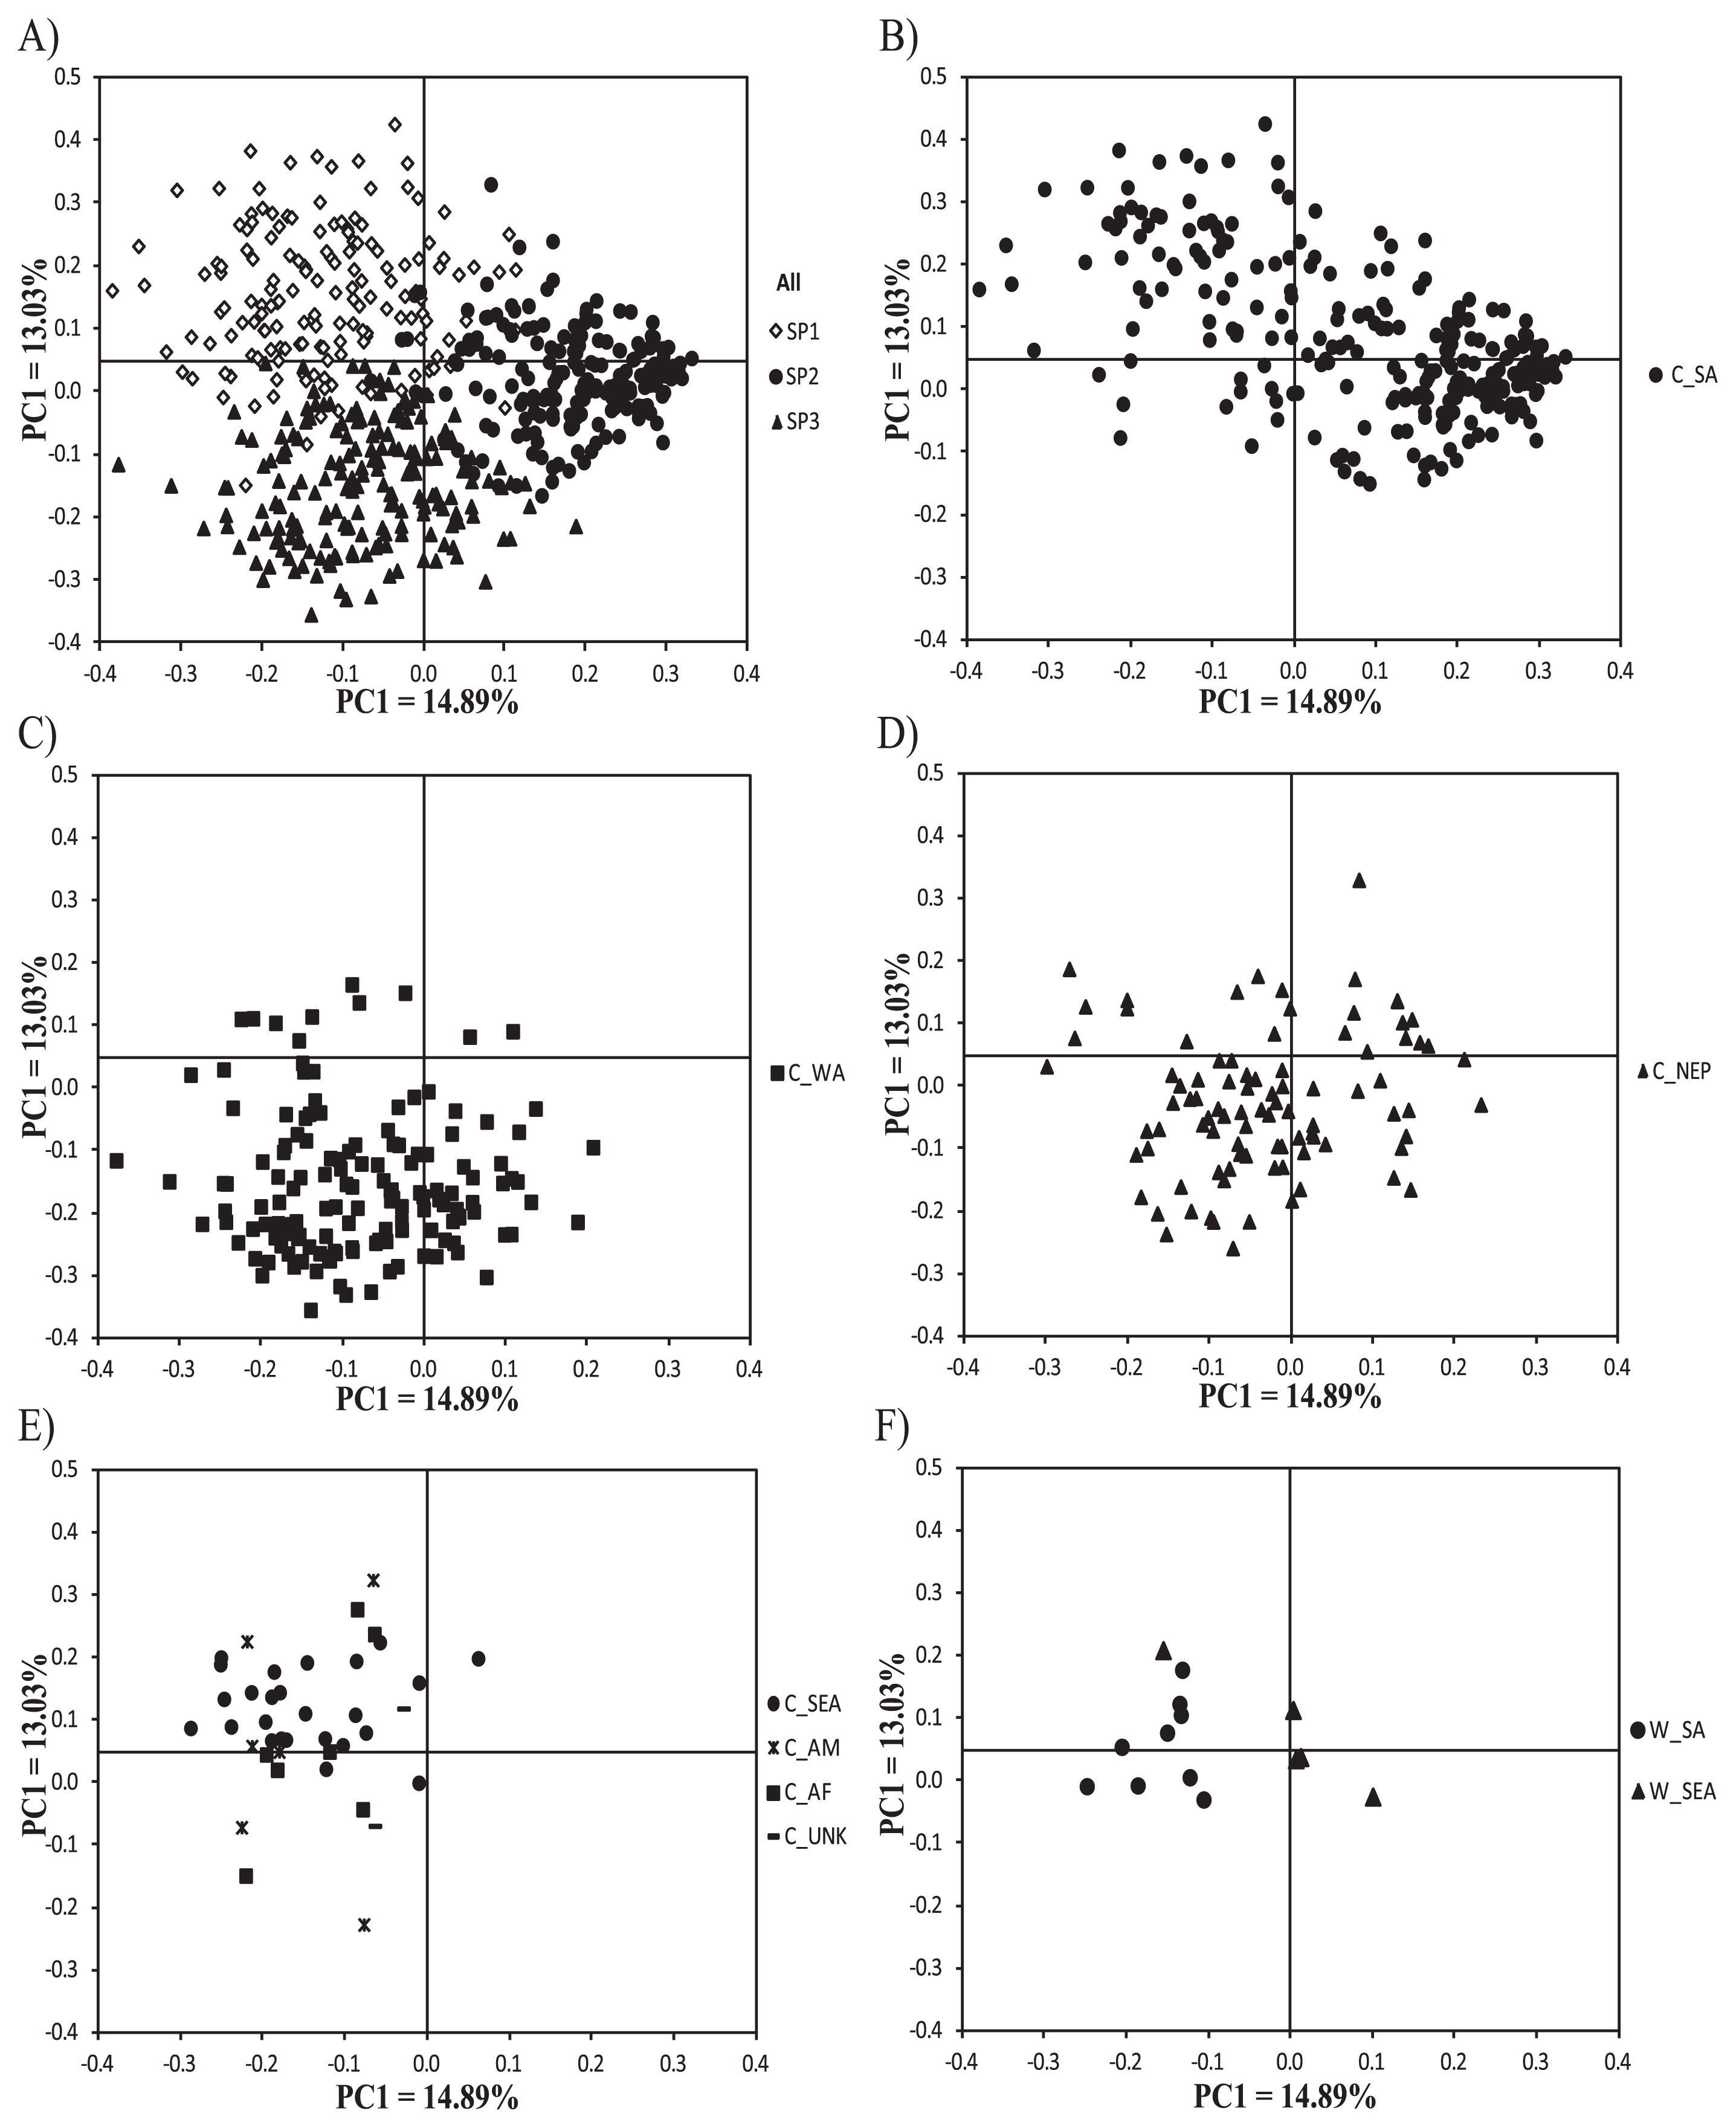
Black grams from South Asia showed the broadest distribution (Fig. 1B). They were mainly scattered at the central right and the upper left of the plot. Accessions in the latter group showed much wider distribution than those in the former. Black grams from West Asia showed wide distribution (Fig. 1C). Most of them could be differentiated from black grams from South Asia, while some showed overlapping distribution (Fig. 1A). The majority of accessions from West Asia were at the lower middle-left of the PC plot. Black grams from the Himalayan region also showed wide distribution (Fig. 1D). Most of them scattered around the center of the plot. About a half of the accessions were associated with accessions from South Asia, while the other half were associated with accessions from West Asia. Black grams from Southeast Asia, America, and Africa, as well as those of unknown origin, showed relatively narrow distribution (Fig. 1E), scattering mainly around the left half of the plot. However, most accessions were differentiated from one region to another. Black grams from the American collection showed wide variation, scattering on the upper and lower left of the plot (Fig. 1E). Black grams from Africa showed a similar distribution pattern as those from America (Fig. 1E).
Wild black grams from South Asia showed narrow distribution around the middle left half of the plot (Fig. 1F). All except one of the wild black grams from Southeast Asia were at the center of the plot and well differentiated from wild black grams from South Asia. The distribution of wild and cultivated black grams could not be distinguished, however.
Neighbor-joining analysis
A phylogenic tree was constructed by neighbor-joining analysis based on DA among individual black gram accessions. The tree demonstrated that three major clusters exist, in general; accessions in each of the three subpopulations as identified by STRUCUTURE analysis were clustered together (Fig. 2). Cluster I is the most diverse cluster and represents subpopulation I. It comprises all wild accessions and many cultivated accessions from South Asia, all cultivated accessions from Southeast Asia and Africa, all except one accession from America, and some accessions from West Asia and the Himalayan region. In this cluster, thirteen accessions (four each from South Asia and West Asia, two from the Himalayan region, and one from Southeast Asia) formed a mini subcluster with all the wild accessions, except two from South Asia. Cluster II principally consisted of accessions from South Asia together with several accessions from the Himalayan region and a few accessions from West Asia. This cluster represents subpopulation III. Accessions from the Himalayan region formed a subcluster in cluster II. Cluster III was mainly composed of accessions from West Asia and the Himalayan region, and represents subpopulation II. Eight accessions from India and one each from Southeast Asia and America were also included in this cluster. Most accessions from the Himalayan region formed a subcluster.

Nei’s DA among black grams of different types and/or from different regions is shown in Table 3. The DA values among cultivated black grams from South Asia, West Asia, and the Himalayan region were low (<0.14). Yet, they showed low distance from cultivated black grams from Southeast Asia. This suggests geographical proximity and a close genetic relationship among them. The DA values between black grams from Southeast Asia and America or Africa were lower than those between black grams from South Asia or West Asia or the Himalayan region and America or Africa (Table 3).
Table 3
Nei’s genetic distance (
Nei et al. 1983) among different groups of black gram germplasm
| Codea |
C_SA |
C_WA |
C_NEP |
C_SEA |
C_AM |
C_AF |
C_UNK |
W_SA |
| C_WA |
0.1331 |
|
|
|
|
|
|
|
| C_NEP |
0.1181 |
0.1121 |
|
|
|
|
|
|
| C_SEA |
0.1850 |
0.1904 |
0.1902 |
|
|
|
|
|
| C_AM |
0.2482 |
0.2200 |
0.2537 |
0.1988 |
|
|
|
|
| C_AF |
0.2455 |
0.2363 |
0.2134 |
0.2104 |
0.2571 |
|
|
|
| C_UNK |
0.3565 |
0.3528 |
0.2968 |
0.3271 |
0.3902 |
0.3684 |
|
|
| W_SA |
0.4186 |
0.4135 |
0.4108 |
0.4144 |
0.4482 |
0.4637 |
0.5957 |
|
| W_SEA |
0.4548 |
0.4877 |
0.4776 |
0.5024 |
0.5096 |
0.5569 |
0.5718 |
0.5505 |
a See description for the code in
Table 1.
In all cases, DA between wild and cultivated black grams was moderate (0.41 to 0.56). In general, DA between cultivated black grams and South Asian wild black grams was lower than DA between cultivated black grams and Southeast Asian wild black grams. DA between South Asian and Southeast Asian wild black grams was 0.55, indicating moderate genetic differentiation between wild germplasm from the two regions.
Outcrossing rate in black grams varied among different regions and/or types, with an overall rate of 4.33% (Tables 1, 4). Wild black grams showed similar outcrossing rates with cultivated black grams. The minimum outcrossing rate was 1.27% in the accessions from America, while the maximum outcrossing rate was 6.21% in the West Asian cultivated black grams. Based on the country of origin, outcrossing rates were between 0% in Côte d’Ivoire and Trinidad and 16.69% in Zaire.
Table 4
Comparison of gene diversity between black grams and other Asian
Vigna species
| Vigna species |
Status and origin |
No. of accessions |
SSR loci used |
NAa (mean per locus) |
HEb |
Tc |
| Black gram (V. mungo) |
All |
534 |
22 |
199 (9.04) |
0.60 |
4.33 |
| Cultivated |
420 |
|
178 (8.09) |
0.59 (87.67%)d |
|
| South Asia (excluding Pakistan) |
245 |
|
156 (7.09) |
0.57 |
|
| West Asia (excluding Pakistan) |
143 |
|
136 (6.18) |
0.52 |
|
| Himalayan region (Nepal) |
92 |
|
125 (5.68) |
0.51 |
|
| Wild |
14 |
|
115 (5.23) |
0.75 |
|
| Azuki beane (V. angularis) |
All |
616 |
13 |
311 (23.92) |
0.76 |
3.48 |
| Cultivated |
548 |
|
240 (18.46) |
0.74 (86.05%)d |
|
| East Asia |
489 |
|
227 (17.46) |
0.72 |
|
| Southeast Asia |
25 |
|
61 (4.69) |
0.54 |
|
| Himalayan region (Nepal + Bhutan) |
34 |
|
72 (5.54) |
0.51 |
|
| Wild |
68 |
|
245 (21.15) |
0.86 |
|
| Mungbeanf (V. radiata) |
All |
615 |
19 |
309 (16.26) |
0.62 |
1.06 |
| Cultivated |
415 |
|
138 (7.26) |
0.41 (65.08%)d |
|
| South Asia (including Nepal but excluding Pakistan) |
101 |
|
105 (5.53) |
0.44 |
|
| West Asia (including Pakistan) |
112 |
|
92 (4.84) |
0.45 |
|
| Southeast Asia |
131 |
|
97 (5.11) |
0.32 |
|
| Wild |
189 |
|
257 (13.53) |
0.63 |
|
| Rice beang (V. umbellata) |
All |
472 |
13 |
168 (12.92) |
0.61 |
17.0 |
| Cultivated |
388 |
|
132 (10.15) |
0.57 (66.28%)d |
|
| South Asia (excluding Pakistan) |
151 |
|
106 (8.15) |
0.55 |
|
| Southeast Asia (including Nepal) |
175 |
|
90 (6.92) |
0.53 |
|
| Wild |
84 |
|
245 (18.85) |
0.86 |
|
c Percentage of out-crossing rate.
d Percentage of gene diversity as compared with its wild species.
Discussion
The present study is the first large-scale molecular diversity analysis of black gram, covering accessions from all major growing regions in the world, and including both wild and cultivated types. The use of SSR markers enables comparison of allelic diversity in black gram gene pools with the other crop gene pools in the same genus. In this study the average number of alleles per SSR locus was 9.0. This figure is much lower than that reported for azuki bean (23.9 alleles; 13 SSRs in 548 cultivated and 67 wild accessions) (Xu et al. 2008) and mungbean (16.3 alleles; 19 SSRs in 415 cultivated and 189 wild accessions) (Sangiri et al. 2007). When only cultivated germplasm was considered, the average number of alleles per SSR locus in black gram (8.1 alleles; Table 2) was similar to that in mungbean (7.3 alleles; Table 4), Bambara groundnut (Vigna subterranea) (7.6 alleles; 22 SSRs in 240 accessions; Somta et al. 2011), and rice bean (10.2 alleles; Table 4), but still much lower than that in azuki bean (18.5 alleles; Table 4). The lower number of alleles found in black gram appears to be due partly to the much smaller number of wild accessions used in this study.
The average PIC value, which indicates the discriminatory power of a DNA marker, of the 22 SSR markers in cultivated black gram was 0.59. This value was similar to that in cultivated azuki bean (0.70; Xu et al. 2008), rice bean (0.52; Tian et al. 2013), and cultivated Bambara groundnut (0.58; Somta et al. 2011), but higher than that in mungbean (0.38; Sangiri et al. 2007). Markers CEDG305, cp05325, and cp10549 showed higher PIC values (>0.80; Table 2) than other markers, and thus they are highly informative for cultivar identification of black gram germplasm.
Outcrossing rate of the black gram found in this study (4.33%) is higher than that reported in mungbean (1.06%; Sangiri et al. 2007) and is comparable to azuki bean (3.48%; Xu et al. 2008), but very much lower than that of rice bean (17.00%; Tian et al. 2013) (Table 4). Although black gram and mungbean share similar morphological traits and have similar life cycles and ecological habitats (Tomooka et al. 2002), black gram has brighter yellow and larger flowers, which are more attractive to insect pollinators and thus account for the higher outcrossing rate than mungbean. The estimated outcrossing rate in mungbean by Sangiri et al. (2007) included many wild accessions from Australia, which generally have smaller flowers than those of mungbean from other regions (Lawn and Rebetzke 2006). The difference in outcrossing rate between black gram and rice bean is possibly due to the difference in their flower morphology and life cycle. Black gram has smaller flowers and paler yellow corolla than rice bean (Tomooka et al. 2002). Black gram is considered an annual species (Tomooka et al. 2002), while rice bean is a perennial species (Tomooka et al. 1997). However, it should be noted that the outcrossing rate estimated of black gram in this study was possibly overestimated since bulked DNA samples of each accession were used for the SSR marker analysis (see Materials and Methods). The use of bulked DNA samples may also have caused overestimation for HO in this study, although the HO for black gram in this study (0.06) is similar to that reported in mungbean (0.01; Sangiri et al. 2007) and azuki bean (0.05; Xu et al. 2008) and is lower than that reported in rice bean (0.15; Tian et al. 2013).
In Asian Vigna, which black gram belongs to, the genetic relationship between cultivated and wild forms of mungbean, azuki bean, and rice bean have been studied. Clear genetic differentiation between the wild and cultivated gene pools was shown in mungbean (Sangiri et al. 2007), but not in azuki bean (Xu et al. 2008) and rice bean (Tian et al. 2013). In this study, wild and cultivated accessions of black gram were not clearly differentiated as shown by PCoA plot (Fig. 1) and phylogenetic tree (Fig. 2). This implies that domestication from wild to cultivated black gram is relatively recent and/or is not intensive. However, archaeological evidence suggests that domestication of black gram may be as long as 3,500–4,500 years ago (Fuller and Harvey 2006). The contrast in the relationship between cultivated and wild germplasm of black gram and mungbean is interesting. Both species originated in India, sharing several common morphological characteristics, and are cultivated and utilized in similar ways (Tomooka et al. 2002). Compared to wild mungbean, wild black gram has much narrower distribution. The former is present in Africa, Asia, and Australia, while the latter is only found in limited areas of Asia, mainly in India, Myanmar, and Thailand (Tomooka et al. 2002). Cultivation of black gram also principally occurs in these countries, while mungbean is more widely cultivated. Narrow geographical distribution and recent or non-intensive domestication of black gram appear to account for the unclear distinction between wild and cultivated forms of this crop.
Gene diversity and AR from SSR allelic data (Table 1) shows that wild black gram possesses higher genetic diversity than cultivated black gram. Although the data revealed that cultivated black grams from all different regions possess a comparable level of gene diversity with low genetic differentiation among each other (Tables 1, 3), the data showed the greatest gene diversity in wild black gram from South Asia. This high diversity is supported by the highest AR found in the wild black gram from South Asia (Table 1). The data also revealed that, among the cultivated black grams, AR was the highest in accessions from South Asia. This supports the original view of Vavilov (1926) that India is the center of diversity of black gram.
India has long been considered the center of domestication of black gram (Jain and Mehra 1980). Allelic data obtained from SSR markers revealed that cultivated black gram from every region is genetically more similar to Indian wild black gram (W_SA) than to Thai wild black gram (W_SEA) (Table 3), although the number and origin of accessions of the wild black gram used in this study were limited. This suggests that cultivated black gram is more likely to be genetically derived from Indian rather than Thai wild black gram and that domestication of black gram was possibly started in India. Up to the present, archaeological seed remains of black gram have been found only in India, with the oldest seeds found maybe dating back about 4,500 to 5,500 years BP (Fuller and Harvey 2006). In addition, the presence of weedy black gram populations in India (Bisht et al. 2005) also supports the long history of domestication of black gram in the country. In this study, black grams from India were separated into two major groups. One group comprises wild and cultivated accessions from various parts of India, the other group comprises only cultivated accessions which mostly come from northern India, especially from the Himalayan foothills, including Uttarakhand, Uttar Pradesh, and Bihar (Fig. 2 and see also Supplemental Table 1). All of the wild accessions with known locality were from Maharashtra (Central Plateau region). Gene diversity of the black grams in the first group was higher than that in the second groups (0.63 vs. 0.46; data not shown). Since wild black gram in India is widespread in the northern parts of Western Ghats, and sporadically occurs in some parts of Rajasthan, Madhya Pradesh, and Maharashtra (Bisht et al. 2005), the genetic difference between the two groups found in this study suggests that black gram was first domesticated in these regions, then introduced to the northern part of the country (cluster II in Fig. 2) and selected to adapt to the environment.
Black gram and mungbean are closely related species and complement each other as a secondary gene pool. In India, wild black gram and wild mungbean populations generally have the same geographical distribution, although some show distinct distribution (Bisht et al. 2005). Based on archaeological findings, wild mungbean was probably domesticated in the Himalayan foothills in the Punjab region, and in the far south of India, while wild black gram was perhaps domesticated in Gujarat and the Northern Peninsula (Fuller and Harvey 2006). Based on protein banding variation in a large set of mungbean germplasm, Tomooka et al. (1992) hypothesized that mungbean was domesticated in South Asia, and from there diverse cultivars were introduced to West Asia and Southeast Asia. This hypothesis was supported by SSR allelic data in a large and diverse set of mungbean germplasm that show the same level of diversity between South Asian and West Asian mungbeans, and a high level of diversity in Southeast Asian mungbeans (Sangiri et al. 2007). A similar pattern was found in black gram in this study, where cultivated black grams from South Asia, West Asia, and Southeast Asia showed the same level of gene diversity and low genetic distance among each other (Tables 1, 3). Since black gram and mungbean are both domesticated in South Asia, and are grown and used in similar ways, it is possible that they spread to West Asia and Southeast Asia by similar/same process, route, and time period.
Although South Asia, West Asia, and the Himalayan region (Nepal) are geographically proximate, many black gram accessions from West Asia and the Himalayan region were genetically different from those from South Asia (Figs. 1, 2). This suggests that after black gram cultivars from South Asia were introduced into West Asia and the Himalayan region, they were genetically selected and adapted to environments in these two regions, which may be different from their origins. Two major groups exist for black gram from West Asia (Fig. 2): one was genetically intermediate between subgroups from South Asia and the Himalayan region, while the other was genetically close to a subgroup from the Himalayan region. This suggests that black gram cultivars in West Asia were introduced from both South Asia and the Himalayan region.
There are two major genetic clusters of black gram from the Himalayan region (Nepal) (Fig. 2), one closely associated with a major cluster of black grams from South Asia, especially those from the states near the Himalayan foothills (cluster II; see Supplemental Table 1 for details on the locality), while the other is associated with black grams from West Asia (cluster III). This suggests that black gram cultivars from the Himalayan region were derived from two different origins. Interestingly, similar results were reported in azuki bean and rice bean. Based on SSR analyses, Xu et al. (2008) and Tian et al. (2013), respectively, showed that cultivated azuki bean and cultivated rice bean from Nepal were mainly separated into two major groups, western Nepal and eastern Nepal. Although the provenance/locality of many black grams from Nepal is not known, most black grams with known locality (eastern Nepal) were grouped together (cluster III and see also Supplemental Table 1 for details on the locality). However, gene diversity and AR between the Himalayan black grams in cluster II and cluster III are comparable (0.42 vs. 0.48 and 2.69 vs. 3.77, respectively; data not shown).
Although cultivated black grams from Southeast Asia possessed high gene diversity (Table 1), they mainly showed a close genetic relationship with each other (Figs. 1, 2). The neighbor-joining tree showed that most of the black grams from Southeast Asia were grouped in the same subcluster as some cultivated black grams from South Asia, West Asia, Nepal, Africa, and America, and two wild black grams from South Asia (Fig. 2). Thus, this subcluster appears to be different from the others and shows high genetic diversity. In addition, one accession of black gram from Southeast Asia was grouped within a subcluster together with black gram from Nepal (Fig. 2). These results suggest that there are multiple times and/or sources of introduction of black gram into Southeast Asia. This is not in line with the history of black gram cultivation in this region; for example, cultivation in Thailand may be only recent (about 60–70 years), using the cultivars introduced from India (Srinives 1990). Additional studies with more accessions from Southeast Asia, especially from Myanmar, which lies between South and Southeast Asia and is possibly a part of the domestication center of black gram, are necessary to clarify the genetic relationship of black grams in this region with those in other regions.
Black gram was introduced to Africa and America in recent times by Indian immigrants (Jain and Mehra 1980) to grow as food and manure crop, which is called “woolly pyrol” in America. Interestingly, gene diversities of cultivated black gram in America and Africa are higher than those in other regions. The neighbor-joining tree revealed that positions of black grams from these two regions were similar to those from Southeast Asia (Supplemental Fig. 2; see also above discussion on black gram from Southeast Asia). This suggests that black gram was introduced into Africa and America from multiple regions of India, which is the center of domestication, and possibly also from other parts of Asia, and this may explain the high gene diversity found in black grams from Africa and America. Based on the plant introduction history of America, a black gram accession was introduced into the country in 1906 from Barbados (Piper and Morse 1914); thus, the introduction of black gram from Asia to America occurred more than 100 years ago. Vertovec (1994) noted that about 95,000 people from India migrated to Trinidad from 1874 to 1917; some of them might have introduced black gram, resulting in the highest gene diversity detected in this study.
Acknowledgements
This study was supported by the Graduate School, Kasetsart University, Thailand, and the Thailand Research Fund (TRF). For providing the black gram germplasm used in this study, we would like to thank the United States Department of Agriculture, USA; Genebank, National Institute of Agrobiological Sciences, Japan; Australian Tropical Crops and Forages Collection, Australia; and Chai Nat Field Crops Research Center, Thailand.
Literature Cited
- Anderson, J.A., G.A. Churchill, J.E. Autrique, M.E. Sorells and S.D. Tanksley (1993) Optimizing parental selection for genetic linkage maps. Genome 36: 181–186.
- Bisht, I.S., K.V. Bhat, S. Lakhanpaul, M. Latha, P.K. Jayan, B.K. Biswas and A.K. Singh (2005) Diversity and genetic resources of wild Vigna in India. Genet. Resour. Crop Evol. 52: 53–68.
- Chaitieng, B., A. Kaga, N. Tomooka, T. Isemura, Y. Kuroda and D.A. Vaughan (2006) Development of a black gram [Vigna mungo (L.) Hepper] linkage map and its comparison with an azuki bean [Vigna angularis (Willd.) Ohwi and Ohashi] linkage map. Theor. Appl. Genet. 113: 1261–1269.
- Chandel, K.P.S., R.N. Lester and R.J. Starling (1984) The wild ancestors of urd and mung beans (Vigna mungo (L.) Hepper and V. radiata (L.) Wilczek). Bot. J. Linn. Soc. 89: 85–96.
- Chankaew, S., T. Isemura, S. Isobe, A. Kaga, N. Tomooka, P. Somta, H. Hirakawa, K. Shirasawa, D.A. Vaughan and P. Srinives (2014) Detection of genome donor species of neglected tetraploid crop Vigna reflexo-pilosa (créole bean) and genetic structure of diploid species based on newly developed EST-SSR markers from azuki bean (Vigna angularis). PLoS One 9: e104990.
- Evanno, G., S. Regnaut and J. Goudet (2005) Detecting the number of clusters of individuals using the software STRUCTURE: a simulation study. Mol. Ecol. 14: 2611–2620.
- Fuller, D.Q. and E.L. Harvey (2006) The archaeobotany of Indian pulses: identification processing and evidence for cultivation. Environ. Archaeol. 11: 241–268.
- Ghafoor, A., A. Sharif, Z. Ahmad, M.A. Zahid and M.A. Rabbani (2001) Genetic diversity in blackgram (Vigna mungo L. Hepper). Field Crops Res. 69: 183–190.
- Ghafoor, A. and Z. Ahmad (2005) Diversity of agronomic traits and total seed protein in black gram (Vigna mungo (L.) Hepper). Acta Biol. Cracov. Bot. 47: 69–75.
- Goudet, J. (2002) FSTAT: a program to estimate and test gene diversities and fixation indices. Version 2.9.3.2. Available from http://www.unil.ch/izea/softwares/fstat.html [accessed on 22 May 2011].
- Gupta, S., S.R. Gupta, H.K. Dikshit and R.A. Singh (2001) Variability and its characterization in Indian collections of blackgram [Vigna mungo (L.) Hepper.]. Plant Genet. Resour. Newsl. 127: 20–24.
- Gupta, S.K. and T. Gopalakrishna (2009) Genetic diversity analysis in blackgram (Vigna mungo (L.) Hepper) using AFLP and transferable microsatellite markers from azuki bean (Vigna angularis (Willd.) Ohwi & Ohashi). Genome 52: 120–129.
- Gupta, S.K. and T. Gopalakrishna (2010) Development of unigene-derived SSR markers in cowpea (Vigna unguiculata) and their transferability to other Vigna species. Genome 53: 508–523.
- Jain, H.K. and K.L. Mehra (1980) Evolution adaptation relationships and uses of the species of Vigna cultivated in India. In: Summerfield, R.J. (ed.) Advances in Legume Science, Royal Botanic Garden Kew, Richmond Surrey, pp. 459–468.
- Kongjaimun, A., A. Kaga, N. Tomooka, P. Somta, T. Shimizu, Y. Shu, T. Isemura, D.A. Vaughan and P. Srinives (2012) An SSR-based linkage map of yardlong bean (Vigna unguiculata (L.) Walp. subsp. unguiculata Sesquipedalis Group) and QTL analysis of pod length. Genome 55: 81–92.
- Langella, O. (2002) Populations a free population genetic software. Version 1.2.31. Available from http://bioinformatics.org/~tryphon/populations [Accessed on 12 May 2013].
- Lawn, R.J. and G.J. Rebetzke (2006) Variation among Australian accessions of the wild mungbean (Vigna radiata ssp. sublobata) for traits of agronomics, adaptive, or taxonomic interest. Aust. J. Agric. Res. 57: 119–132.
- Lewis, G., B. Schrire, B. Mackinder and M. Lock (2005) Legumes of the world, Kew Royal Botanic Gardens, Richmond Surrey, p. 577.
- Li, C.D., C.A. Fatokun, B. Ubi, B.B. Singh and G.J. Scoles (2001) Determining genetic similarities and relationships among cowpea breeding lines and cultivars by microsatellite markers. Crop Sci. 41: 189–197.
- Lodhi, M.A., G.N. Ye, N.F. Weeden and B.I. Reisch (1994) A simple and efficient method for DNA extraction from grapevine cultivars and Vitis species. Plant Mol. Biol. Rep. 12: 6–13.
- Lynch, M. and B.G. Milligan (1994) Analysis of population genetic structure using RAPD markers. Mol. Ecol. 3: 91–99.
- Maréchal, R., J.M. Mascherpa and F. Stainier (1978) Etude taxonomique d’un groupe complex d’espèces des geners Phaseolus et Vigna (Papilionaceae) sur la base de données morphologiques et polliniques traitées par l’analyse informatique. Boissiera 28: 1–273.
- Nei, M., F. Tajima and Y. Tateno (1983) Accuracy of estimated phylogenetic trees from molecular data. J. Mol. Evol. 19: 153–170.
- Piper, C.V. and W.J. Morse (1914) Five oriental species of beans. Bull. USDA 119: 1–32.
- Pritchard, J.K., M. Stephens and P. Donnelly (2000) Inference of population structure using multilocus genotype data. Genetics 155: 945–959.
- R Development Core Team (2012) R: A language and environment for statistical computing, R Foundation for Statistical Computing, Vienna, Austria.
- Sangiri, C., A. Kaga, N. Tomooka, D.A. Vaughan and P. Srinives (2007) Genetic diversity of the mungbean (Vigna radiata Leguminosae) genepool on the basis of microsatellite analysis. Aust. J. Bot. 55: 837–847.
- Seehalak, W., P. Somta, W. Sommanas and P. Srinives (2009) Microsatellite markers for mungbean developed from sequence database. Mol. Ecol. Resour. 9: 862–864.
- Singh, A.K., A. Mishra and A. Shukla (2009) Genetic assessment of traits and genetic relationship in blackgram (Vigna mungo) revealed by isoenzymes. Biochem. Genet. 47: 471–485.
- Sivaprakash, K.R., S.R. Prashanth, B.P. Mohanty and A. Parida (2004) Genetic diversity of black gram (Vigna mungo) landraces as evaluated by amplified fragment length polymorphism markers. Curr. Sci. 86: 1411–1416.
- Somta, P., W. Musch, B. Kongsamai, S. Chanprame, S. Nakasathien, T. Toojinda, W. Sorajjapinun, W. Seehaluk, S. Tragoonrung and P. Srinives (2008) New microsatellite markers isolated from mungbean (Vigna radiata (L.) Wilczek). Mol. Ecol. Resour. 8: 1155–1157.
- Somta, P., W. Seehalak and P. Srinives (2009) Development characterization and cross-species amplification of mungbean (Vigna radiata) genic microsatellite markers. Conserv. Genet. 10: 1939–1943.
- Somta, P., S. Chankaew, O. Rungnoi and P. Srinives (2011) Genetic diversity of the Bambara groundnut (Vigna subterranea (L.) Verdc.) as assessed by SSR markers. Genome 54: 898–910.
- Souframanien, J. and T. Gopalakrishna (2004) A comparative analysis of genetic diversity in blackgram genotypes using RAPD and ISSR markers. Theor. Appl. Genet. 109: 1687–1693.
- Srinives, P. (1990) Mungbean breeding and genetic resources in Thailand. In: Thavarasook, C., P. Srinives, N. Boonkerd, H. Imai, A. Pookpakdi, P. Laosuwan and U. Pupipat (eds.) Proceedings of the Mungbean Meeting 90. Japan Tropical Agricultural Research Center, Bangkok, pp. 31–41.
- Tamura, K., G. Stecher, D. Paterson, A. Filipski and S. Kumar (2013) MEGA6: molecular evolutionary genetics analysis version 6.0. Mol. Biol. Evol. 30: 2725–2729.
- Tangphatsornruang, S., P. Somta, P. Uthaipaisanwong, J. Chanprasert, D. Sangsrakru, W. Seehalak, W. Sommanas, S. Tragoonrung and P. Srinives (2009) Characterization of microsatellites and gene contents from genome shotgun sequences of mungbean (Vigna radiata (L.) Wilczek). BMC Plant Biol. 9: 137.
- Tian, J., T. Isemura, A. Kaga, D.A. Vaughan and N. Tomooka (2013) Genetic diversity of the rice bean (Vigna umbellata) genepool as assessed by SSR markers. Genome 56: 717–727.
- Tomooka, N., C. Lairungreang, P. Nakeeraks, Y. Egawa and C. Thavarasook (1992) Center of genetic diversity and dissemination pathways in mung bean deduced from seed protein electrophoresis. Theor. Appl. Genet. 83: 289–293.
- Tomooka, N., S. Chotechuen, N. Boonkerd, B. Taengsan, S. Nuplean, D.A. Vaughan, Y. Egawa, T. Yogoyama and Y. Tateishi (1997) Collection of seed and nodule samples from wild subgenus Ceratotropis species (genus Vigna) in central and northern Thailand. Annual report on exploration and introduction of plant genetic resources 13: 189–206.
- Tomooka, N., D.A. Vaughan, H. Moss and N. Maxted (2002) The Asian Vigna: genus Vigna subgenus Ceratotropis genetic resources, Kluwer Academic Publishers, The Netherlands, p. 270.
- Tomooka, N., A. Kaga and D.A. Vaughan (2006) The Asian Vigna (Vigna subgenus Ceratotropis) biodiversity and evolution. In: Sharma, A.K. and S. Sharma (eds.) Plant Genome; Biodiversity and Evolution. Volume 1 part C. Phanerograms (Angiosperms Dicotyledons), Science Publishers, New Jersey, pp. 87–126.
- Vavilov, N.I. (1926) Centers of origin of cultivated plants. Bull. Appl. Bot. 26:1–248.
- Vertovec, S. (1994) “Official” and “Popular” Hinduism in the Caribbean: historical and contemporary trends in Surinam, Trinidad and Guyana. Contrib. Indian Soc. 28: 123–147.
- Wang, X.W., A. Kaga, N. Tomooka and D.A. Vaughan (2004) The development of SSR markers by a new method in plants and their application to gene flow studies in azuki bean [Vigna angularis (Willd.) Ohwi & Ohashi]. Theor. Appl. Genet. 109: 352–360.
- Weir, B.S. (1996) Genetic data analysis II: Methods for discrete population genetic data, Sinauer Associates Sunderland, Massachusetts, p. 445.
- Xu, H.X., J. Tian, N. Tomooka, A. Kaga, T. Isemura and D.A. Vaughan (2008) Genetic diversity of the azuki bean (Vigna angularis (Willd.) Ohwi & Ohashi) gene pool as assessed by SSR markers. Genome 51: 728–738.