Abstract
We investigated the relationships of three allelic variations in Glu-B3 (ab, g, and h) with dough properties and bread-making quality-related characteristics using near-isogenic lines (NILs) of ‘Yumechikara’ that commonly carry Glu-A1a, Glu-B1b, Glu-D1d, Glu-A3f, Glu-B3ab and Glu-D3a. Measurement of peak time (PT) in a 2-g mixograph indicated that Glu-B3g was the most effective for a strong dough property, followed by Glu-B3ab, with Glu-B3h being the least effective. The results of measurement of mixing time during bread-making were similar to those for PTs, i.e., the lines carrying Glu-B3g showed the longest mixing time, followed by those of Glu-B3ab, and those of Glu-B3h showed the shortest mixing time. Since two parameters of bread-making quality, loaf volume (LV) and specific loaf volume (SLV), were affected by flour protein contents in all groups of the Glu-B3 genotype, we compared the effects of the three Glu-B3 alleles on those parameters using analysis of covariance (ANCOVA) to remove the effect of protein content. The results indicated that the Glu-B3h group showed the largest SLV, followed by the Glu-B3ab group, and the Glu-B3g group showed the smallest SLV. These results suggest that the introduction of Glu-B3h into ‘Yumechikara’ makes it possible to breed varieties with good bread-making quality-related characteristics.
Introduction
In Japan, about 1.5 million tons of hard wheat flour (strong flour) is used for the production of bread each year. This amount accounts for approximately 30% of the total amount of wheat flour used each year. However, only 50,000 tons of strong wheat grain is domestically produced, and the rate of self-sufficiency in wheat for bread is only 3% (Ministry of Agriculture, Forestry and Fisheries 2011).
In order to increase the production of domestic strong flour, many varieties for bread have been developed in research organizations throughout Japan. ‘Yumechikara’ is a newly developed hard wheat variety for bread in Hokkaido, where most of the wheat is produced in Japan (accounting for approximately 70% of total domestic wheat production). ‘Yumechikara’ has characteristics of extra-strong wheat, which causes a small loaf volume (LV) without blending with other flours, but it can be used to produce bread with a large LV by blending with weak gluten flour (Tabiki et al. 2011). Therefore, it is processed into bread by blending with weak flour, such as soft wheat flour for Japanese noodles, or wholemeal flour. ‘Haruyokoi’, a spring hard wheat variety cultivated in Hokkaido, has different dough properties from those of ‘Yumechikara’ and has good bread-making quality-related characteristics without blending with other flours.
Wheat contains a protein called gluten, which consists of glutenin and gliadin proteins. The bread-making quality and dough strength of wheat are affected by the protein content (Finney and Yamazaki 1946) and by the composition of proteins (Branlard and Dardevet 1985, Gupta et al. 1989, Payne et al. 1979, 1981, 1987). Glutenin proteins consist of high-molecular-weight glutenin subunits (HMW-GSs) and low-molecular-weight glutenin subunits (LMW-GSs). HMW-GSs and LMW-GSs are both closely associated with dough strength and bread-making quality (Branlard et al. 2001). HMW-GSs are encoded by three loci, Glu-A1, Glu-B1, and Glu-D1, and LMW-GSs are also encoded by three loci, Glu-A3, Glu-B3, and Glu-D3.
The Glu loci make different contributions to dough strength. Gupta et al. (1994) reported that the contributions by loci could be ranked as Glu-D1 > Glu-B1 > Glu-B3 > Glu-A3 > Glu-D3 = Glu-A1 with respect to maximum dough resistance. Zhang et al. (2009) reported that Glu-D1 and Glu-B3 play the most important roles in determining dough properties.
The alleles at Glu loci also contribute differently to dough strength. Many previous studies have shown that HMW-GSs encoded by alleles on Glu-1 loci have different effects on dough strength and bread-making quality. It is well known that the HMW-GS pair 5 + 10 encoded by Glu-D1d contributes to strong dough and good bread-making quality (Campbell et al. 1987, Cressy et al. 1987, Lagudah et al. 1987, Payne et al. 1981). HMW-GS 1 and 2* encoded by Glu-A1a and Glu-A1b, respectively, and 7 + 8, 7 + 9, and 17 + 18 encoded by Glu-B1b, Glu-B1c, and Glu-B1i, respectively, also contribute to strong dough and good bread-making quality (Cressy et al. 1987, Eagles et al. 2002, He et al. 2005, Jin et al. 2013, Payne et al. 1981, 1987).
LMW-GSs, which are encoded by alleles on Glu-3 loci, also have effects on dough strength and bread-making quality. Among alleles at the Glu-A3 locus, Glu-A3b and Glu-A3d contribute to strong dough properties and good bread-making quality-related characteristics (Gupta et al. 1991, Ito et al. 2011, Jin et al. 2013, Zhang et al. 2012), whereas Glu-A3e (null allele) contributes to a weak dough property and poor bread-making quality (Eagles et al. 2002, Zhang et al. 2012).
Among alleles at the Glu-B3 locus, Glu-B3b contributes more to a high value of maximum dough resistance (Gupta et al. 1991, 1994), good bread-making quality (Zhang et al. 2012), and a high value of sodium dodecyl sulfate (SDS) sedimentation volume, which is related to large SLV (Si et al. 2013) and strong dough properties (Tabiki et al. 2006), than do other Glu-B3 alleles. Glu-B3g also contributes to good bread-making quality (Zhang et al. 2012), high value of SDS sedimentation volume (Si et al. 2013), and strong mixograph properties (Jin et al. 2013). However, these reports disagree on ranking of the alleles by dough strength, due to differences in the genetic background of materials.
Among alleles at the Glu-D3 locus, Glu-D3b and Glu-D3a contribute to maximum dough resistance (Gupta et al. 1991), and Glu-D3f significantly contributes to mixograph properties. Zhang et al. (2012) reported that Glu-D3 alleles play minor roles.
Dough strength and bread-making quality are greatly affected by a combination of Glu-1 and Glu-3 alleles. Eagles et al. (2002) showed that interactions of Glu-B1 × Glu-A3 and Glu-B1 × Glu-B3 are particularly important for maximum dough resistance and extensibility. Gupta et al. (1994) reported that the interaction between Glu-B1 and Glu-D1 loci was the most important factor for maximum dough resistance. In a previous study, we found that the combination of Glu-D1, Glu-B3, and Glu-A3 alleles is an important factor for dough properties and bread-making quality-related characteristics, and we suggested that the effects of Glu-B3 alleles on dough strength and bread-making quality differ greatly under conditions with or without Glu-D1d (Ito et al. 2011).
Most of the hard wheat varieties, which are being developed in our breeding program, have alleles with positive effects on dough strength and bread-making properties on Glu-1 loci encoding HMW-GSs (having a or b on Glu-A1, b or c on Glu-B1, and d on Glu-D1). On the other hand, it is possible to improve bread-making properties by introduction of other alleles on Glu-3 loci encoding LMW-GSs. Thus, we focused on the Glu-B3 locus, which has been reported to play the most important role in determining dough properties among Glu-3 loci, and attempted to elucidate the effects of three alleles (Glu-B3g and Glu-B3b: alleles contributing to strong dough properties; Glu-B3h: allele carried by Haruyokoi, a variety with good bread-making properties) on dough properties and bread-making properties by using NILs to minimize the influence of differences in genetic background.
Liu et al. (2010) reported that Glu-B3ab can be resolved from Glu-B3b, and it was revealed by using the method of classification proposed by Ikeda et al. (2009) that ‘Yumechikara’ has Glu-B3ab. The combination of Glu-D1d and Glu-B3b (ab) in ‘Yumechikara’ accounts for the extra-strong dough property (Ito et al. 2012, Tabiki et al. 2011). In the present study, we produced near-isogenic lines (NILs), which carry different Glu-B3 alleles, by using ‘Yumechikara’ and investigated the relationship of allelic variation in Glu-B3 with dough properties and bread-making quality-related characteristics under conditions with Glu-D1d.
Materials and Methods
Plant and flour materials
We used 76 NILs derived from three crosses between Kachikei 63 (former name of ‘Yumechikara’, a leading hard winter wheat variety in Hokkaido; Glu-B3ab carrier) and three winter wheat varieties carrying different alleles on Glu-B3, Kitami 81 (former name of ‘Kitahonami’, a leading soft wheat variety in Hokkaido; Glu-B3g carrier), Mekei 0419a (Glu-B3g carrier), and ‘Horoshiri-komugi’ (Glu-B3h carrier). These lines were produced by backcrossing using ‘Yumechikara’ as a recurrent parent and the other three varieties as donor parents. The recurrent backcrossing was carried out three or four times, followed by self-fertilization. Lines carrying three homozygous genotypes on Glu-B3 (Glu-B3h derived from ‘Horoshiri-komugi’, Glu-B3g derived from ‘Kitahonami’ or Mekei 0419a, and Glu-B3ab derived from ‘Yumechikara’) were selected.
Regarding HMW-GSs, only Mekei 0419a of all the donor parents carries Glu-A1b, a different allele to that of ‘Yumechikara’ on Glu-A1 (‘Yumechikara’ carries Glu-A1a.), and only ‘Horoshiri-komugi’ of all the donor parents carries Glu-B1c, a different allele to that of ‘Yumechikara’ on Glu-B1 (‘Yumechikara’ carries Glu-B1b.). However, Gupta et al. (1994) and Eagles et al. (2002) reported that there is no significant difference between the maximum dough resistances produced by Glu-A1a and Glu-A1b. Furthermore, many studies have shown that Glu-B1b and Glu-B1c produce dough with almost the same strength (Branlard et al. 2001, Eagles et al. 2002, Jin et al. 2013). On the other hand, ‘Kitahonami’ and ‘Horoshiri-komugi’ carry Glu-D1a, a different allele to that of ‘Yumechikara’ on Glu-D1 (‘Yumechikara’ carries Glu-D1d.). It is well known that Glu-D1d has a great effect on dough strength. Thus, we checked the genotypes of NILs with regard to only Glu-D1 by the method of Ishikawa et al. (2005), and the lines that did not carry Glu-D1d were removed from the selected lines.
Liu et al. (2010) reported that Glu-B3ab can only be resolved and distinguished from Glu-B3b by a two-dimensional polyacrylamide gel electrophoresis (2-D PAGE) method. In the present study, we detected three Glu-B3 alleles (b, g, and h) of NILs by a polymerase chain reaction (PCR) as described by Suzuki et al. (2006). However, the PCR could not distinguish Glu-B3b from Glu-B3ab. Therefore, in the present study, we regarded that the lines detected to carry Glu-B3b by the method of Suzuki et al. (2006) carry Glu-B3ab derived from ‘Yumechikara’.
The seeds of all selected lines were sown in late September 2011 in a research field at the NARO Hokkaido Agricultural Research Center, Memuro, Hokkaido, and were grown in an experimental plot consisting of 2-m rows with 72-cm widths under standard field management conditions. Wheat samples were harvested in the maturation period (late July in 2012) and dried, and they were threshed in early August of 2012.
Flour quality test
Wheat samples were milled with a Brabender Jr. test mill (Brabender Inc., Duisburg, Germany). Two fractions (A-flour and B-flour) were obtained by a drawer partitioned in half for receiving flour. A-flour, which is a higher grade than that of B-flour, was used for evaluation of flour qualities. A-flour was 87–92% of the total ground flour. The protein content was measured by a near-infrared reflectance instrument (Inframatic 8120, Percon Co., Hamburg, Germany). The dough properties were evaluated by a 2-g mixograph (National Manufacturing Division of TMCO, Lincoln, NE, USA). Distilled water was added to 2 grams of flour (14% moisture basis) with optimum absorption calculated by the American Association of Cereal Chemists (AACC) method (Method 54-40A, 1995: optimum absorption (%) = 1.5 × flour protein content (14% moisture basis) + 43.6). The mixing peak time (PT), with longer time corresponding to stronger dough, was measured.
Determination of Glu-B3 genotypes by polymerase chain reaction (PCR)
Fresh leaves of one-month-old seedlings were harvested in the research field and then frozen in a freezer at −20°C. The frozen leaves were ground with 800 μl of 2% cetyl trimethyl ammonium bromide (CTAB) and stainless steel beads in a 2-ml sample tube by a multi-beads shocker (Shake Master, Biomedical Science, Tokyo, Japan) and incubated at 65°C for 30 min. Six hundred μl of chloloform-isoamyl alcohol (=24 : 1) was added to the sample tubes after incubation and centrifuged (16200 × g, 10 min), and then 600 μl of the supernatant was added to 400 μl of isopropanol in a 1.5-ml sample tube. After centrifugation (16200 × g, 15 min), the supernatant was removed and the residue was dried at room temperature. The dried residue was dissolved in 100–400 μl TE buffer (0.01 M Tris-HCl, 1 mM EDTA) and was used as a template for PCR. PCR was performed using 10 μl of amplification solution containing 1 μl of the template solution and forward and reverse primers for Glu-B3 (Suzuki et al. 2006) in a Thermal Cycler (Veriti 384 Well, Applied Biosystems, Foster City, CA, USA) programmed at 95°C for 15 min, followed by 35 cycles at 94°C for 30 sec, 55°C for 30 sec, and 72°C for 2 min, and then followed by 72°C for 5 min.
Bread-making tests
The bread-making quality-related characteristics of 76 NILs (28 lines carrying Glu-B3b, 23 lines carrying Glu-B3g, and 25 lines carrying Glu-B3h) were evaluated. Bread-making tests were performed by the straight-dough method modified from the Japan Yeast Industry Association method (1991) and the AACC method (Method 10-09, 1995). The ingredients (100 g flour, 5 g sucrose, 2 g salt, 5 g shortening, 2 g yeast, 30 ppm ascorbic acid solution, and an adequate volume of distilled water) were mixed in a 100-g Micro-Mixier (National Manufacturing Division of TMCO, Lincoln, NE, USA). Mixing time for bread-making was determined by observation of the dough condition during bread-making. After mixing, the dough was rounded and allowed to rest for 50 min in a fermentation cabinet at 30°C (first fermentation), and then sheeted, rounded, and allowed to rest for 30 min at 30°C (second fermentation), followed by sheeting and fermentation for 15 min at 30°C (bench time). After the bench time, the dough was panned and proofed at 38°C and 85% humidity for 55 min (final proof) and then baked at 200°C for 25 min. The bread was weighed and the LV (ml) was measured by the rapeseed-replacement method after cooling at room temperature for 1 hr. SLV (ml/g) was obtained by dividing LV (ml) by bread weight (g).
Statistical analysis
Data were subjected to a Turkey-Kramer multiple comparison test to examine the effects of allelic variation on flour protein content, dough properties, and mixing time for bread-making using the software Excel-Toukei 2012 (Social Survey Research Information Co., Ltd.). Two parameters of bread-making quality-related characteristics, LV and SLV, that showed strong correlations with flour protein content were used for analysis of covariance (ANCOVA), and data for LV and SLV in each genotypic group were corrected by removing the effect of flour protein content.
Results
Relationships between flour protein content and genotypes of Glu-B3
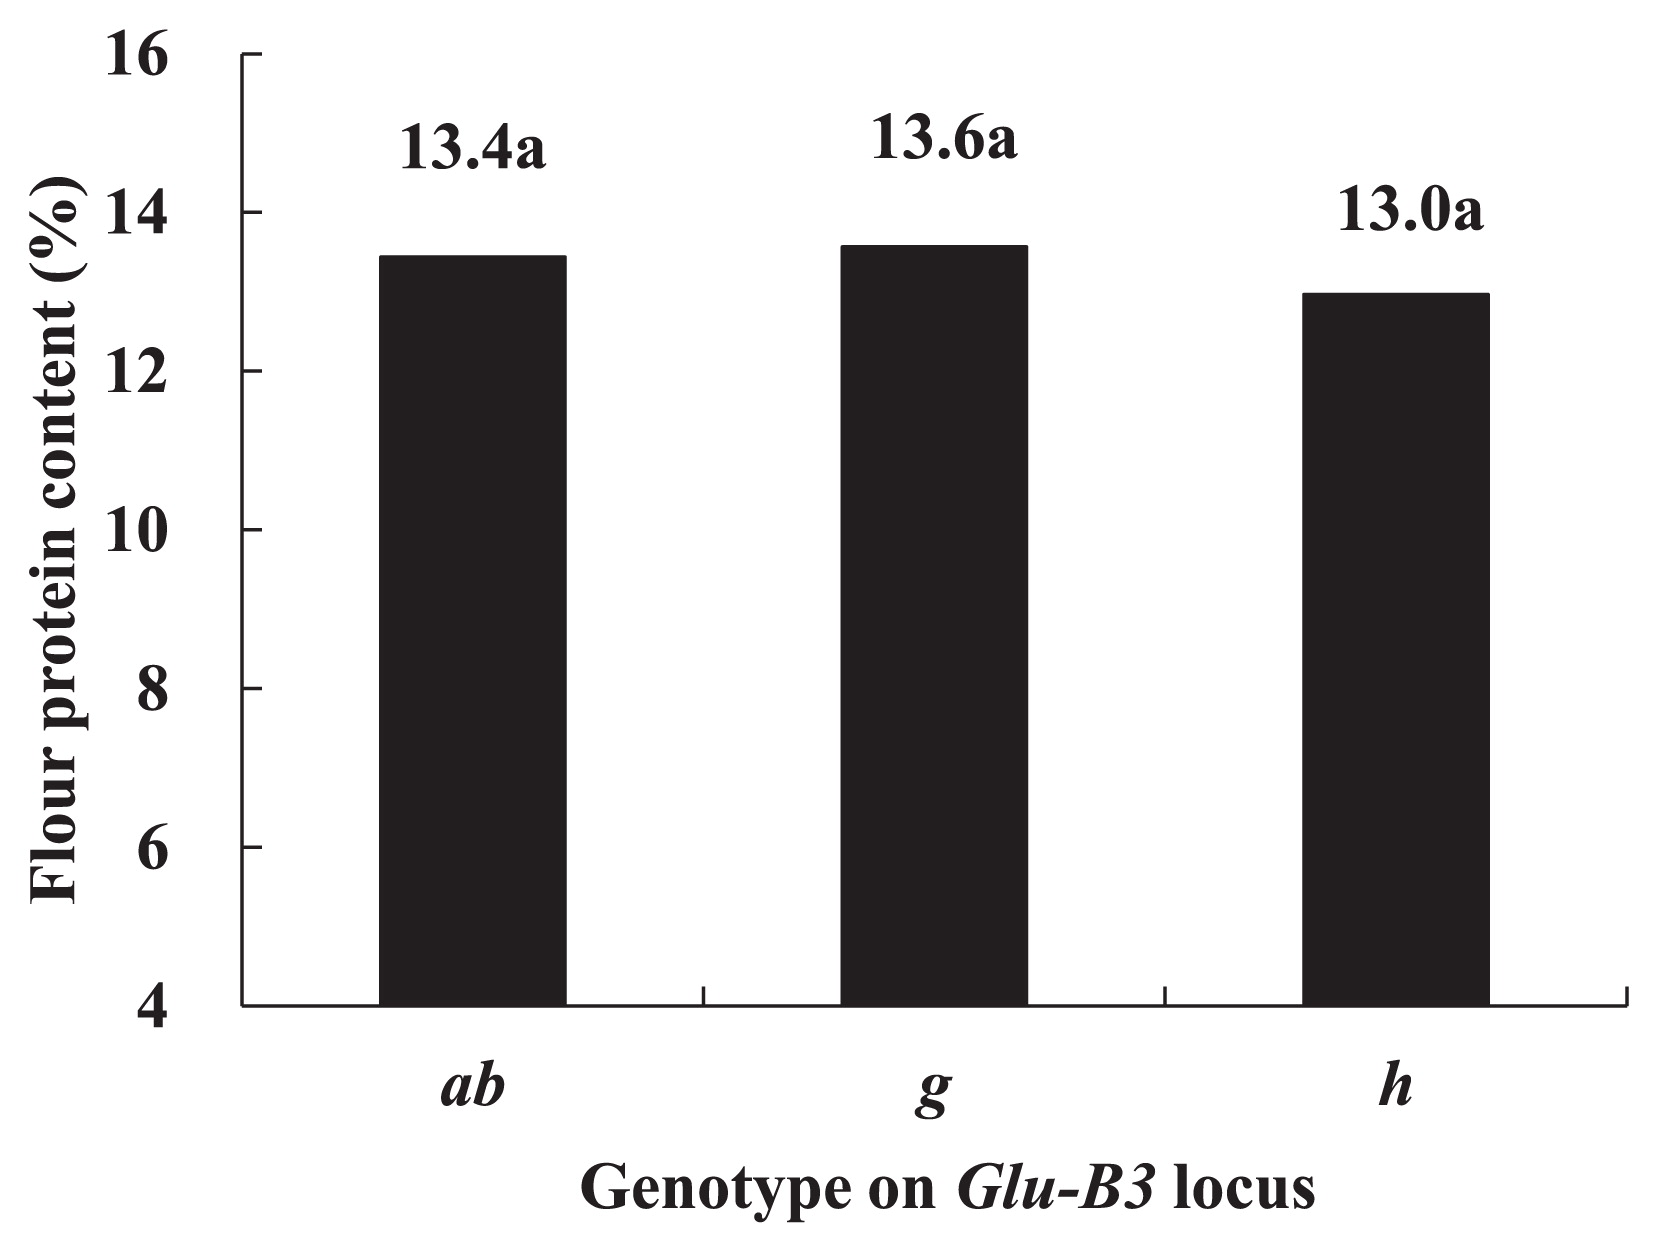
The flour protein contents of lines carrying Glu-B3ab ranged from 11.0 to 14.7%, those of lines carrying Glu-B3g ranged from 11.8 to 14.9%, and those of lines carrying Glu-B3h ranged from 11.5 to 14.7%. The average contents in these three genotypes are shown in Fig. 1. The lines carrying Glu-B3g had the highest flour protein content (13.6%), followed by the lines carrying Glu-B3ab (13.4%), and the lines carrying Glu-B3h had the lowest flour protein content (13.0%). However, there were no significant differences among these contents.
Relationships between dough strength and genotypes of Glu-B3
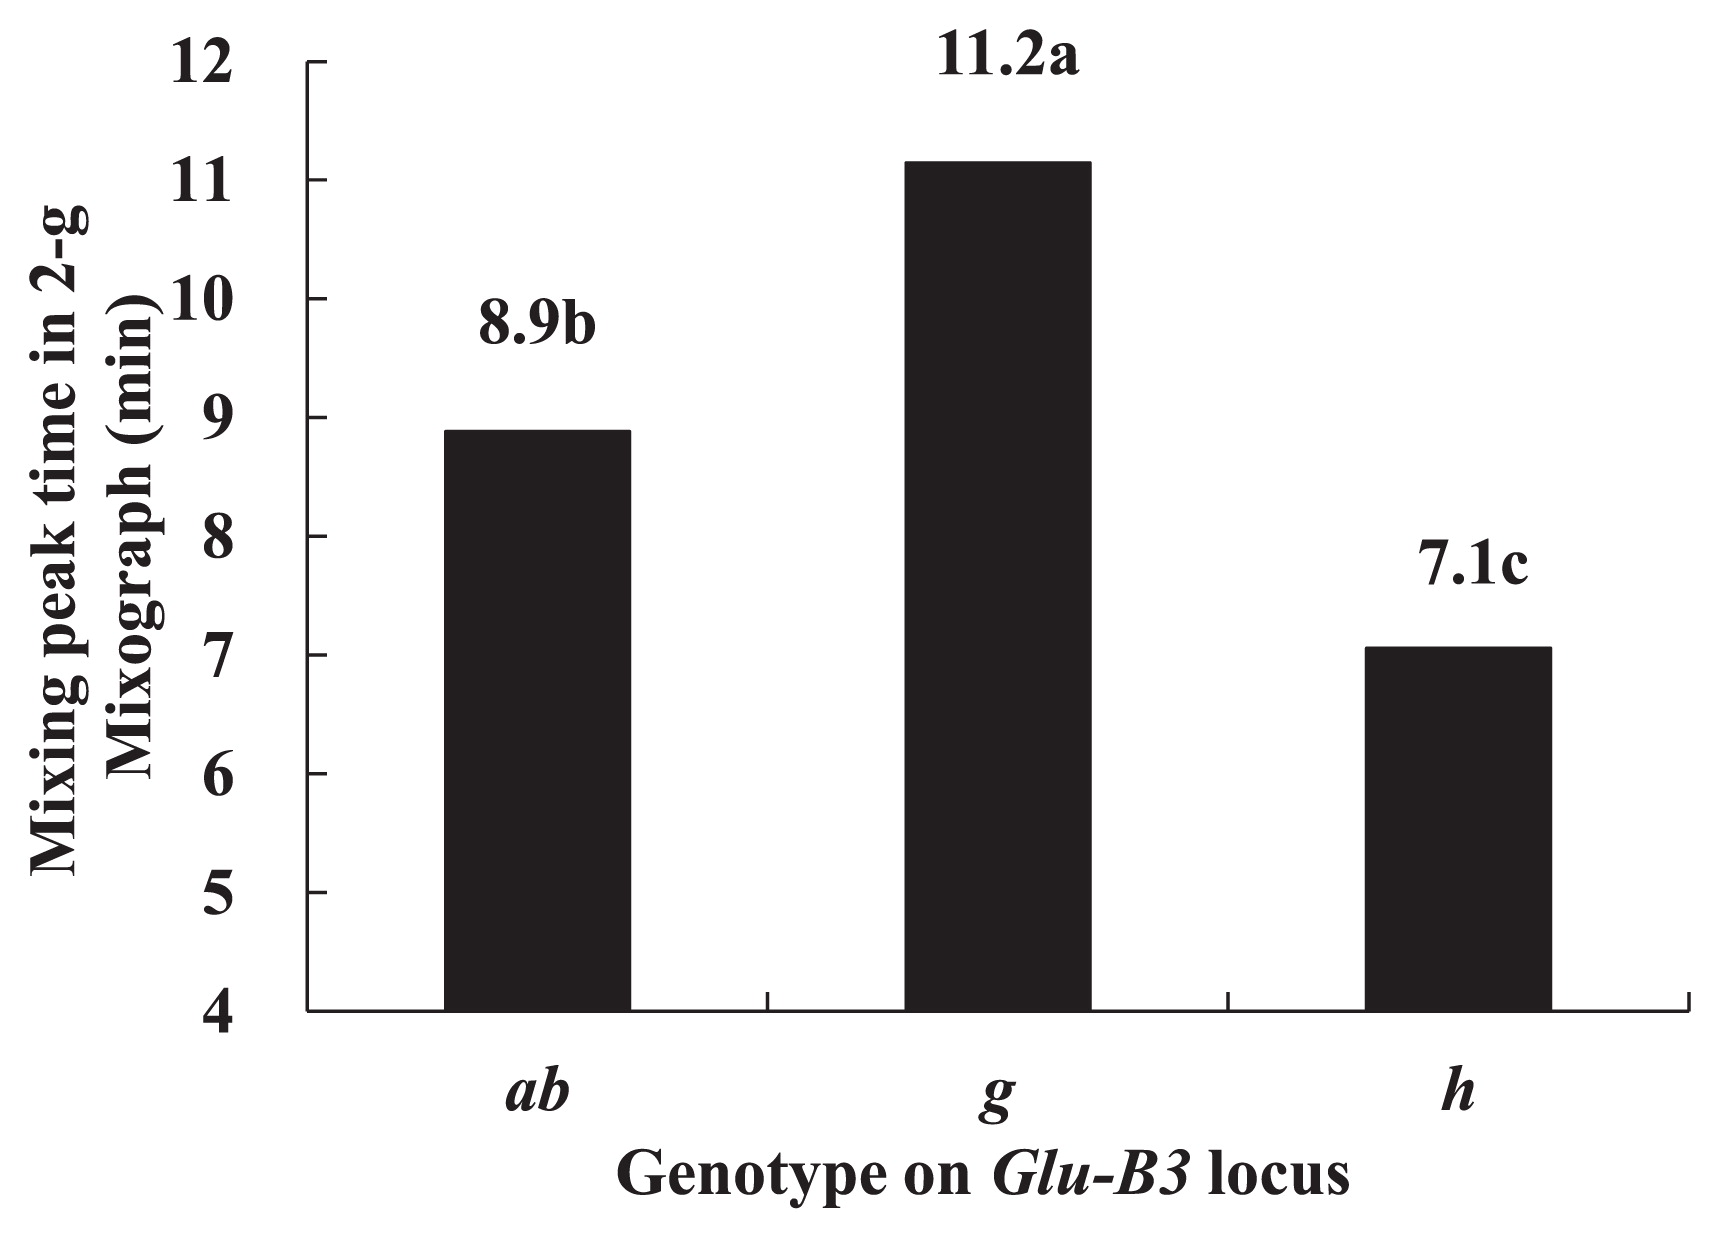
The mixing peak times (PTs) in a 2-g mixograph are shown in Fig. 2. The lines carrying Glu-B3g showed the longest PT, followed by the lines carrying Glu-B3ab, and the lines carrying Glu-B3h showed the shortest PT. The results indicated that the lines carrying Glu-B3g have the strongest dough property, the lines carrying Glu-B3ab have the next-strongest dough property, and the lines carrying Glu-B3h have the weakest dough property.
Relationships between mixing time for bread-making and genotypes of Glu-B3
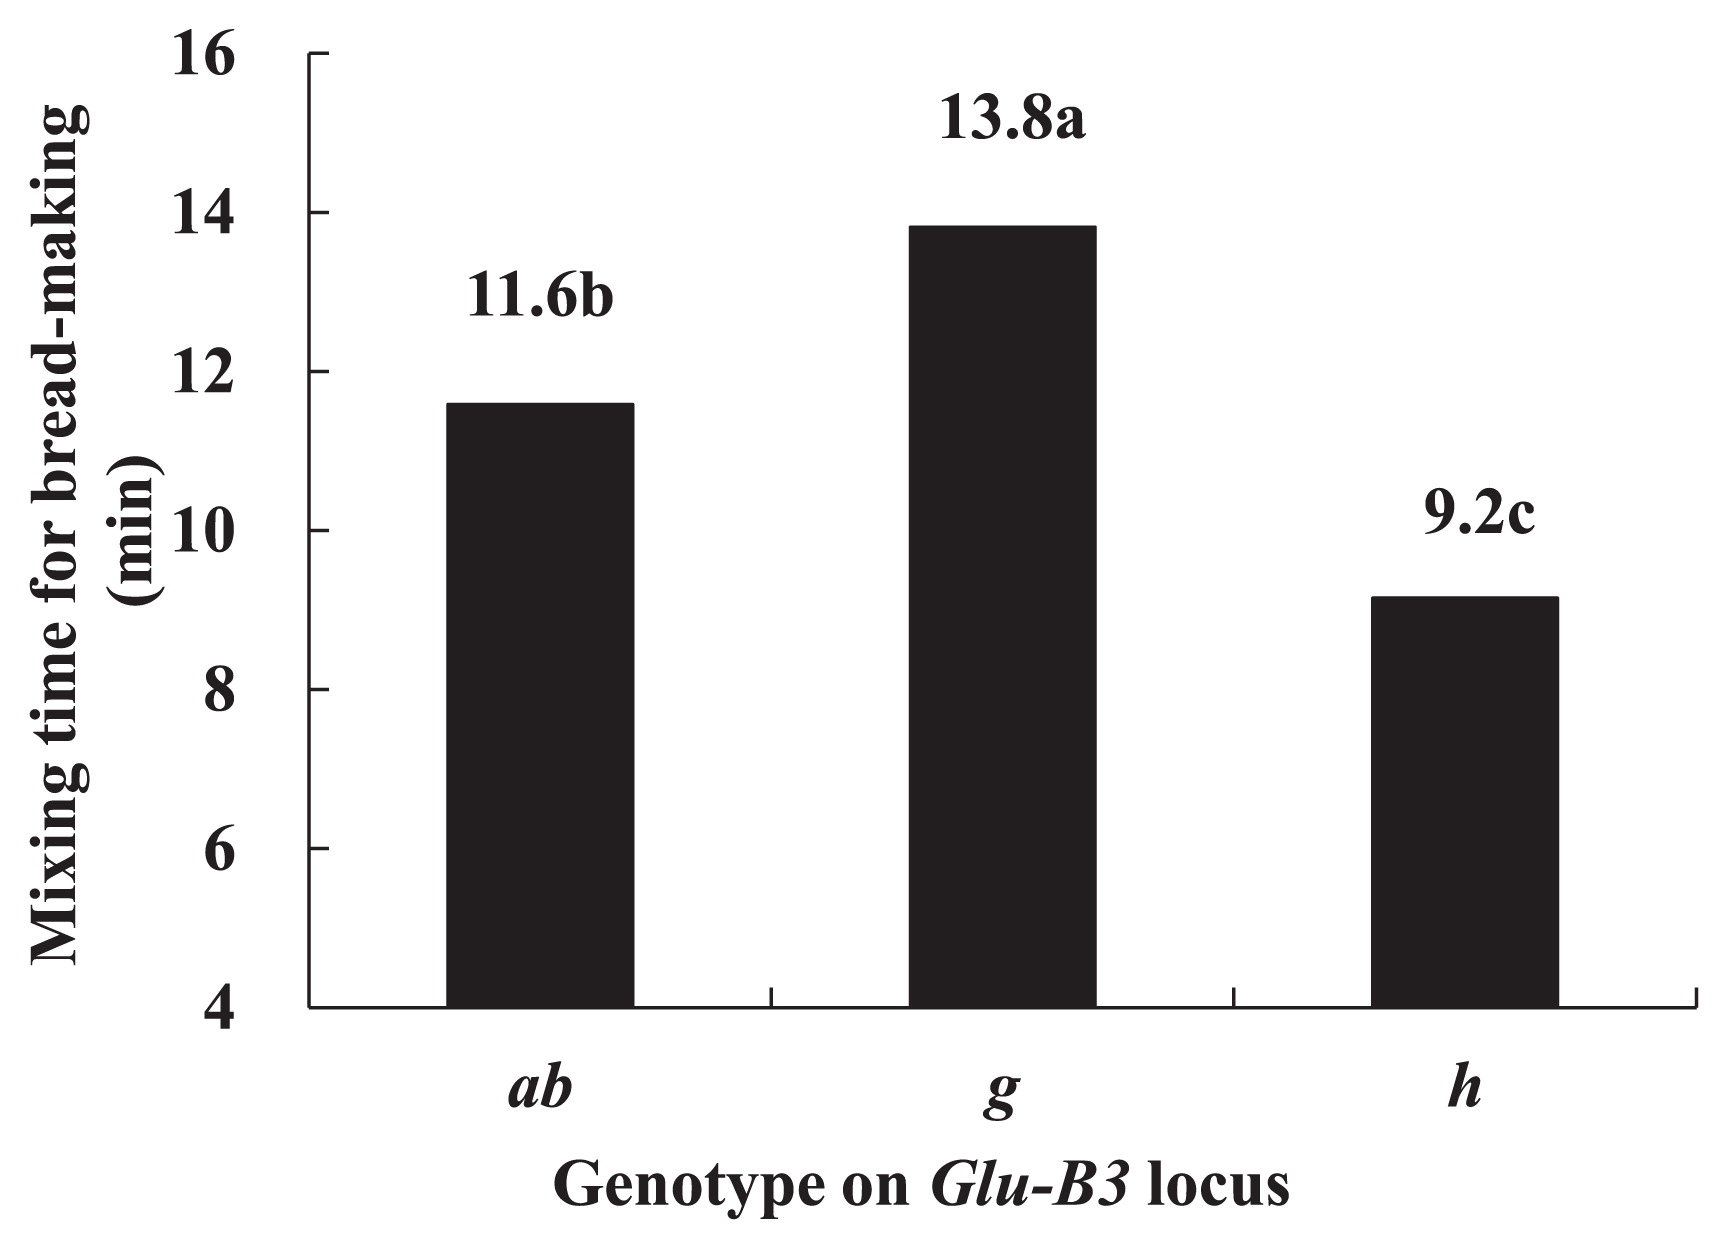
The mixing times for bread-making are shown in Fig. 3. The lines carrying Glu-B3g showed the longest mixing time, followed by the lines carrying Glu-B3ab, and the lines carrying Glu-B3h showed the shortest mixing time. The results indicated that the lines carrying Glu-B3g need the longest time to fully develop the dough, the lines carrying Glu-B3b need a longer time than those carrying Glu-B3h, and the dough of lines carrying Glu-B3h is developed in the shortest time.
Relationships between bread-making quality-related characteristics and genotypes of Glu-B3
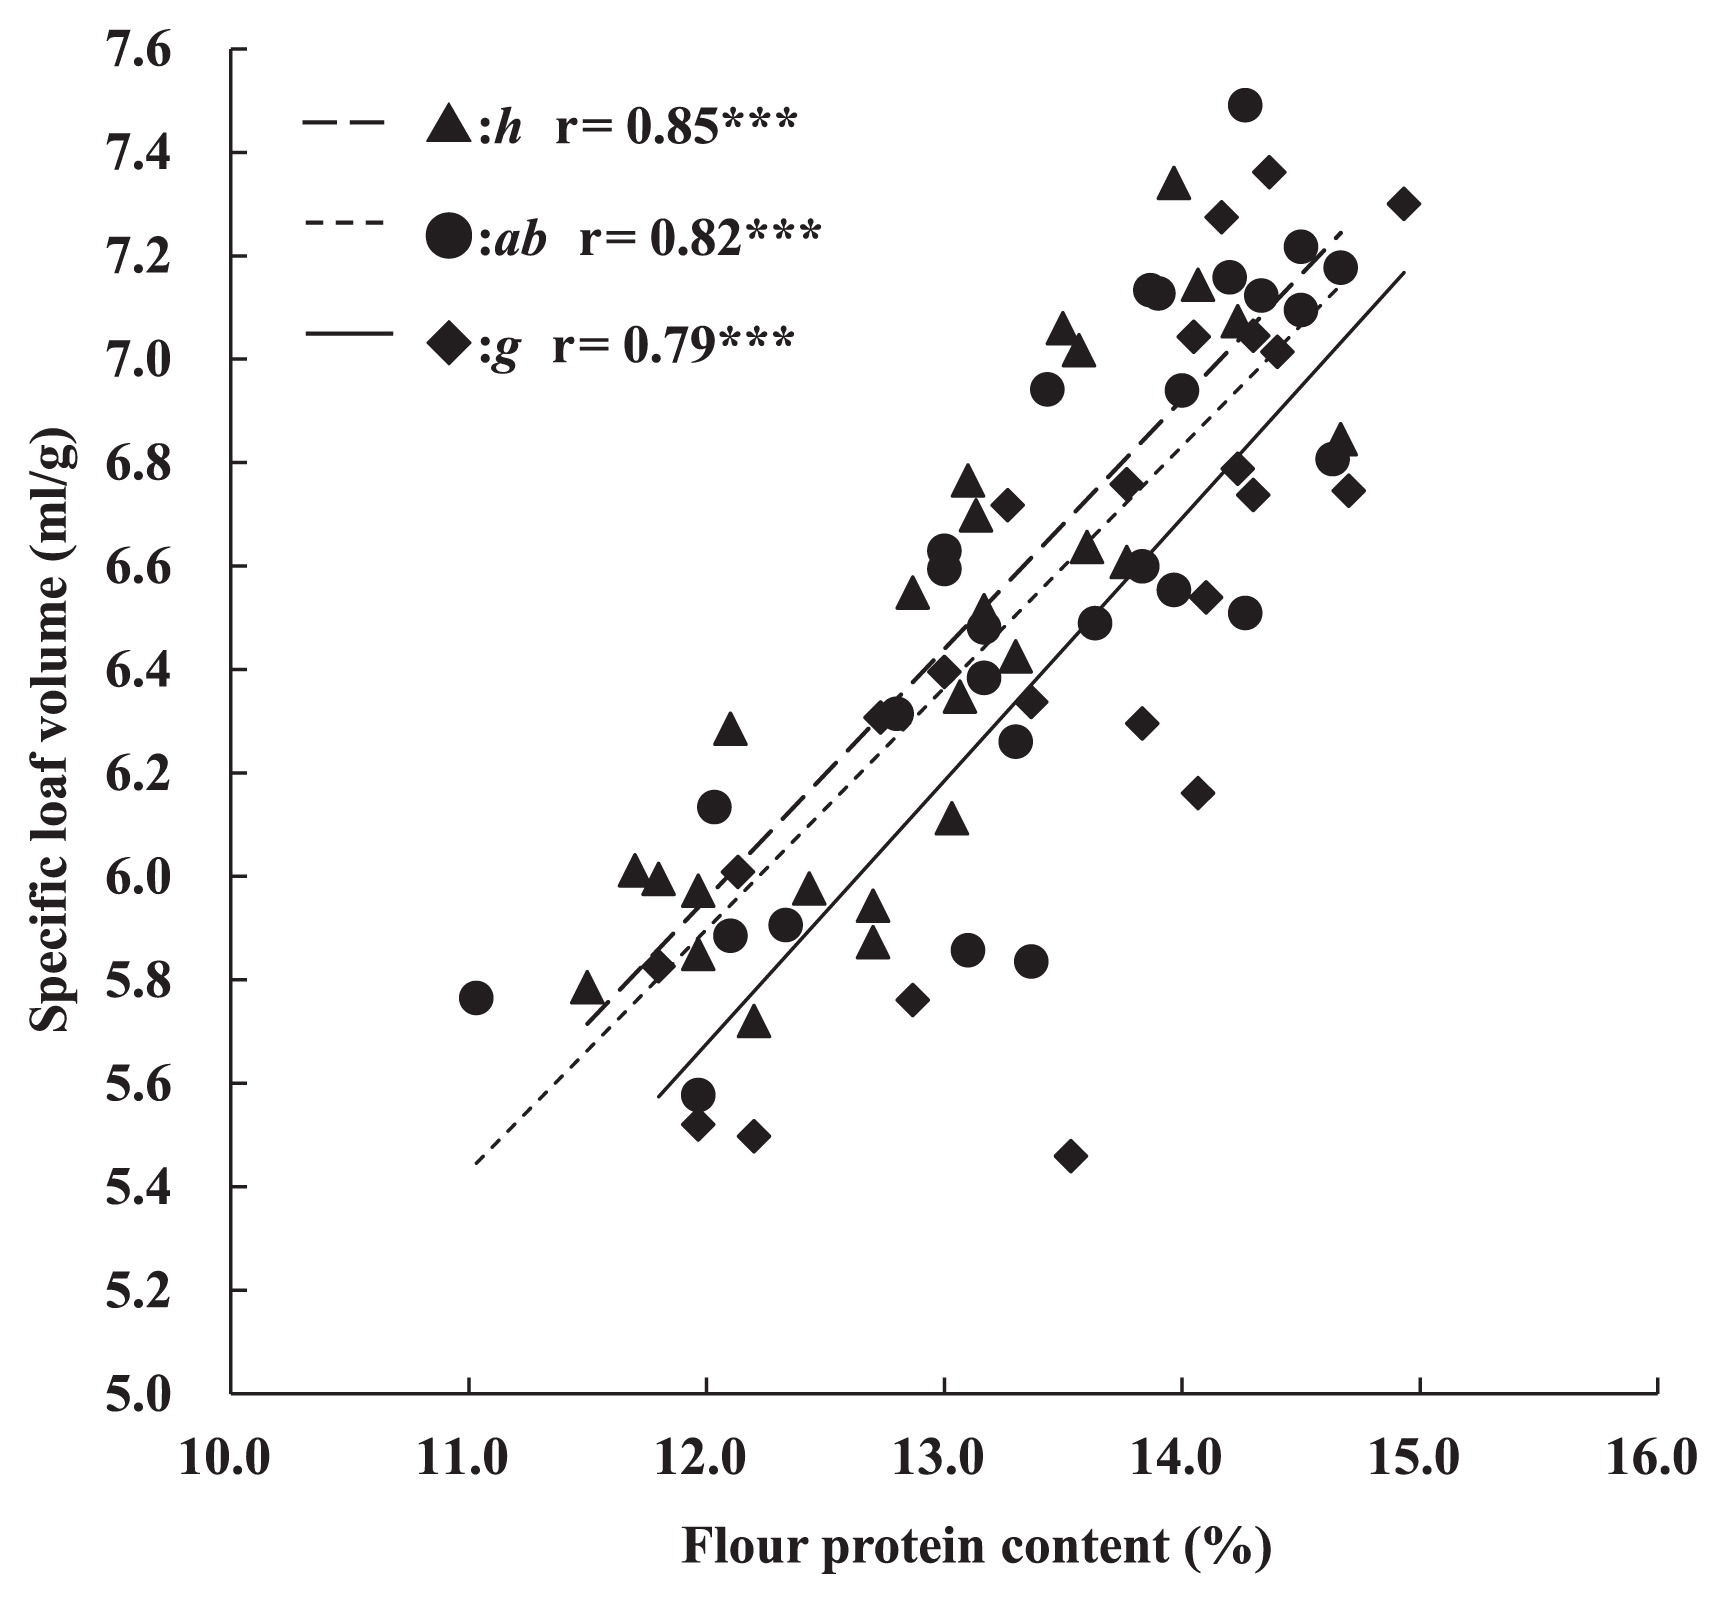
The relationship between protein content and bread-making quality was analyzed by calculating the correlation coefficients between SLVs and protein content (Fig. 4). SLV showed a significant correlation with flour protein content in lines carrying each of the three alleles at Glu-B3 (Glu-B3h: r = 0.85***, Glu-B3ab: r = 0.82***, Glu-B3g: r = 0.79***). This result indicated that bread-making quality was greatly affected by flour protein content. Thus, we analyzed lines using flour protein content as a covariate by analysis of covariance (ANCOVA) to remove the effect of protein content. First, we analyzed interactions between the factor (allelic variation on Glu-B3) and the covariate (flour protein content) to test parallelity of regression in each genotype. Analysis of variance (ANOVA) showed that there were no significant interactions between the factor and covariate. Therefore, the regression coefficients of the three genotypes were considered to be similar.
The F-values of the LVs and SLVs from ANCOVA for alleles on Glu-B3 are shown in Table 1. Both of the parameters for bread-making quality were affected significantly by the allelic variation on Glu-B3.
Table 1
F-values of LV and SLV from ANCOVA for alleles on
Glu-B3 (n = 76)
| Factor |
d.f. |
LV |
SLV |
| Glu-B3 |
2 |
3.20 * |
3.52 * |
| Flour protein content |
1 |
174.00 ** |
144.45 ** |
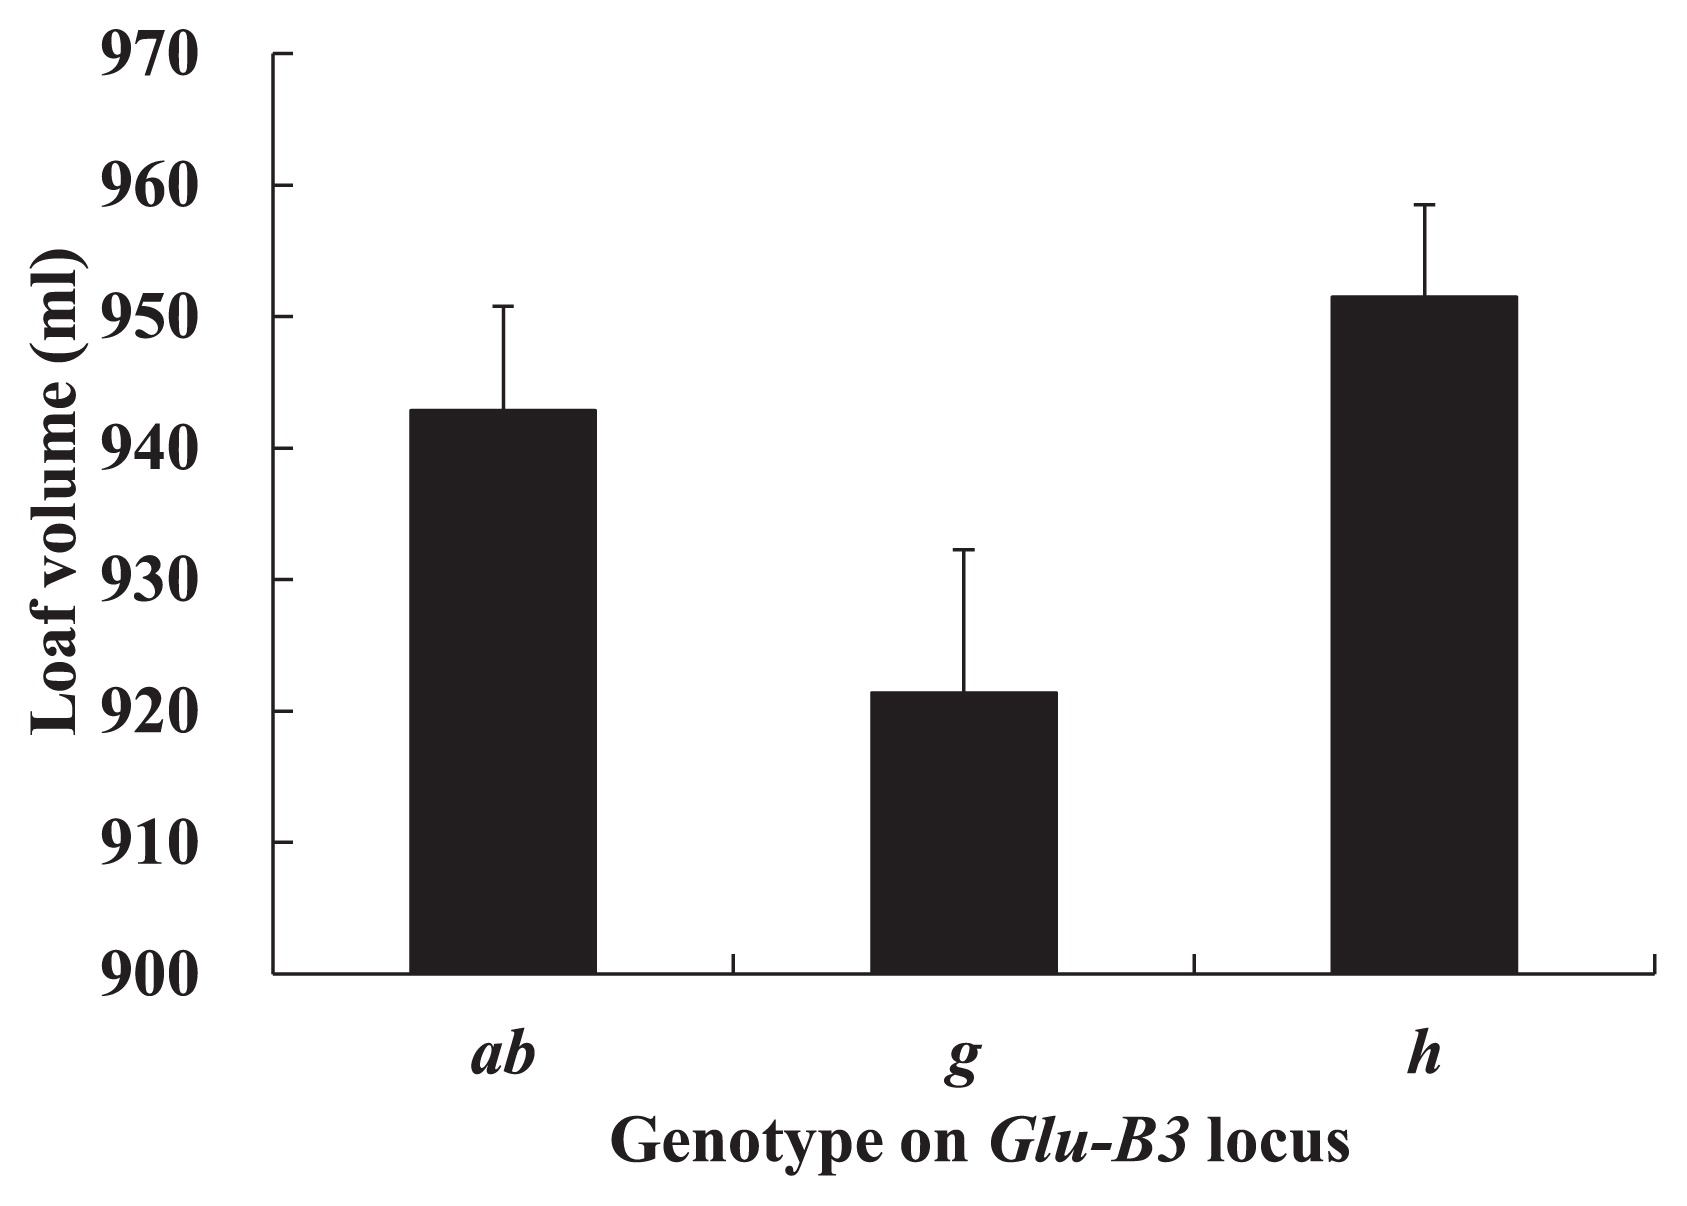
The corrected LVs and SLVs are shown in Fig. 5 and Fig. 6, respectively. The corrected values were expected values calculated by using the regression coefficient between LV (SLV) and flour protein content, assuming the lines have average protein content (corrected LV = LV-a (FP-AFP); corrected SLV = SLV-a (FP-AFP); a: regression coefficient between LV (SLV) and flour protein content; FP: flour protein content; AFP: average of flour protein content in all lines). The lines carrying Glu-B3h had the highest LV followed by the lines carrying Glu-B3ab, and the lines carrying Glu-B3g had the lowest LV. Similarly, for SLVs, the Glu-B3h lines showed the highest value, the Glu-B3g lines showed the lowest value, and the Glu-B3ab lines showed a value between them.
Discussion
The average measurement values of lines carrying Glu-B3ab in the present study were almost the same as those of the recurrent parent, ‘Yumechikara’. Data for ‘Yumechikara’ show an average of two years from 2011 to 2012 in our research field under the same cultivation method to NILs. Yumechikara had a flour protein content of 13.1%, PT of 8.3 min, mixing time of 10.8 min, SV of 940 ml, and SLV of 6.4. It is thought that the lines carrying Glu-B3ab have almost the same dough properties and bread-making quality related-characteristics as those of ‘Yumechikara’.
There were no significant differences among the protein contents of the three groups carrying different alleles on the Glu-B3 locus in the present study. Therefore, it is thought that the variation of dough properties among the three groups on the Glu-B3 locus does not result from the protein contents but from the protein compositions affected by Glu-B3 alleles. The NILs carrying all three alleles had various flour protein contents. There have been some reports about flour protein contents of the donor parents used in the present study, except Mekei 0419a. ‘Horoshiri-komugi’ was reported to have flour protein contents ranging from about 9.6 (Ozeki et al. 1975) to 10.4% (Yanagisawa et al. 2000). ‘Kitahonami’ has a lower flour protein content than that of ‘Hokushin’ (a leading variety before ‘Kitahonami’ in Hokkaido) (Yanagisawa et al. 2007), and ‘Yumeshikara’ has an about 2% higher flour protein content than that of ‘Hokushin’ (Tabiki 2014). Thus, ‘Horoshiri-komugi’ has lower flour protein contents than those of ‘Yumechikara’ NILs, and ‘Kitahonami’ has lower flour protein contents than those of ‘Yumechikara’. It is thought that the variation of protein contents among the groups carrying the same Glu-B3 allele was caused by the small number of replications in backcrossing (three or four times) when NILs were developed and by the effect of the lower flour protein contents of the donor parents.
The results for PTs in the 2-g mixograph indicated that Glu-B3g was the most effective for a strong dough property, followed by Glu-B3ab, and that Glu-B3h was the least effective. The effects of Glu-B3 alleles on dough strength have been compared in many previous studies, but the results are inconsistent because of differences in evaluation values and genetic background. Gupta et al. (1991) ranked the contributions of Glu-B3 alleles by measuring the maximum dough resistance as follows: Glu-B3b = Glu-B3i >> Glu-B3g = Glu-B3h >> Glu-B3c. Martinez-Cruz et al. (2011) ranked them by gluten strength of recombinant lines as Glu-B3g = Glu-B3h > Glu-B3j, and Zhang et al. (2012) ranked them by maximum dough resistance as Glu-B3g > Glu-B3b = Glu-B3i > Glu-B3c. The results of the present study indicated that the contributions of Glu-B3 alleles to strong dough were ranked as Glu-B3g > Glu-B3b (ab) > Glu-B3h, being consistent with the results obtained by Zhang et al. (2012) and results of some previous studies (Funatsuki et al. 2007, Ito et al. 2011, Tabiki et al. 2006) in which dough strength was evaluated by the peak time in a mixograph. In addition, there was an obvious (a significant) difference between the effect on dough strength of Glu-B3ab and that of Glu-B3g in the present study. Ito et al. (2011) reported that recombinant lines carrying Glu-B3g show longer PT than that of the lines carrying Glu-B3b when they are accompanied by Glu-D1d. It was reported that both Glu-B3b and Glu-B3g have additive effects with Glu-D1d on the strength of dough (Funatsuki et al. 2007, Tabiki et al. 2006). Therefore, it is thought that there is an obvious difference in the degrees of additive effect between Glu-D1d and Glu-B3ab or Glu-B3g.
The results of mixing times for bread-making were similar to those of PTs in the 2-g mixograph; e.g., the lines carrying Glu-B3g showed the longest mixing time, followed by those of Glu-B3ab, and those of Glu-B3h showed the shortest mixing time. These results suggest that lines carrying Glu-B3g and Glu-B3ab need a long time for bread-making and have less production per hour in large-scale processing than do lines carrying Glu-B3h, which might be a disadvantage for bakeries. However, if the flour of Glu-B3ab and Glu-B3g lines is blended with a weak flour for bread-making, it could compensate for the weak dough property, as in the case of ‘Yumechikara’ utilized in bakeries.
LV and SLV, two parameters for bread-making quality-related characteristics, were affected by the flour protein contents for all genotypes on Glu-B3, and we compared the effects of the three Glu-B3 alleles on bread-making quality-related characteristics using ANCOVA to remove the effect of protein content. The lines carrying Glu-B3h showed the largest SLV, followed by Glu-B3ab, and the lines carrying Glu-B3g showed the smallest SLV. Zhang et al. (2012) compared the bread-making quality-related characteristics of ‘Aroona’ NILs carrying various alleles on Glu-B3 and reported that Glu-B3g produces the best quality parameters, including LV. In contrast, we found that LV and SLV of Glu-B3g lines are smaller than those of Glu-B3h and Glu-B3ab. The disagreement in results is thought to have been caused by the allelic difference at Glu-D1 alleles between ‘Aroona’ (Glu-D1a) and ‘Yumechikara’ (Glu-D1d). Since all of the ‘Yomechikara’ NILs carrying Glu-B3g in the present study also have Glu-D1d, it is thought that the additive effects of Glu-B3g and Glu-D1d make the dough too strong for bread-making.
The lines carrying Glu-B3h showed the shortest mixing time for bread-making and the largest LV and SLV among the three genotypes of lines used in the present study. Therefore, it was indicated that ‘Yumechikara’ NILs with Glu-B3h caused moderate dough strength and had the most positive contribution to bread-making quality-related characteristics among the three groups of Glu-B3 alleles. Many varieties composing two classes, 1CW (No.1 Canada Western Red Spring) and DNS (Dark Northern Spring), and ‘Haruyokoi’, which have been established as leading (elite) varieties with good bread-making quality-related characteristics in the flour market, carry Glu-D1d, which increases gluten strength, and Glu-B3h, which contributes to moderate dough strength (Ikeda and Takata 2012, Ikeda et al. 2014, Ito et al. 2012). The ‘Yumechikara’ NILs with Glu-B3h are thought to have good bread-making quality-related characteristics like those of the above elite varieties.
The results of the present study suggest that the introduction of Glu-B3h into ‘Yumechikara’ accompanied by Glu-D1d makes it possible to breed varieties that have good bread-making quality-related characteristics without blending with other flours. On the other hand, dough strength, mixing time for bread-making, LV, and SLV for NILs with Glu-B3ab were between those for NILs with Glu-B3h and Glu-B3g. Thus, it is inferred that varieties with the same glutenin composition as that of ‘Yumechikara’ NILs carrying Glu-B3ab are more suitable for bread-making without blending than are varieties with the same glutenin composition as that of ‘Yumechikara’ NILs carrying Glu-B3g. However, it is thought that varieties with the same glutenin composition as that of ‘Yumechikara’ NILs carrying Glu-B3g are not suitable for bread-making without blending, since ‘Yumechikara’ NILs with Glu-B3g provide excessively strong dough, the longest mixing time for bread-making, and the smallest LV and SLV among the three genotypes of lines. However, Ito et al. (2012) reported that a variety with a combination of Glu-D1d and Glu-B3g has good qualities for fresh pasta-making, which needs a hard texture of strong dough. In conclusion, the development of hard wheat varieties with glutenin compositions of ‘Yumechikara’ NILs carrying different Glu-B3 alleles will make it possible to produce a variation of high-quality flour suitable for various flour processing products.
Acknowledgement
This study was financially supported by the Ministry of Agriculture, Forestry and Fisheries of Japan.
Literature Cited
- American Association of Cereal Chemists (1995) Approved methods of the AACC, Method 10-09, The Association, St. Paul, MN.
- American Association of Cereal Chemists (1995) Approved methods of the AACC, Method 54-40A, The Association, St. Paul, MN.
- Branlard, G. and M. Dardevet (1985) Diversity of grain proteins and bread wheat quality. II. Correlation between high molecular weight subunits of glutenin and flour quality characteristics. J. Cereal Sci. 3: 345–354.
- Branlard, G., M. Dardevet, R. Saccomano, F. Lagoutte and J. Gourdon (2001) Genetic diversity of wheat storage proteins and bread wheat quality. Euphytica 119: 59–67.
- Campbell, W.P., C.W. Wrigley, P.J. Cressey and C.R. Slack (1987) Statistical correlations between quality attributes and grain protein composition for 71 hexaploid wheats used as breeding parents. Cereal Chem. 64: 293–299.
- Cressy, P.J., W.P. Campbell, C.W. Weigley and W.B. Griffin (1987) Statistical correlation between quality attributes and grain protein composition for 60 advanced lines of crossbred wheat. Cereal Chem. 64: 299–301.
- Eagles, H.A., G.J. Hollamby, N.N. Gororo and R.F. Eastwood (2002) Estimation and utilization of glutenin gene effects from the analysis of unbalanced data from wheat breeding programs. Aust. J. Agric. Res. 53: 367–377.
- Finney, K.F. and W.T. Yamazaki (1946) Water retention capacity as an index of the loaf volume potentialities and protein quality of hard red winter wheats. Cereal Chem. 23: 416–427.
- Funatsuki, W.M., K. Takaka, T. Tabiki, M. Ito, Z. Nishio, H. Funatsuki and H. Yamauchi (2007) A specific combination of HMW and LMW glutenin subunits results in extra-strong dough properties. Gluten proteins 2006, AACC International press, St. Paul, pp. 1–5.
- Gupta, R.B., N.K. Singh and K.W. Shepherd (1989) The cumulative effect of allelic variation in LMW and HMW glutenin subunits on dough properties in the progeny of two bread wheats. Theor. Appl. Genet. 77: 57–64.
- Gupta, R.B., F. Bakes and C.W. Wrigley (1991) Prediction of physical dough properties from glutenin subunit composition in bread wheats: correlation studies. Cereal Chem. 68: 328–333.
- Gupta, R.B., J.G. Paul, G.B. Cornish, G.A. Palmer, F. Bakes and A.J. Rathjien (1994) Allelic variation at glutenin subunit and gliadin loci, Glu-1, Glu-3 and Gli-1, of common wheats. I. Its additive and interaction effects on dough properties. J. Cereal Sci. 19: 9–17.
- He, Z.H., L. Liu, X.C. Xia, J.J. Liu and R.J. Pena (2005) Composition of HMW and LMW glutenin subunits and their effects on dough properties, pan bread, and noodle quality of Chinese wheats. Cereal Chem. 82: 345–350.
- Ikeda, T.M., G. Branlard, R.J. Pena, K. Takata, L. Liu, Z. He, S.E. Lerner, M.A. Kolman and W.J. Rogers (2009) Characterization of new Glu-3 alleles in bread wheat. Gluten Proteins 2009 Ed. INRA, Paris France, pp. 180–183.
- Ikeda, T.M. and K. Takata (2012) Comparison of glutenin subunit composition among Australian and North American wheat classes. International Gluten Workshop, 11th; Beijing, China, pp. 12–15.
- Ikeda, T.M., M. Yanaka and K. Takata (2014) Comparison of quality-related alleles among Australian and north American wheat classes exported to Japan. Creal Chem. 91: 616–622.
- Ishikawa, G., M. Saito, H. Ito, M. Taira, H. Maejima, Y. Taniguchi and T. Nakamura (2005) Development of PCR-based DNA marker for identifying wheat high-molecular-weight glutenin subunits “5 + 10” and its applications to breeding of bread-making cultivars for the Tohoku region. Bull. Natl. Agric. Res. Cent. Tohoku Reg. 103: 27–37.
- Ito, M., S. Fushie, W.M. Funatsuki, T.M. Ikeda, Z. Nishio, K. Nagasawa, T. Tabiki and H. Yamauchi (2011) Effect of allelic variation in three glutenin loci on dough properties and bread-making qualities of winter wheat. Breed. Sci. 61: 281–287.
- Ito, M., W.M. Funatsuki, T.M. Ikeda, Z. Nishio, K. Nagasawa, T. Tabiki and H. Yamauchi (2012) Evaluation of fresh pasta-making properties of extra-strong common wheat (Triticum aestivum L.). Breed. Sci. 62: 340–347.
- Japan Yeast Industry Association (1991) Technical Rep. Japan Yeast Ind. Assoc. 60: 85–102.
- Jin, H., Y. Zhang, G. Li, P. Mu, Z. Fan, X. Xia and Z. He (2013) Effects of allelic variation of HMW-GS and LMW-GS on mixograph properties and Chinese noodle and steamed bread qualities in a set of Aroona near-isogenic wheat lines. J. Creal Sci. 57: 146–152.
- Lagudah, E.S., F. Macritchie and G.M. Halloran (1987) The influence of high-molecular-weight subunits of glutenin from Triticum tauschii on flour quality of synthetic hexaploid wheat. J. Cereal Sci. 5: 129–138.
- Liu, L., T.M. Ikeda, G. Branlard, R.J. Pena, W.J. Rogers, S.E. Lerner, M.A. Kolman, X. Xia, L. Wang, W. Ma et al. (2010) Comparison of low molecular weight glutenin subunits identified by SDS-PAGE, 2DE, MALDI-TOF-MS and PCR in common wheat. BMC Plant Biol. 10: 124.
- Martinez-Cruz, E., E. Espitia-Rangel, H.E. Villasenor-Mir, J.D. Molina-Galan, I. Benitez-Riquelme, A. Santacruz-Varela and R.J. Pena-Bautista (2011) Dough rheology of wheat recombinant lines in relation to allelic variants of Glu-1 and Glu-3 loci. Cereal Res. Commun. 39: 386–393.
- Ministry of Agriculture, Forestry and Fisheries (2011) Annual report on food, agriculture and rural areas in Japan. http://www.maff.go.jp/j/wpaper/w_maff/h23_h/trend/part1/chap1/c1_04.html.
- Ozeki, S., H. Sasaki, Y. Amano and T. Tsuchiya (1975) The new winter wheat variety “Horoshirikomugi”. Bulletin of the Hokkaido Prefectural Agricultural Experiment Station. 33: 11–20.
- Payne, P.I., K.G. Corfield and J.A. Blackman (1979) Identification of a high-molecular-weight subunit of glutenin whose presence correlates with bread-making quality in wheats of related pedigree. Theor. Appl. Genet. 55: 153–159.
- Payne, P.I., K.G. Corfield, L.M. Holt and J.A. Blackman (1981) Correlation between the inheritance of certain high-molecular weight subunits of glutenin and bread-making quality in progenies of six crosses of bread wheat. J. Sci. Food Agric. 32: 51–60.
- Payne, P.I., M.A. Nightingale, A.F. Krattiger and L.M. Holt (1987) The relationship between HMW glutenin subunit composition and the bread-making quality of British grown wheat varieties. J. Sci. Food Agric. 40: 51–65.
- Si, H., M. Zhao, F. He and C. Ma (2013) Effect of Glu-B3 allelic variation on sodium dodecyl sulfate sedimentation volume in common wheat (Triticum aestivum L.). The Scientific World Journal: article ID 848549.
- Suzuki, T., M. Sato, H. Jinno, K. Nakamichi, N. Sato, T. Nishimura, S. Kobayashi, M. Ikenaga, Y. Yoshimura and T. Takeuchi (2006) Marker-assisted characterization of Hokkaido wheat lines for typing of puroindoline, glutenin and Wx gene. Report of the Hokkaido Branch, the Japanese Society of Breeding and Hokkaido Branch, the Crop Science Society of Japan 47: 89–90.
- Tabiki, T., S. Ikeguchi and T.M. Ikeda (2006) Effect of high-molecular-weight and low-molecular-weight glutenin subunit alleles on common wheat flour quality. Breed. Sci. 56: 131–136.
- Tabiki, T., Z. Nishio, M. Ito, H. Yamauchi, K. Takata, T. Kuwabara, N. Iriki, M. Tanio, T. Ikeda and W. Funatsuki (2011) A new extra-strong hard red winter wheat variety: ‘Yumechikara’. Res. Bull. NARO Hokkaido Agric. Res. Cent. 195: 1–12.
- Tabiki, T. (2014) Breeding of an extra-strong wheat variety ‘Yumechikara’. Breed. Res. 16: 175–179.
- Yanagisawa, A., K. Tanifuji, K. Araki, Y. Amano, S. Maeno, T. Tabiki, H. Sasaki, S. Ozeki, M. Makita and T. Tsuchiya (2000) A new winter wheat variety “Hokushin”. Bulletin of the Hokkaido Prefectural Agricultural Experiment Station. 79: 1–12.
- Yanagisawa, A., Y. Yoshimura, Y. Amano, S. Kobayashi, T. Nishimura, K. Nakamichi, K. Araki, K. Tanifuji, T. Tabiki and N. Sato (2007) A new winter wheat variety “Kitahonami”. Bulletin of the Hokkaido Prefectural Agricultural Experiment Station. 91: 1–13.
- Zhang, Y., J. Tang, J. Yan, Y. Zhang, Y. Zhang, X. Xia and Z. He (2009) The gluten protein and interactions between components determine mixograph properties in an F6 recombinant inbred linepopulation in bread wheat. J. Cereal Sci. 50: 219–226.
- Zhang, X., H. Jin, Y. Zhang, D. Liu, G. Li, X. Xia and A. Zhang (2012) Composition and functional analysis of low-molecular-weight glutenin alleles with Aroona near-isogenic lines of bread wheat. BMC Plant Biol. 12: 243.