Abstract
Insertion-deletion (indel) polymorphisms, such as simple sequence repeats, have been widely used as DNA markers to identify QTLs and genes and to facilitate rice breeding. Recently, next-generation sequencing has produced deep sequences that allow genome-wide detection of indels. These polymorphisms can potentially be used to develop high-accuracy polymerase chain reaction (PCR)-based markers. Here, re-sequencing of 5 indica, 2 aus, and 3 tropical japonica cultivars and Japanese elite cultivar ‘Koshihikari’ was performed to extract regions containing large indels (10–51 bp) shared by diverse cultivars. To design indel markers for the discrimination of genomic regions between ‘Koshihikari’ and other diverse cultivars, we subtracted the indel regions detected in ‘Koshihikari’ from those shared in other cultivars. Two sets of indel markers, KNJ8-indel (shared in eight or more cultivars, including ‘Khao Nam Jen’ as a representative tropical japonica cultivar) and C5-indel (shared in five to eight cultivars), were established, with 915 and 9,899 indel regions, respectively. Validation of the two marker sets by using 23 diverse cultivars showed a high PCR success rate (≥95%) for 83.3% of the KNJ8-indel markers and 73.9% of the C5-indel markers. The marker sets will therefore be useful for the effective breeding of Japanese rice cultivars.
Introduction
Japanese lowland rice cultivars belong to the temperate japonica group, and have specific phenotypes that are well-adapted to particular environmental conditions in Japan. Numerous new cultivars with improved yield and eating quality have been developed by changing the haplotypes in the rice genome through breeding (Yamamoto et al. 2010, Yonemaru et al. 2012). Recently, climate change has forced us to look for ways to increase the genetic resistance and/or tolerance of rice to both biotic and abiotic stresses. To this end, it is necessary to uncover the most effective alleles for improving agronomic traits, and to develop a wide range of genetic resources for use in breeding. Quantitative trait locus (QTL) analysis and subsequent introduction of a new allele by marker-assisted selection is one way to facilitate improvement of rice cultivars (Miura et al. 2011, Yamamoto et al. 2009). The introgression of a favorable allele found in a diverse Asian rice population into Japanese rice cultivars has been widely used to improve elite Japanese cultivars (http://www.naro.affrc.go.jp/genome/database/ine/index.html). Because of almost even genetic distances from each accession (Kojima et al. 2005, Shomura et al. 2008), ten cultivars (five from the indica group: ‘Bei Khe’, ‘Bleiyo’, ‘Deng Pao Zhai’, ‘Nona Bokra’, and ‘Qiu Zhao Zhong’; two from the aus group: ‘Kasalath’ and ‘Tupa 121-3’; and three from the tropical japonica group: ‘Basilanon’, ‘Khao Nam Jen’, and ‘Khau Mac Kho’) were used as donors to produce chromosomal segment substitution lines (CSSLs) in our rice improvement project (Fukuoka et al. 2010). Such regional variations in the rice genome may reflect functional variations of the genes located in these chromosomal regions. CSSLs make it easier to detect weak allelic effects due to weaker genetic interactions, and lines with favorable phenotypes can be used as near-isogenic lines for breeding.
DNA markers are important tools for genetic dissection and improvement of target traits, and many types of DNA markers have been developed for rice genomes. After completion of the rice genome sequencing project, the sequence data was used to develop simple sequence repeat (SSR) markers (McCouch et al. 2002). SSR markers are particularly useful because they are frequently multi-allelic, usually contain polymorphic insertion-deletion (indel) sites, and can be easily detected by polymerase chain reaction (PCR) and gel electrophoresis (i.e., without the need of a specific detection apparatus). Next-generation sequencing (NGS) has provided sequence data for multiple rice cultivars. Several Japanese rice cultivars have been also re-sequenced to provide genome-wide single-nucleotide polymorphisms (SNPs) for the analysis of genome constitutions in the Japanese rice population (Arai-Kichise et al. 2011, 2014, Nagasaki et al. 2010, Takano et al. 2014, Yamamoto et al. 2010, Yonemaru et al. 2014). If the flanking sequences of an SNP allele have a recognition site for a restriction enzyme, the SNP can be detected by using a cleaved amplified polymorphic sequence (CAPS) assay; however, many SNP alleles require complex detection methods, such as derived CAPS and PCR with confronting two-pair primers (Hamajima 2001). High-throughput genotyping for large numbers of SNP markers has been achieved by using a high-density array (Appleby et al. 2009), and genome-wide SNPs can be located and genotyped by using NGS (Spindel et al. 2013).
Without abundant SNP markers, a relatively small number of indel markers would be enough to discriminate genotypes for rough mapping of a QTL, and marker-assisted introgression of the QTL into recipient cultivars. SSR markers have been widely used for this purpose, but they require screening for polymorphisms between each pair of parental cultivars due to unpredictable indel sizes, and small indels (≤5 bp) are difficult to discriminate by gel electrophoresis. Therefore, indels that have a predictable size and substantial polymorphic region (≥10 bp) are ideal for genotyping. NGS has not only provided SNPs but also indels for multiple rice cultivars. However, large indels (10–100 bp) have rarely been verified for marker use.
Such indels would be promising targets for the design of PCR-based markers to be used for QTL analysis between Japanese rice cultivars and diverse Asian rice cultivars. Additionally, these indel markers would be available for the introgression of a favorable genome segment derived from diverse Asian cultivars into Japanese rice cultivars. To enhance the success rate in PCR amplification and the detection of polymorphisms between Japanese rice cultivars and diverse Asian cultivars, we need information about indels with large polymorphisms that are shared by many diverse Asian cultivars compared to Japanese rice cultivars.
Here, we aimed to establish indel markers that can be used to discriminate between the genome regions of the Japanese elite cultivar ‘Koshihikari’ and 10 rice cultivars as described previously. By mapping NGS re-sequencing data and the lowland cultivar (temperate japonica) ‘Koshihikari’, indel regions that were common to many diverse rice cultivars but not ‘Koshihikari’ were detected and experimentally validated. All indel information is summarized in the supplementary materials.
Materials and Methods
Detection of genome-wide indel regions by means of Illumina short-read sequencing
To detect indel regions across the rice genome, we selected 10 cultivars for short-read Illumina re-sequencing. We have already obtained re-sequencing data for ‘Koshihikari’ (Yamamoto et al. 2010), but we obtained new re-sequencing data to maintain the quality of the sequence information.
Genomic DNA was extracted from leaves of each cultivar by the CTAB method (Murray and Thompson 1980). By using the Illumina HiSeq 2000 system (Illumina Inc, CA, USA), Illumina short reads for each cultivar were obtained with total sequence lengths ranging from 14.2 to 26.1 Gbp (Table 1). Low-quality bases (phred quality score, <Q20) in each read were trimmed by using the same process as in Kawahara et al. (2013). Adapter trimming was carried out by using the parameters (-O 5 and -m 32) in version 1.0 of the cutadapt software (Martin 2011). Trimmed reads were mapped to the ‘Nipponbare’ International Rice Genome Sequencing Project (IRGSP) v.1 reference genome by using version 0.6.2 of the BWA software with its default settings (Li and Durbin 2009). Only uniquely mapped reads with a mapping quality score of ≥20 were sorted and indexed, by using version 0.1.18 of the SAMtools software (Li et al. 2009). To improve the raw alignment around indels, local re-alignment was performed by using version 1.5.0 of the GATK software (DePristo et al. 2011). PCR duplicates were removed by using version 1.6.3 of the Picard software (http://picard.sourceforge.net). Indels and SNPs were identified individually for each sample by using the mpileup algorithm of SAMtools, with a filtering threshold (Q = 20).
Table 1
Sequence information for the 11 cultivars obtained by re-sequencing analysis using Illumina short reads
| Cultivar |
Category |
Sequencing data from all reads |
Mapped sequence data within the genome |
Mapped sequence data within the genic regions |
| Total nucleotides |
Depth (fold) |
Total bases |
Coverage (%) |
Depth (fold) |
Total bases |
Coverage (%) |
Depth (fold) |
| ‘Basilanon’ |
tropical japonica |
17,740,676,971 |
45.9 |
12,738,101,906 |
85.2 |
40.1 |
1,995,801,715 |
95.2 |
38.7 |
| ‘Bei Khe’ |
indica |
16,631,917,251 |
43.0 |
11,080,842,144 |
81.4 |
36.5 |
1,832,672,990 |
94.0 |
36.0 |
| ‘Bleiyo’ |
indica |
22,550,774,596 |
58.4 |
10,983,117,212 |
81.5 |
36.1 |
1,741,246,934 |
93.5 |
34.4 |
| ‘Deng Pao Zhai’ |
indica |
17,936,229,769 |
46.4 |
10,754,343,950 |
81.6 |
35.3 |
1,727,564,789 |
93.9 |
34.0 |
| ‘Kasalath’ |
aus |
14,219,078,182 |
36.8 |
8,696,383,968 |
81.8 |
28.5 |
1,501,708,865 |
94.3 |
29.4 |
| ‘Khao Nam Jen’ |
tropical japonica |
21,006,070,809 |
54.4 |
15,194,549,019 |
90.3 |
45.1 |
2,285,688,311 |
97.2 |
43.4 |
| ‘Khau Mac Kho’ |
tropical japonica |
22,905,210,790 |
59.3 |
17,688,217,567 |
88.9 |
53.3 |
2,634,014,052 |
96.0 |
50.6 |
| ‘Koshihikari’ |
temperate japonica |
19,910,363,512 |
51.5 |
14,205,341,196 |
93.5 |
40.7 |
2,459,122,055 |
98.2 |
46.2 |
| ‘Nona Bokra’ |
indica |
26,101,851,416 |
67.6 |
13,343,845,531 |
82.6 |
43.3 |
2,124,784,352 |
94.2 |
41.6 |
| ‘Qiu Zao Zhong’ |
indica |
17,301,402,545 |
44.8 |
10,666,117,459 |
81.0 |
35.3 |
1,559,351,856 |
92.7 |
31.0 |
| ‘Tupa 121-3’ |
aus |
16,752,431,002 |
43.4 |
11,151,194,610 |
82.2 |
36.4 |
1,716,190,899 |
94.1 |
33.7 |
To design indel markers for detection of indel polymorphisms by electrophoresis, we extracted only indel regions with both a large size (≥10 bp) and a high sequencing depth (DP, ≥5 fold) from each indel list for the 11 cultivars. Because these indel regions also included SSR polymorphisms, some coincided with the positions of published SSR markers (International Rice Genome Sequencing Project 2005, McCouch 2002). Primer pairs for the selected indel regions were automatically designed by using a Perl script to control the Primer3 core program (Rozen and Skaletsky 2000). PCR product size ranged from 80 to 150 bp.
We screened primer pairs for duplication of sequences to maintain specificity. When the sequence of a primer pair matched that of another primer pair, the corresponding pairs were eliminated because they were considered redundant. If either sequence of a primer pair included all or a part of the masked sequences, it was classified as having a low uniqueness and eliminated. The indel markers were retained after elimination of primer pairs with the same marker positions as those of ‘Koshihikari’.
To demonstrate the general utility of these indel variations, we compiled two sets of indel markers with different criteria. The first set (KNJ8-indel) was developed mainly to distinguish chromosomal segments derived from tropical japonica cultivars from those of Japanese lowland rice cultivars. In particular, we mainly intended to discriminate the genomic regions between lowland rice cultivars and upland rice cultivars genetically close to tropical japonica. This indel marker set was based on indel regions common to at least eight cultivars, including the tropical japonica cultivar, ‘Khao Nam Jen’, but distinct from the temperate japonica cultivar, ‘Koshihikari’, and consisted of 915 indel markers (Supplemental Table 1). The second set (C5-indel) was established to distinguish chromosomal segments of lowland rice cultivars (temperate japonica) from all other cultivars except temperate japonica. These indel sets were aimed at discriminating genomic segments among the genetically diverse rice cultivars. The indel regions that were common to five to eight cultivars but were distinct from ‘Koshihikari’ were selected for a total set of 9,899 indel markers (Supplemental Table 2).
Validation of the designed indel markers
To validate the two marker sets, we tested the primer pairs for 120 KNJ8-indel markers and 785 C5-indel markers by means of gel electrophoresis. Markers were randomly chosen so as to cover as much as possible of the entire genome, but were randomly chosen within each portion of the genome. The indel primer sets were validated by using a survey population consisting of 23 cultivars (Table 2), 11 of which were the cultivars used for detection of the indel regions. All 23 cultivars were donor or recipient cultivars of CSSLs or other analytical populations from our previous research (Fukuoka et al. 2010). Extraction of genomic DNA from these cultivars followed the same protocol that we used for re-sequencing.
Table 2
List of the 23 cultivars used for validation of the indel markers
| Name |
Category |
Origin |
| ‘Basilanon’ |
tropical japonica |
the Philippines |
| ‘Bei Khe’ |
indica |
Cambodia |
| ‘Bleiyo’ |
indica |
Thailand |
| ‘Davao 1’ |
indica |
the Philippines |
| ‘Deng Pao Zhai’ |
indica |
China |
| ‘Hayamasari’ |
temperate japonica |
Japan |
| ‘Hitomebore’ |
temperate japonica |
Japan |
| ‘IR64’ |
indica |
the Philippines |
| ‘Kasalath’ |
aus |
India |
| ‘Khao Nam Jen’ |
tropical japonica |
Laos |
| ‘Khau Mac Kho’ |
tropical japonica |
Vietnam |
| ‘Koshihikari’ |
temperate japonica |
Japan |
| ‘LAC 23’ |
tropical japonica |
Nigeria |
| ‘Muha’ |
aus |
Indonesia |
| ‘Naba’ |
indica |
India |
| ‘Nipponbare’ |
temperate japonica |
Japan |
| ‘Nona Bokra’ |
Indica |
India |
| ‘Owarihatamochi’ |
tropical japonica |
Japan |
| ‘Qiu Zhao Zhong’ |
Indica |
China |
| ‘Silewah’ |
tropical japonica |
Indonesia |
| ‘Takanari’ |
Indica |
Japan |
| ‘Toboshi’ |
Indica |
Japan |
| ‘Tupa 121-3’ |
Aus |
Bangladesh |
The 120 primer sets from KNJ8-indel were PCR amplified in approximately 5 μL of reaction mixture consisting of the master mix from the KAPA2G Fast PCR Kit (Nippon Genetics Co. Ltd., Japan) containing 1.7 to 3.3 pmol of each primer, and about 2 ng of the genomic DNA template. The conditions were an initial denaturation step for 1 min at 95°C, then 35 cycles of 10 s at 95°C, 10 s at 55°C, and 1 s at 72°C, followed by a final extension for 30 s at 72°C. The 785 primer sets from C5-indel were PCR amplified in approximately 8 μL of reaction mixture consisting of a GoTaq Colorless Master Mix (Promega, USA), 3.2 pmol of each primer, and a low amount of genomic DNA added with a plastic pin. The conditions were an initial denaturation step for 5 min at 94°C, then 35 cycles of 15 s at 94°C, 30 s at 55°C, and 30 s at 72°C, followed by a final extension for 2 min at 72°C. PCR products were analyzed by means of gel electrophoresis on 3–4% agarose gels in Tris/borate/EDTA buffer. After staining with ethidium bromide, the band patterns on the agarose gels were photographed under ultraviolet light for verification of indel polymorphisms. We classified the band patterns into four categories based on the number of bands: 0, no bands; 1, a band similar to the reference allele (‘Nipponbare’ IRGSP v.1); 2, an alternative allele type; 3, an unexpected allele type; and 4, multiple bands.
Results
Number of indel regions detected by NGS
The sequence depths estimated from sequencing data for all reads of the 11 cultivars ranged from 36.8 (‘Kasalath’) to 67.6 (‘Nona Bokra’) (Table 1). The mapped sequence depths were lower than those of the total sequence, and ranged from 28.5 (‘Kasalath’) to 53.3 (‘Khau Mac Kho’). The highest and lowest coverages of a reference genome by input reads were observed in ‘Koshihikari’ (93.5%) and ‘Qiu Zhao Zong’ (81.0%), respectively. The genic regions that were annotated by RAP-DB (Sakai et al. 2013) had higher coverage (92.7 to 98.2%) than the overall genome (Table 1).
The total number of indels, including heterozygous alleles, detected in the 11 cultivars was less than one-fifth of the number of SNPs (Table 3, Supplemental Table 3). The number of indels ranged from 24,898 for ‘Koshihikari’ to 341,433 for ‘Bei Khe’, with intermediate values of ca. 100,000 for ‘Khao Nam Jen’ and ‘Khau Mac Kho’. ‘Koshihikari’ had very few indels compared to the other cultivars. The number of selected indels was about one-tenth of the total number of indels in all 11 cultivars.
Table 3
Number of indels compared to the reference genome (‘Nipponbare’ IRGSP v.1) detected in the 11 cultivars
| Cultivar |
Category |
Indels |
Indels (selected) |
| ‘Basilanon’ |
tropical japonica |
234,431 |
22,815 |
| ‘Bei Khe’ |
indica |
341,433 |
32,514 |
| ‘Bleiyo’ |
indica |
336,533 |
34,069 |
| ‘Deng Pao Zhai’ |
indica |
334,157 |
32,953 |
| ‘Kasalath’ |
aus |
334,087 |
29,871 |
| ‘Khao Nam Jen’ |
tropical japonica |
107,797 |
9,462 |
| ‘Khau Mac Kho’ |
tropical japonica |
125,815 |
11,755 |
| ‘Koshihikari’ |
temperate japonica |
24,898 |
1,648 |
| ‘Nona Bokra’ |
indica |
347,557 |
35,921 |
| ‘Qiu Zao Zhong’ |
indica |
324,021 |
31,215 |
| ‘Tupa 121-3’ |
aus |
323,633 |
29,388 |
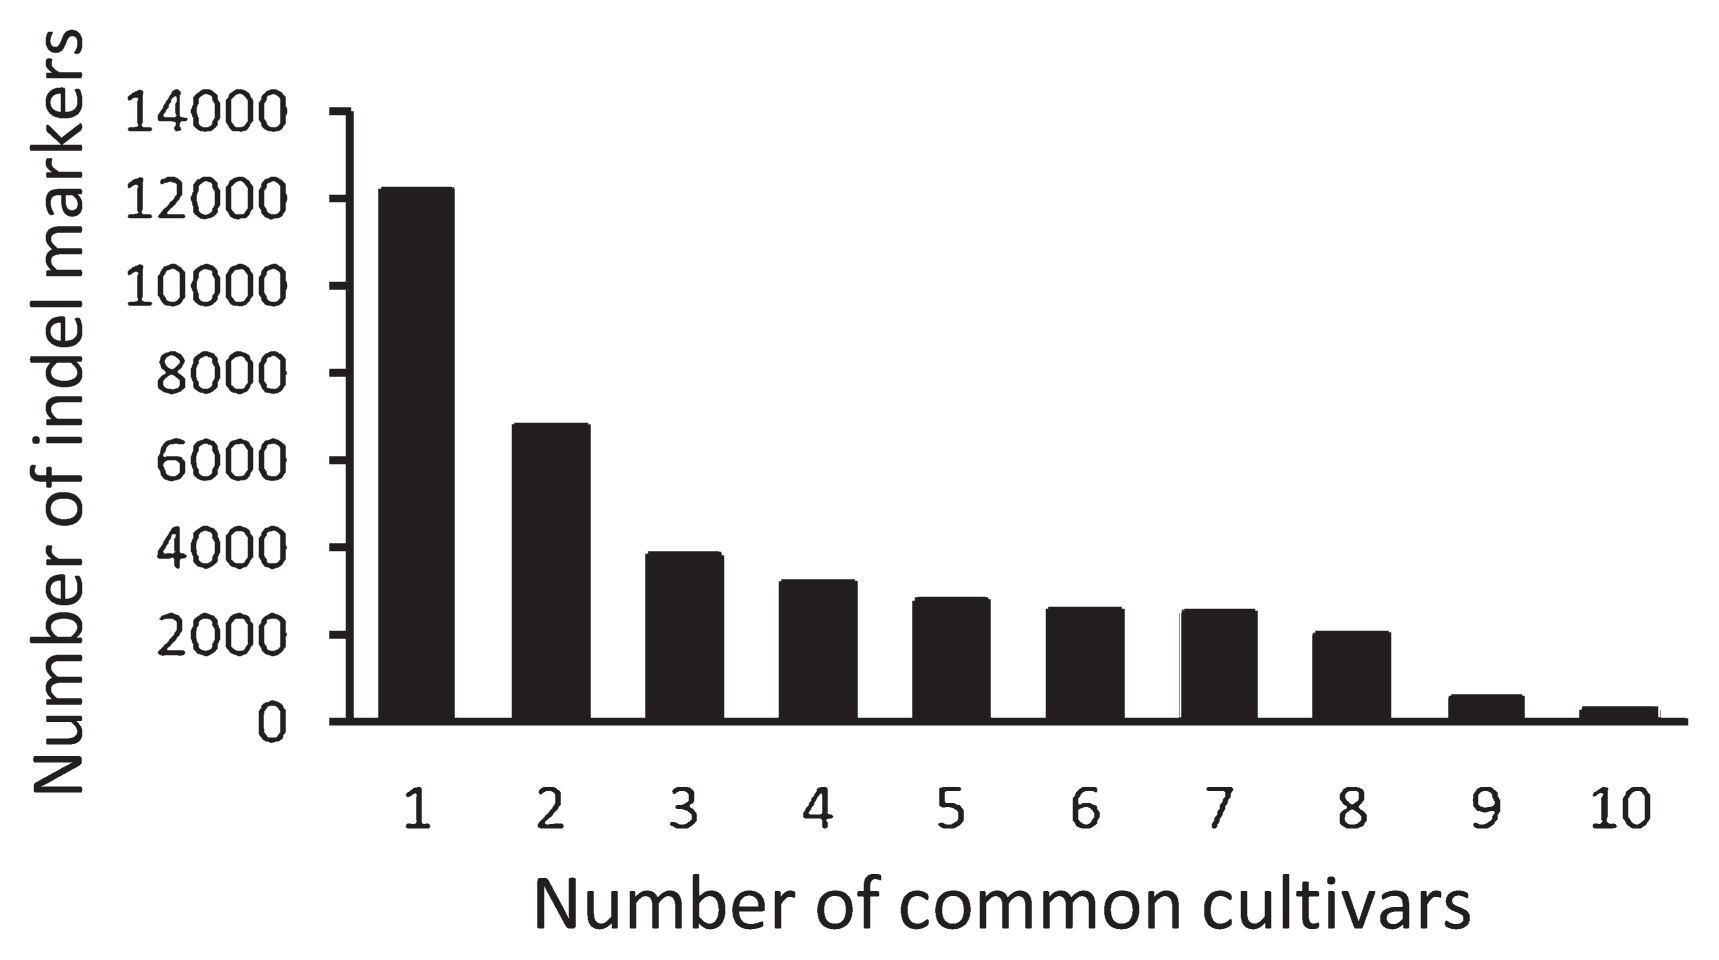
As a result of designing primers, about half of the indel regions were eliminated. Few indel markers were detected between ‘Koshihikari’ and ‘Nipponbare’ (752 markers), so the removal of these markers did not greatly influence the number of indel markers. In total, we selected 121,248 indel markers (with redundancy) and 36,766 indel markers (without redundancy) for the 10 other cultivars (i.e., non-’Koshihikari’ cultivars). In terms of marker efficiency, the available markers to detect indels that were common to all 10 cultivars but not ‘Koshihikari’ were effective but few (283 markers, Fig. 1). The largest number was observed for solitary indel regions, which represent indel markers common to ‘Koshihikari’ and only one other cultivar (12,198 markers). The number of indel markers decreased as the number of cultivars sharing the same primer sequences (termed here “common cultivars”) increased (Fig. 1).
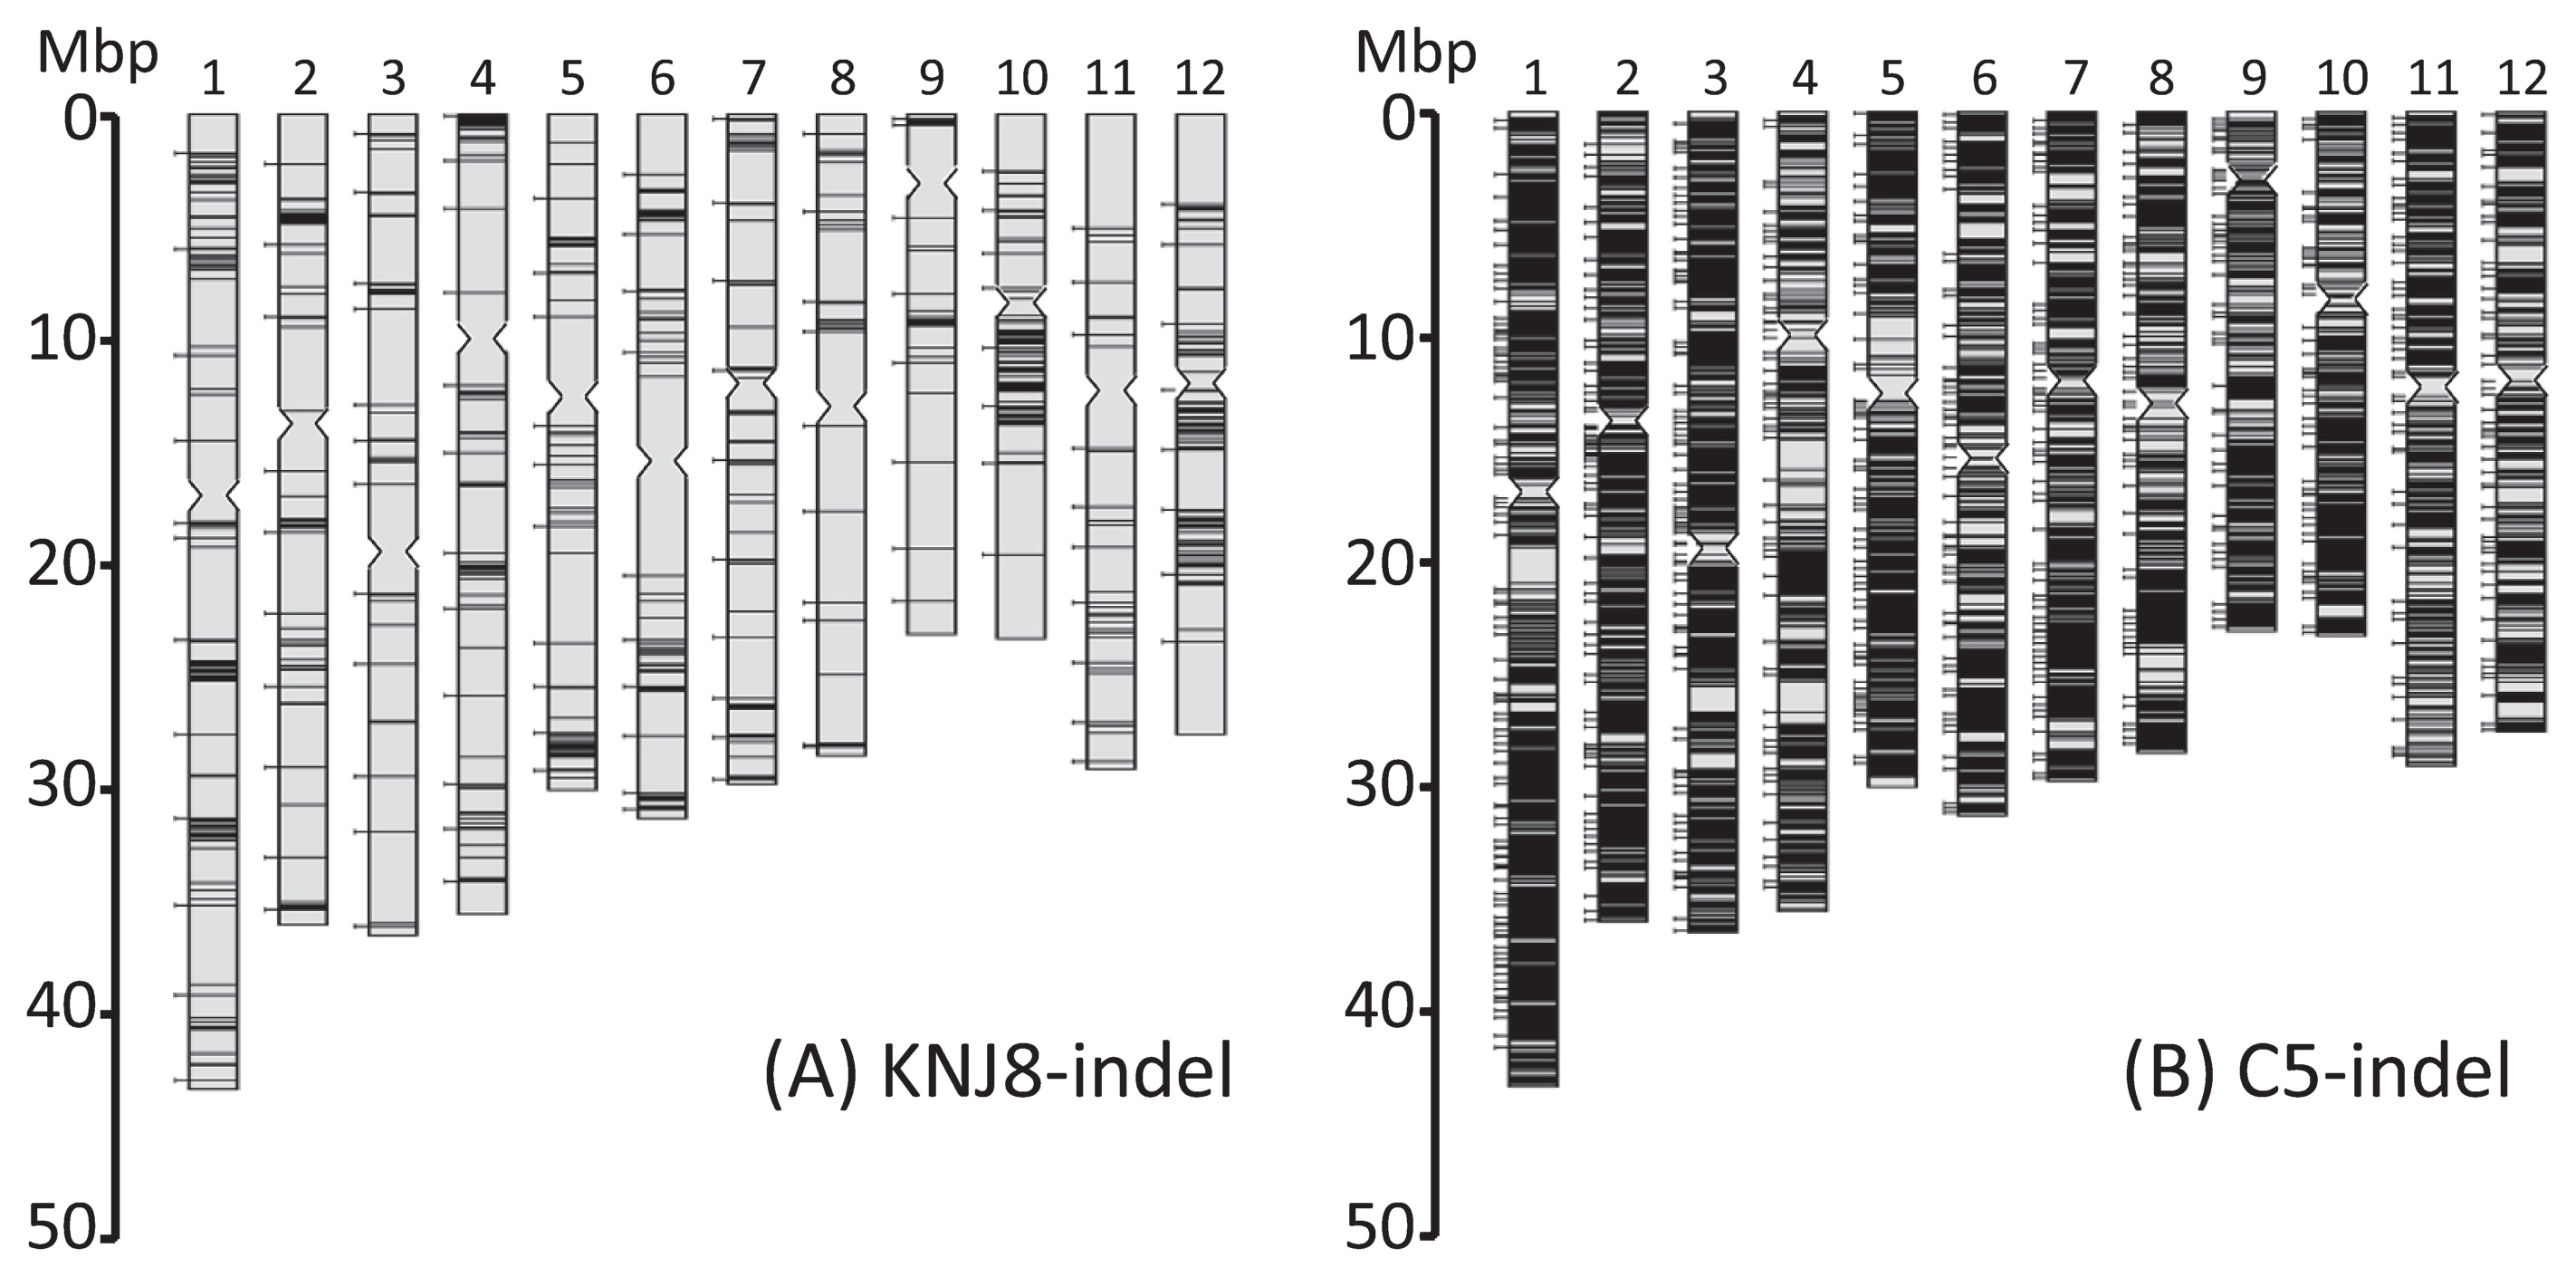
The KNJ8-indel markers had an uneven distribution within the rice genome (Fig. 2A). In particular, markers were scarce in the long arm of chromosome 8, and in the short arms of chromosomes 11 and 12. In contrast, the C5-indel set was distributed more evenly throughout the rice genome (Fig. 2B).
Experimental validation of the two indel marker sets
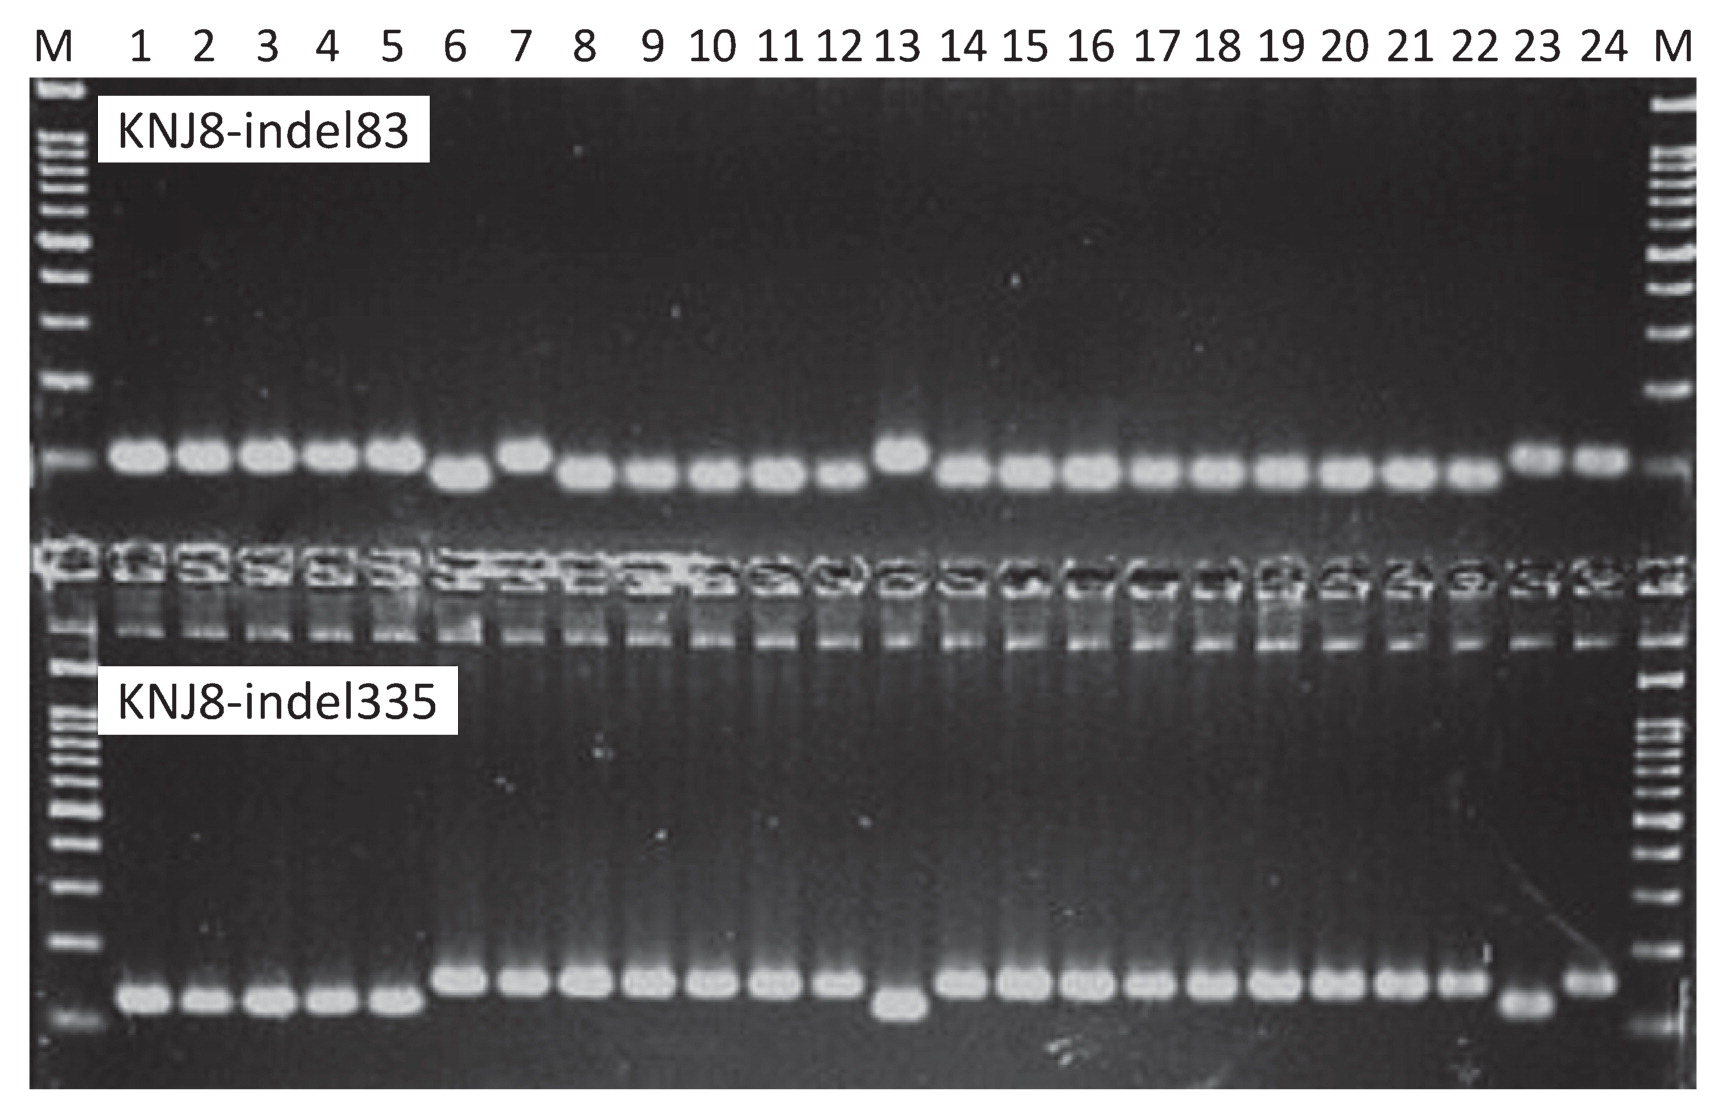
As an example of validation, clear single bands were detected around the expected PCR product sizes for two markers in the KNJ8-indel set: KNJ8-indel83 and KNJ8-indel335. The size differences between the amplified fragments could be discriminated among the 23 cultivars (Fig. 3). We used these categories to genotype all markers for the validation sets for the KNJ8-indel and C5-indel markers; the resulting data are presented in Supplemental Tables 4, 5, respectively.
The availability of two sets of indel marker in different cross combination types of cultivar groups is summarized in Table 4. The percentages of the markers with a success rate of 95% or more for PCR were 83.3% and 73.9% in the KNJ8-indel and C5-indel marker sets, respectively. The percentage for the KNJ8-indel set with different genotypes between ‘Nipponbare’ and ‘Koshihikari’ (9.2%) showed a similar percentage with that of the C5-indel set (12.5%). A polymorphism between ‘Nipponbare’ and ‘Khao Nam Jen’ could be detected for 78.3% of the markers in the KNJ8- indel set, whereas the C5-indel set had a lower percentage of different alleles (11.3%) than in the KNJ8-indel set. A similar difference was observed for ‘Nipponbare’ vs. tropical japonica (60.8% for KNJ8-indel versus 10.6% for C5-indel). The KNJ8-indel and C5-indel sets had more similar percentages of polymorphisms (81.7% and 62.9%, respectively) for ‘Nipponbare’ vs. aus than those for ‘Nipponbare’ vs. tropical japonica. In ‘Nipponbare’ vs. indica, relatively high percentages of polymorphisms were observed in both marker sets (85.8% for KNJ8-indel versus 74.9% for C5-indel). A comprehensiveness index (CI), an index of the availability of markers for detection of allelic polymorphisms between the Japanese rice cultivars belonging to the temperate japonica group and cultivars belonging to other cultivar groups, showed that the KNJ8-indel set had higher availability (45.8%) than the C5-indel set (7.0%).
Table 4
Summary statistics for the validation of the two indel marker sets. Values in brackets represent the percentage (%) of the total
|
Success rate (>95%)a |
‘Nipponbare’ vs ‘Koshihikari’b |
‘Nipponbare’ vs ‘Khao Nam Jen’c |
‘Nipponbare’ vs tropical japonicad |
‘Nipponbare’ vs ause |
‘Nipponbare’ vs indicaf |
CIg |
| KNJ8-indel |
100 (83.3) |
11 (9.2) |
94 (78.3) |
73 (60.8) |
98 (81.7) |
103 (85.8) |
55 (45.8) |
| C5-indel |
580 (73.9) |
98 (12.5) |
89 (11.3) |
83 (10.6) |
494 (62.9) |
588 (74.9) |
55 (7.0) |
a The number and percentage of markers with a PCR success rate of 95% or more (i.e., PCR without null or multiple bands).
b The number and percentage of markers showing different genotypes between ‘Nipponbare’ and ‘Koshihikari’.
c The number and percentage of markers showing different genotypes between ‘Nipponbare’ and ‘Khao Nam Jen’.
d The number and percentage of markers showing different genotypes between ‘Nipponbare’ and three or more of the six
tropical japonica cultivars.
e The number and percentage of markers showing different genotypes between ‘Nipponbare’ and two or more of the three cultivars of the three
aus cultivars.
f The number and percentage of markers showing different genotypes between ‘Nipponbare’ and five or more of the 10
indica cultivars.
g The comprehensiveness index (CI) of the KNJ8-indel and C5-indel markers requires that the conditions in footnotes
a,
c–
f, and
d–
f be satisfied and that there is the same genotype between ‘Nipponbare’ and ‘Koshihikari’.
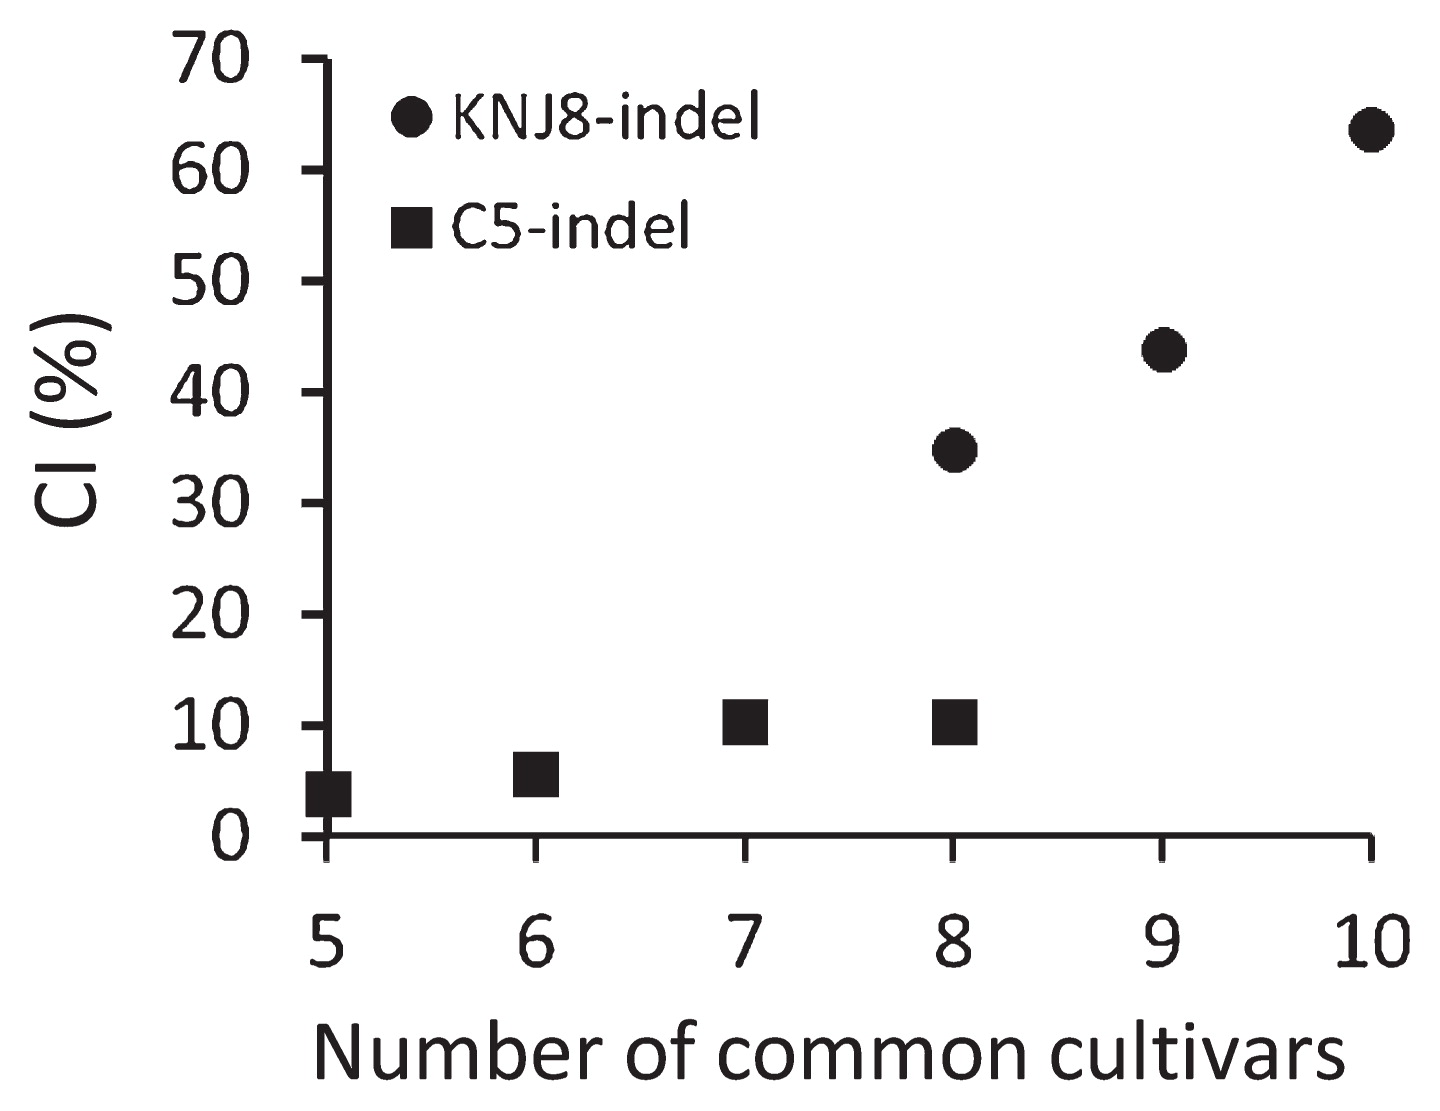
The relationships between the CI of the indel markers and the number of common cultivars are illustrated in Fig. 4. The CI of the C5-indel set, for the five to eight common cultivars, ranged from 3.8 to 10.4%. The CI of the KNJ8-indel set was higher, with values of 34.8%, 43.9%, and 63.6% for 8, 9, and 10 common cultivars, respectively. The chi-square test for differences in CI values among the various numbers of common cultivars was significant for both marker groups (both P < 0.05).
Discussion
When detecting nucleotide polymorphisms, including indels, by using a re-sequencing strategy with NGS, high accuracy depends on the precision of the reference genome. Fortunately, in the rice genome project, the Sanger sequencing method was used to sequence a minimum set of genome segments across the entire ‘Nipponbare’ genome and then precise reference sequences were established (International Rice Genome Sequencing Project 2005). For re-sequencing with short reads, the sequencing depth affects the accuracy of polymorphism detection. Although both the sequencing read length and the number of end sequences (single-end or paired-end) were different from those in our study, sequencing depth reached a plateau of 15-fold in ‘Koshihikari’ in a previous study (Yamamoto et al. 2010). Here, the sequencing depth of the mapped sequences was at least 28.5-fold (Table 1), which is twice the average depth (~14-fold) achieved in the most current sequencing project, “The 3000 Rice Genomes Project” (The 3000 Rice Genomes Project 2014). The results of our study suggest that this sequencing depth is sufficient to accurately detect nucleotide polymorphisms. Indeed, it appears there is no relationship between the genome coverage and the sequencing depth of the 11 cultivars (Table 1). The differences in genome coverage among the 11 cultivars reflect their similarity to the ‘Nipponbare’ reference sequence, and this similarity was coincident with the genetic distance in the phylogenetic tree in other studies (Fukuoka et al. 2010, Kojima et al. 2005). Three cultivars, ‘Koshihikari’, ‘Khao Nam Jen’, and ‘Khau Mac Kho’, which belong to the japonica group (temperate and tropical japonica), showed higher coverage than the other cultivars, which belong to the aus and indica groups. ‘Basilanon’, which is a large genetic distance from other japonica cultivars, was intermediate in coverage between japonica and aus or indica. As expected, the number of polymorphic sites (SNPs and indels) in the genomes of the 11 cultivars showed the opposite trend to the genome coverage of them (Table 1, Supplemental Table 3).
Because re-sequencing with short reads cannot physically detect indels that are longer than the reads themselves, we only found insertions and deletions of less than 35 bp and 92 bp, respectively (data not shown). Indels with a larger size (>100 bp) are undoubtedly located all over the genome. Copy number variations, which are defined as very large indels (>1 kb) (Feuk et al. 2006), have been found at high recombination positions and are thought to have been recently generated within breeding populations (Yu et al. 2013). The construction of pseudomolecule sequences of ‘Kasalath’ also uncovered 7,393 large indels (>100 bp) between ‘Kasalath’ and ‘Nipponbare’ (Sakai et al. 2014). The development of new sequencing technology, such as single-molecule, real-time sequencing technology, which allows us to read lengths of 5 kb or longer (Eid et al. 2009), will facilitate the detection of large indels and the establishment of indel markers at these regions.
Several systems have been used in other studies for the development of indel markers in rice: 4–40 bp indels in 120–480 bp PCR amplicons separated on 8% denaturing polyacrylamide gels (Zeng et al. 2013), 30–100 bp indels in 100–350 bp PCR amplicons separated on 3% agarose gels (Wu et al. 2013), and 51–2000 bp indels in PCR amplicons of up to ten times the size separated on 3% agarose gels (Yamaki et al. 2013). In the two latter cases, by using 3% agarose gels for the electrophoresis, indel size was set at 10% or more of the PCR amplicon size. Here, we found that indels of ≥10 bp in PCR amplicons of ~100 bp could be easily detected by separation on 3–4% agarose gels, and we designed the markers accordingly. Indeed, we observed a high PCR success rate for the two marker sets (Table 4), and the indel markers could be clearly used to discriminate allelic differences by electrophoresis.
As expected, there was a tendency toward increased CI as the number of cultivars sharing the markers increased in both sets of markers (Fig. 4, Table 4). For the C5-indel marker set, we observed 7.0% CI in the 785 validated markers, which corresponds to 693 markers in the total of 9,899 designed markers. There was an average of 548 kb between the designed markers, which is sufficient for the identification of rough map positions of QTLs detected between diverse Asian rice cultivars and Japanese rice cultivars.
To take advantage of successive introgression, backcross breeding has been widely used to improve elite Japanese cultivars. DNA markers greatly increase the efficiency of backcross breeding because they eliminate the need to wait for plants to reach maturity before they reveal favorable or unfavorable phenotypes (Fukuoka et al. 2009). The two indel marker sets established in our study are expected to help the introgression of the alleles derived from diverse rice cultivars into Japanese elite cultivars and to accelerate rice breeding in Japan.
Acknowledgments
This study was supported by grants from the “Genomics-based Technology for Agricultural Improvement” program (IVG2002 and IVG2003).
Literature Cited
- Appleby, N., D. Edwards and J. Batley (2009) New technologies for ultra-high throughput genotyping. In: Somers, D.J., P. Langridge and J.P. Gustafson (eds.) Methods in Molecular Biology, Plant Genomics, Humana Press, New York, pp. 19–39.
- Arai-Kichise, Y., Y. Shiwa, H. Nagasaki, K. Ebana, H. Yoshikawa, M. Yano and K. Wakasa (2011) Discovery of genome-wide DNA polymorphisms in a landrace cultivar of Japonica rice by whole-genome sequencing. Plant Cell Physiol. 52: 274–282.
- Arai-Kichise, Y., Y. Shiwa, K. Ebana, M. Shibata-Hatta, H. Yoshikawa, M. Yano and K. Wakasa (2014) Genome-wide DNA polymorphisms in seven rice cultivars of temperate and tropical japonica groups. PLoS ONE 9: e86312.
- DePristo, M.A., E. Banks, R. Poplin, K.V. Garimella, J.R. Maguire, C. Hartl, A.A. Philippakis, G. del Angel, M.A. Rivas, M. Hanna et al. (2011) A framework for variation discovery and genotyping using next-generation DNA sequencing data. Nat. Genet. 43: 491– 498.
- Eid, J., A. Fehr, J. Gray, K. Luong, J. Lyle, G. Otto, P. Peluso, D. Rank, P. Baybayan, B. Bettman et al. (2009) Real-time DNA sequencing from single polymerase molecules. Science 323: 133–138.
- Feuk, L., A.R. Carson and S.W. Scherer (2006) Structural variation in the human genome. Nat. Rev. Genet. 7: 85–97.
- Fukuoka, S., N. Saka, H. Koga, K. Ono, T. Shimizu, K. Ebana, N. Hayashi, A. Takahashi, H. Hirochika, K. Okuno et al. (2009) Loss of function of a proline-containing protein confers durable disease resistance in rice. Science 325: 998–1001.
- Fukuoka, S., Y. Nonoue and M. Yano (2010) Germplasm enhancement by developing advanced plant materials from diverse rice accessions. Breed. Sci. 60: 509–517.
- Hamajima, N. (2001) PCR-CTPP: a new genotyping technique in the era of genetic epidemiology. Expert Rev. Mol. Diagn. 1: 119–123.
- International Rice Genome Sequencing Project (2005) The map-based sequence of the rice genome. Nature 436: 793–800.
- Kawahara, Y., M. de la Bastide, J. Hamilton, H. Kanamori, W. McCombie, S. Ouyang, D. Schwartz, T. Tanaka, J. Wu, S. Zhou et al. (2013) Improvement of the Oryza sativa Nipponbare reference genome using next generation sequence and optical map data. Rice 6: 4.
- Kojima, Y., K. Ebana, S. Fukuoka, T. Nagamine and M. Kawase (2005) Development of an RFLP-based rice diversity research set of germplasm. Breed. Sci. 55: 431–440.
- Li, H. and R. Durbin (2009) Fast and accurate short read alignment with Burrows-Wheeler transform. Bioinformatics 25: 1754–1760.
- Li, H., B. Handsaker, A. Wysoker, T. Fennell, J. Ruan, N. Homer, G. Marth, G. Abecasis and R. Durbin (2009) The sequence alignment/map format and SAMtools. Bioinformatics 25: 2078–2079.
- Martin, M. (2011) Cutadapt removes adapter sequences from high-throughput sequencing reads. EMBnet.jour. 17: 1.
- McCouch, S.R., L. Teytelman, Y. Xu, K.B. Lobos, K. Clare, M. Walton, B. Fu, R. Maghirang, Z. Li, Y. Xing et al. (2002) Development and mapping of 2240 new SSR markers for rice (Oryza sativa L.). DNA Res 9: 199–207.
- Miura, K., M. Ashikari and M. Matsuoka (2011) The role of QTLs in the breeding of high-yielding rice. Trends Plant Sci. 16: 319–326.
- Murray, M.G. and W.F. Thompson (1980) Rapid isolation of high molecular weight plant DNA. Nucleic Acids Res. 8: 4321–4325.
- Nagasaki, H., K. Ebana, T. Shibaya, J.-i. Yonemaru and M. Yano (2010) Core single-nucleotide polymorphisms—a tool for genetic analysis of the Japanese rice population. Breed. Sci. 60: 648–655.
- Rozen, S. and H. Skaletsky (2000) Primer3 on the WWW for general users and for biologist programmers. In: Misener, S. and S.A. Krawetz (eds.) Methods Mol. Biol. 132, Humana Press Inc., Totowa, pp. 365–386.
- Sakai, H., S.S. Lee, T. Tanaka, H. Numa, J. Kim, Y. Kawahara, H. Wakimoto, C.C. Yang, M. Iwamoto, T. Abe et al. (2013) Rice Annotation Project Database (RAP-DB): An integrative and interactive database for rice genomics. Plant Cell Physiol. 54: e6.
- Sakai, H., H. Kanamori, Y. Arai-Kichise, M. Shibata-Hatta, K. Ebana, Y. Oono, K. Kurita, H. Fujisawa, S. Katagiri, Y. Mukai et al. (2014) Construction of pseudomolecule sequences of the aus rice cultivar Kasalath for comparative genomics of Asian cultivated rice. DNA Res. 21: 397–405.
- Shomura, A., T. Izawa, K. Ebana, T. Ebitani, H. Kanegae, S. Konishi and M. Yano (2008) Deletion in a gene associated with grain size increased yields during rice domestication. Nat. Genet. 40: 1023–1028.
- Spindel, J., M. Wright, C. Chen, J. Cobb, J. Gage, S. Harrington, M. Lorieux, N. Ahmadi and S. McCouch (2013) Bridging the genotyping gap: using genotyping by sequencing (GBS) to add high-density SNP markers and new value to traditional bi-parental mapping and breeding populations. Theor. Appl. Genet. 126: 2699– 2716.
- Takano, S., S. Matsuda, N. Kinoshita, N. Shimoda, T. Sato and K. Kato (2014) Genome-wide single nucleotide polymorphisms and insertion-deletions of Oryza sativa L. subsp. japonica cultivars grown near the northern limit of rice cultivation. Mol. Breed. 34: 1007–1021.
- The 3000 Rice Genomes Project (2014) The 3,000 rice genomes project. GigaScience 3: 7.
- Wu, D.-H., H.-P. Wu, C.-S. Wang, H.-Y. Tseng and K.-K. Hwu (2013) Genome-wide InDel marker system for application in rice breeding and mapping studies. Euphytica 192: 131–143.
- Yamaki, S., H. Ohyanagi, M. Yamasaki, M. Eiguchi, T. Miyabayashi, T. Kubo, N. Kurata and K. Nonomura (2013) Development of INDEL markers to discriminate all genome types rapidly in the genus Oryza. Breed. Sci. 63: 246–254.
- Yamamoto, T., J. Yonemaru and M. Yano (2009) Towards the understanding of complex traits in rice: Substantially or Superficially? DNA Res. 16: 141–154.
- Yamamoto, T., H. Nagasaki, J.I. Yonemaru, K. Ebana, M. Nakajima, T. Shibaya and M. Yano (2010) Fine definition of the pedigree haplotypes of closely related rice cultivars by means of genome-wide discovery of single-nucleotide polymorphisms. BMC Genomics 11: 267.
- Yonemaru, J.-i., T. Yamamoto, K. Ebana, E. Yamamoto, H. Nagasaki, T. Shibaya and M. Yano (2012) Genome-wide haplotype changes produced by artificial selection during modern rice breeding in Japan. PLoS ONE 7: e32982.
- Yonemaru, J.-i., R. Mizobuchi, H. Kato, T. Yamamoto, E. Yamamoto, K. Matsubara, H. Hirabayashi, Y. Takeuchi, H. Tsunematsu, T. Ishii et al. (2014) Genomic regions involved in yield potential detected by genome-wide association analysis in Japanese high-yielding rice cultivars. BMC Genomics 15: 346.
- Yu, P., C.-H. Wang, Q. Xu, Y. Feng, X.-P. Yuan, H.-Y. Yu, Y.-P. Wang, S.-X. Tang and X. -H (2013) Genome-wide copy number variations in Oryza sativa L. BMC Genomics 14: 649.
- Zeng, Y.X., Z.H. Wen, L.Y. Ma, Z.J. Ji, X.M. Li and C.D. Yang (2013) Development of 1047 insertion-deletion markers for rice genetic studies and breeding. Genet. Mol. Res. 12: 5226–5235.