Abstract
The genetic diversity of 175 rice accessions from Myanmar, including landraces and improved types from upland and lowland ecosystems in five different areas—Western (hilly), Northern (mountainous), North and South-eastern (plateau), and Southern (plain)—was evaluated on the basis of polymorphism data for 65 DNA markers and phenol reactions. On the basis of the DNA polymorphism data, high genetic diversity was confirmed to conserve in the accessions from each ecosystem and area. And the accessions were classified into two cluster groups I and II, which corresponded to Indica Group and Japonica Group, respectively. Cluster group I accessions were distributed mainly in upland ecosystems; group II were distributed in lowland in the Southern area, and the distributions of dominant groups differed among areas. Rice germplasm in Myanmar has maintained high genetic diversity among ecosystems and areas. This information will be used for advanced studies in germplasm and rice breeding in Myanmar.
Introduction
The centers of origin of cultivated rice are located in a wide region including the Ganges plains, northern Myanmar, northern Thailand, Laos, northern Vietnam, and southwest and southern China (Chang 1976, Matsuo 1997). Asian cultivated rice (Oryza sativa L.) has been suggested to have a polyphyletic origin (Agrawal 2003), in which two distinct Groups, Indica and Japonica, were domesticated in the southeast part of South Asia and southern China, respectively (Huang et al. 2012). Lying between these two regions, Myanmar is a region of high genetic diversity in rice (Khin Myo Myint et al. 2012). Nakagahra and Hayashi (1977) and Nakagahra (1978) suggested that the center of diversity of Asian rice was located in mountainous regions in the northern part of Southeast Asia, such as Myanmar, Thailand, and Yunnan in China. Among them, rice has been cultivated in the plains of Southern, plateau of Eastern, mountains in Northern and hilly of Western, and some rice cultivars in Myanmar were adapted to ecosystems with rainfed and irrigated-paddy cultivation, and others to upland conditions, including hillside slash-and-burn shifting culture, so that a very broad diversity of rice cultivars is available in the country (Khin Win 1991). As a cash crop with potential for export, rice is grown extensively in all regions of the country and under both lowland and upland conditions, and Myanmar has seen tremendous growth in rice exports.
Around 7,000 accessions are kept in the Seed Bank at the Department of Agricultural Research, Ministry of Agriculture, Livestock and Irrigation (MoALI), Yezin, Myanmar. Subsets of the accessions are also maintained at the Genetic Resources Center of National Agriculture and Food Research Organization (NARO), Japan, and at the International Rice Research Institute (IRRI), the Philippines. Ye Tint Tun et al. (2006) indicated that the high genetic diversity could be seen in the materials grown on farms in Myanmar. Yamanaka et al. (2011) also found that many ethnic groups still maintained their preferred landraces, as a good example of on-farm conservation of genetic diversity in Myanmar.
In an analysis of esterase isozymes in rice, the highest genetic diversity was reported in areas covering from Myanmar, Thailand, Laos, and Yunnan, China (Nakagahra 1984). Shatta et al. (1993) analyzed the isozyme patterns of 1,582 rice accessions from Myanmar, following the classification system of Glaszmann (1987). They categorized 85.9% of the accessions into isozyme group I (corresponded to Indica Group), 3.4% into group V, 1.6% into group VI (correspond to Japonica Group), and 1.1% into group II. The remaining 8% could not be classified into any group, suggesting that these accessions were derived from hybridization among different varietal groups. Khin Aye et al. (2004) investigated around 1,000 rice accessions in Myanmar for diversity and distribution on the basis of phenol reactions, amylose content, alkali tests, and five grain traits (aroma, 1,000-grain weight, grain length, grain width, and length-to-width ratio). They found that 87.4% of accessions were Indica Group and 12.6% were Japonica Group. The variation in agronomic traits, genetic diversity, and presence of both Indica and Japonica Groups demonstrated that Myanmar was extremely rich in rice genetic resources. Wunna et al. (2015) surveyed cultivar used on hillsides, focusing on upland rice cultivation, and determined by sequence analysis of a dehydrin gene (OsLEA27). And they found a different sequence of the entire OsLEA27 in the accessions collected from Northern Myanmar, and estimating a recent increase in population size or selection pressure in this region.
Kono et al. (2000) investigated DNA polymorphism among 15 Japonica Group accessions (10 landraces and 5 improved cultivars) by using restriction fragment length polymorphism (RFLP), random amplified polymorphic DNAs, amplified fragment length polymorphism, and simple sequence repeat (SSR) markers. The results indicated that the use of RFLP and SSR markers could facilitate the genetic analysis of temperate Japonica Group accessions. Using polymorphism analysis with microsatellite (SSR) markers, Okoshi et al. (2004) classified 73 Japanese landraces into two major groups, Indica and Japonica Groups, and into upland rice and paddy rice subgroups. Yamasaki and Ideta (2013) also analyzed 94 improved cultivars and 20 landraces, and detected a total of 706 alleles by the use of 134 SSR markers. The landraces had greater genetic diversity than the improved cultivars. Similarly, Kawasaki-Tanaka and Fukuta (2014) investigated the polymorphism of 324 Japanese rice accessions using 65 SSR markers distributed across the 12 rice chromosomes, and these were classified into Indica and Japonica Groups, and irrigated lowland and upland accessions. Thus, polymorphism data obtained by using DNA markers such as SSR markers is useful for discriminating between upland and irrigated lowland accessions, between Japonica and Indica Groups, and between landraces and improved cultivars. Ohm Mar Saw et al. (2006) also evaluated the genetic diversity of cultivated rice accessions from Myanmar by DNA markers including 12 RFLP markers, 6 sequence-tagged site (STS) markers, and 28 cleaved amplified polymorphic sequence (CAPS) markers. The materials included 110 accessions from six regions of Myanmar and 17 accessions from other countries. Most accessions from Myanmar were categorized into the Indica Group; the Japonica Group accessions were much less common. Many rice accessions have been collected and conserved at the Seed Banks in Myanmar, NIAS, Japan and IRRI, of which genetic characterization have been tried. But these were not systematic and the collected information was limited.
Studies of genetic diversity of rice germplasm in Myanmar have been based on patterns of isozyme or DNA marker polymorphism. These reports indicated that high diversity had been maintained in the rice germplasm, and that Indica Group cultivars were much more prevalent than Japonica Group (Khin Aye et al. 2004, Ohm Mar Saw et al. 2006, Shatta et al. 1993, Ye Tint Tun et al. 2006). However, as Myanmar has become a rice-exporting country, rice cultivation practices have been changing from traditional farms to modern systems intended for cash crop production. The genetic diversity in cultivated rice by using variations in DNA marker polymorphism was clarified to understand the present genetic diversity in Myanmar as the first step in this study.
Materials and Methods
Plant materials
We used 175 accessions from upland and lowland ecosystems in five areas of Myanmar: Western (Chin state and Magway region: Hilly), Northern (Kachin state and Sagaing region: Mountainous), Southern (Mon state, and Ayeyarwady and Bago regions, Yangon region: Plains), and Northeastern (north Shan state and Mandalay region: Plateau) and Southeastern (south Shanstate: Plateau), in this study. Among them, 101 upland accessions (93 landraces and 8 improved cultivars) from the four upland areas; Western, Northern, North and South-eastern, were provided by the Seed Bank, Department of Agricultural Research, Ministry of Agriculture, Livestock and Irrigation (MoALI) located at in Yezin. The 74 lowland accessions (60 landraces and 14 improved cultivars) were collected from the delta and lowland plains in the Southern area and conserved by the Plant Biotechnology Center (PBC), Yangon, Myanmar. The local cultivars which have been maintained by farmer in each area were categorized as landrace, and cultivars imported from China, Malaysia and International Rice Research Institute (IRRI), and developed by cross breeding using these materials, and selected or induced by mutation breeding were as improved type.
Phenol reaction
In determining the differentiation between Indica and Japonica Groups, we investigated the phenol reaction of rice grain suggested by Walls (1965). Two replicates of 5 seeds each were soaked in distilled water for 18 h. And then phenol solution (2%) was added and kept at room temperature (28°C). After 24 h, the seeds were scored for positive (black) and negative (no change) staining reactions by eye. Indica Group cultivars tended to show a positive reaction and Japonica Group cultivars show a negative reaction (Walls 1965).
Genomic composition based on SSR polymorphism data
We investigated polymorphism at 65 SSR marker loci distributed across the 12 chromosomes in all accessions and two control cultivars: Kasalath (Indica Group control) and Nipponbare (Japonica Group control). We used the same set of SSR markers that was used for the classification of Japanese germplasm by Kawasaki-Tanaka and Fukuta (2014).
Whole genomic DNA was extracted from a young leaf (around 1 cm2) in each accession. Leaf tissue was ground in 100 μl of 0.25 N NaOH with zirconium beads in 2.0-ml tubes. A volume of 400 μl of 100 mM Tris-HCl (pH 7.5) was added to each tube. The sample was then mixed and centrifuged for 10 min at 10,000 rpm. The supernatant was poured into a fresh 1.5-ml tube. PCR was performed in a 10-μl PCR mixture containing 1 μl sterile H2O, a total of 1.5 μl forward primer (2 μM) and reverse primer (2 μM), 7.5 μl of 2× Quick Taq HS DyeMix (Toyobo Co., Ltd.), and 5 μl DNA concentrated to about 5 to 10 ng/μl. PCR amplification was performed with the following profile: 94°C for 2 min, 40 cycles of 30 s at 94°C, 30 s at 55°C, and 1 min at 68°C. To detect polymorphism, the amplified products were separated by electrophoresis on 2% agarose gels in 1× TAE buffer at 150 V for 90 to 120 min, and the DNA fragment was detected with ethidium bromide. The extracted data were exported as allele and formatted for further statistical analysis.
We calculated gene diversity, number of alleles per locus, expected heterozygosity, and polymorphic information content (PIC), as measures of diversity among the 175 accessions at each SSR locus, as well as Nei’s genetic distances (Nei et al. 1983) and an Unweighted Pair Groups Method with Arithmetic Means (UPGMA) tree, in Power Marker v. 3.0 software (Liu and Muse 2005). A UPGMA tree was constructed in Mega v. 6.0 software. GenAlEx v. 6.5 software (Peakall and Smouse 2006) was used to perform principal coordinates analysis (PCoA) based on the matrix of Nei’s genetic distance.
Results
Genetic diversity of rice accessions based on polymorphism of SSR markers
We tested 67 microsatellite primers (SSR markers), of which 65 showed polymorphism in the accessions used in this study. The number of alleles per locus detected by microsatellite primers varied from 2 to 15, with an average of 6.4 alleles per locus, and a total of 414 bands were found across all SSR markers and rice accessions used (Supplemental Table 1).
These polymorphism data were used for cluster analysis (UPGMA), which identified two major cluster groups, designated I and II (Supplemental Fig. 1). In the PCoA, principal coordinates 1 and 2 accounted for 45.4% and 16.4%, respectively, of the total variance. Similar to the results obtained with the UPGMA tree, the principal coordinates plot revealed two clusters (groups I and II) on the PC1 axis (Fig. 1). Cluster group I contained 85 accessions (48.6 % in total), mainly from upland ecosystems and including the Indica Group control, Kasalath, almost all of which showed a positive reaction to phenol. In contrast, cluster group II contained 90 accessions (51.4% in total) and including the irrigated lowland and Japonica Group control, Nipponbare, mainly from the lowland ecosystem, and almost all accessions showed a negative reaction to phenol. These results indicate that cluster group I which included many upland accessions corresponded to Indica Group, and group II which included many lowland accessions corresponded to Japonica Group. There was no significant difference in gene diversity between cluster groups I and II (Table 1), indicating that the levels of genetic diversity within the Indica and Japonica Groups’ accessions in Myanmar were relatively similar. A total of 12 lowland accessions in cluster group II showed positive phenol reactions and one upland accession in group I had a negative reaction (Fig. 1, Supplemental Fig. 1). And these accessions harbored introgressions from Japonica Group rice in the genetic backgrounds of group I, and vice versa (data not shown). These results indicate that these accessions have complex genomes representing a combination between Indica and Japonica Groups’ rice.
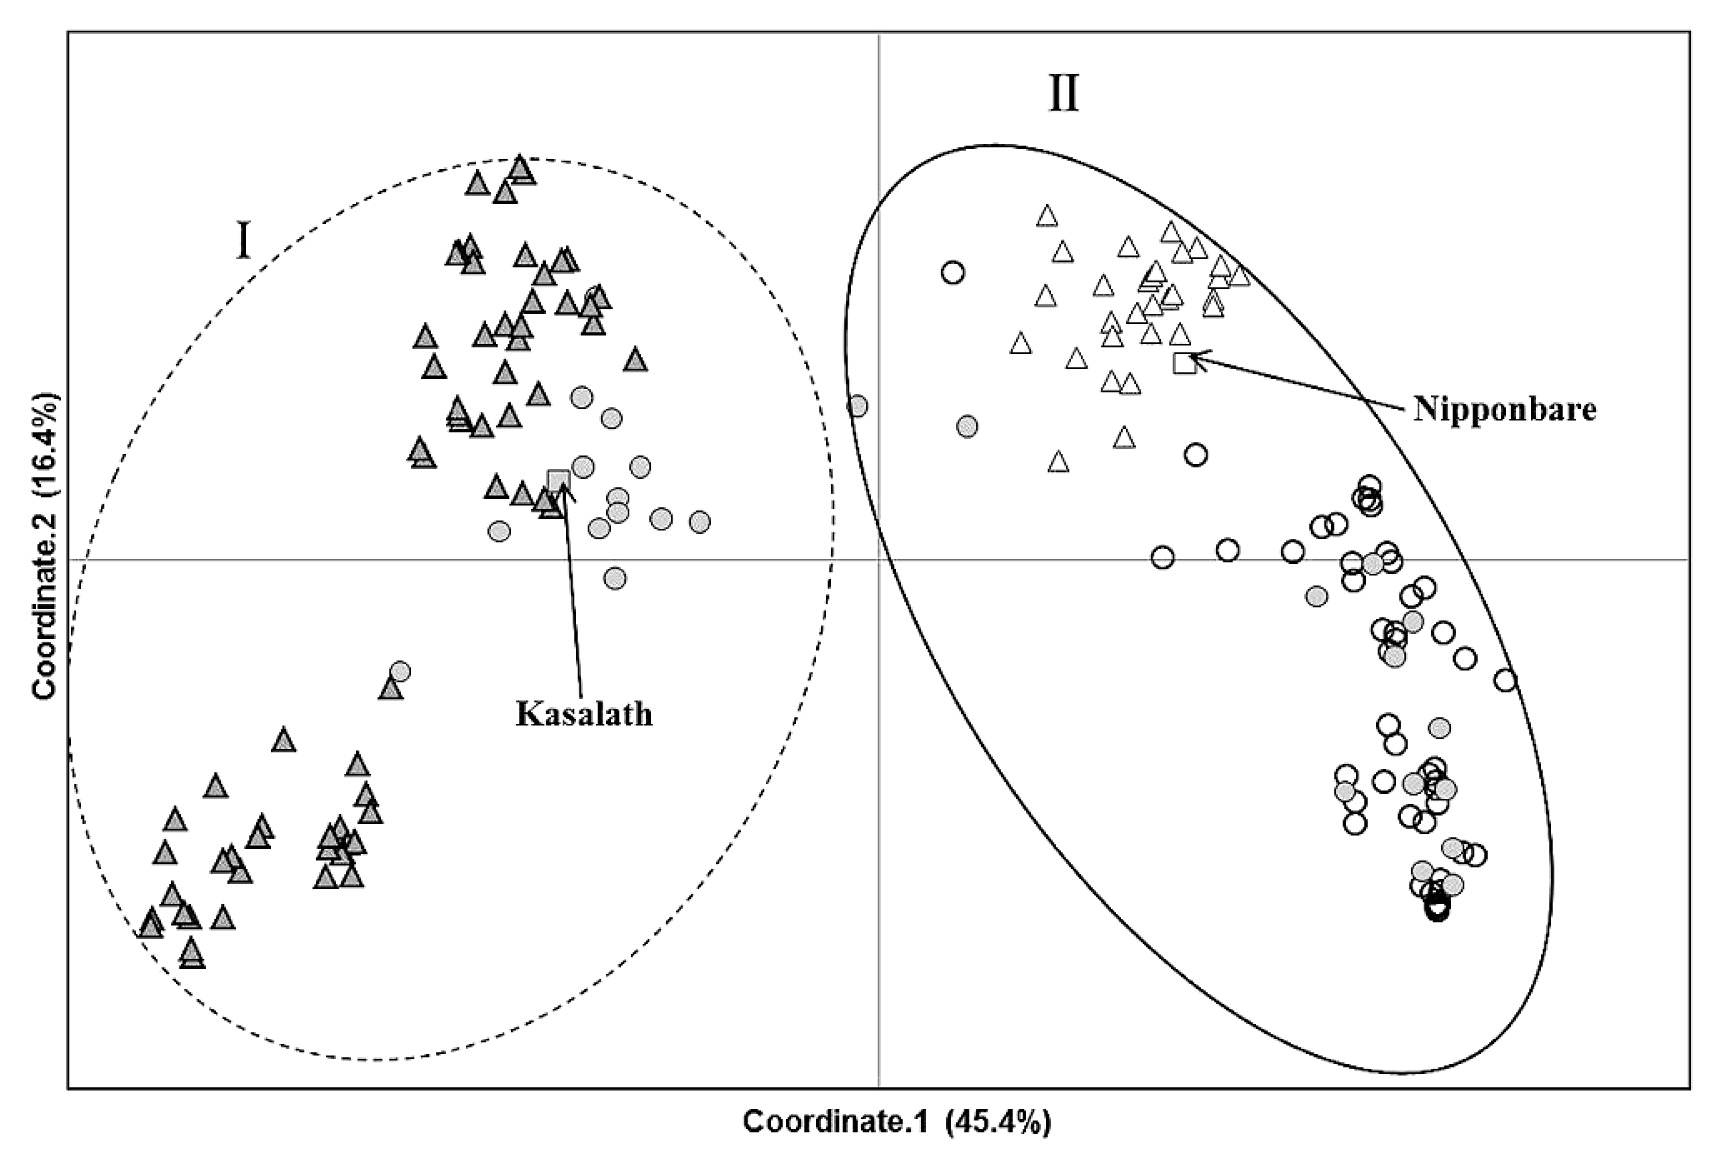
Table 1
Genetic diversity in groups based on SSR marker polymorphism
| Cluster group |
No. of accessions (%) |
No. alleles |
Gene diversity |
Expected heterozygosity |
Percentage polymorphic % |
PIC |
| I |
85 (48.6) |
10 |
0.79 |
0.58 |
96.0 |
0.76 |
| II |
90 (51.4) |
10 |
0.78 |
0.55 |
96.0 |
0.74 |
| Total |
175 (100.0) |
13 |
0.84 |
0.69 |
100.0 |
0.82 |
PIC = polymorphic information content.
Sixty eight accessions (38.9% of all cultivars) and 32 (18.3%) were classified into cluster groups I and II, respectively, in the upland, but among the lowland accessions, 15 (8.6%) and 52 (29.7%) were respectively classified (Table 2, Fig. 2). Among five regions, cluster group I were dominant in three areas, Western, Northern and Southeastern, and cluster group II were in Northeastern and Southern. These results indicate that cluster group I and II were basically dominant in the upland and lowland ecosystems, respectively, expect for Northeastern area.
Table 2
Relationships among groups, areas, and rice cultivation ecosystems
| Eco-system |
Landrace or improved |
Area |
No. of accessions (%) |
| Group I |
Group II |
Total |
| Upland |
Landrace |
Northern |
16 (9.1) |
2 (1.1) |
18 (10.3) |
| Western |
11 (6.3) |
1 (0.6) |
12 (6.9) |
| Southeastern |
29 (16.6) |
4 (2.3) |
33 (18.9) |
| Northeastern |
12 (6.9) |
18 (10.3) |
30 (17.1) |
| Sum |
68 (38.9) |
25 (14.3) |
93 (53.1) |
| Improved |
Northeastern |
0 (0.0) |
7 (4.0) |
7 (4.0) |
| Subtotal |
68 (39.4) |
32 (18.3) |
100 (57.7) |
| Lowland |
Landrace |
Southern |
3 (1.7) |
50 (28.6) |
53 (30.3) |
| Improved |
Southern |
12 (6.6) |
2 (1.1) |
14 (8.0) |
| Subtotal |
15 (8.6) |
52 (29.7) |
67 (38.3) |
| Others |
| Upland |
Improved |
Unknown |
1 (0.6) |
0 (0.0) |
1 (0.6) |
| Lowland |
Landrace |
Unknown |
1 (0.6) |
6 (3.4) |
7 (4.0) |
| Subtotal |
2 (0.11) |
6 (3.4) |
8 (4.6) |
| Total |
|
|
85 (48.6) |
90 (51.4) |
175 (100.0) |
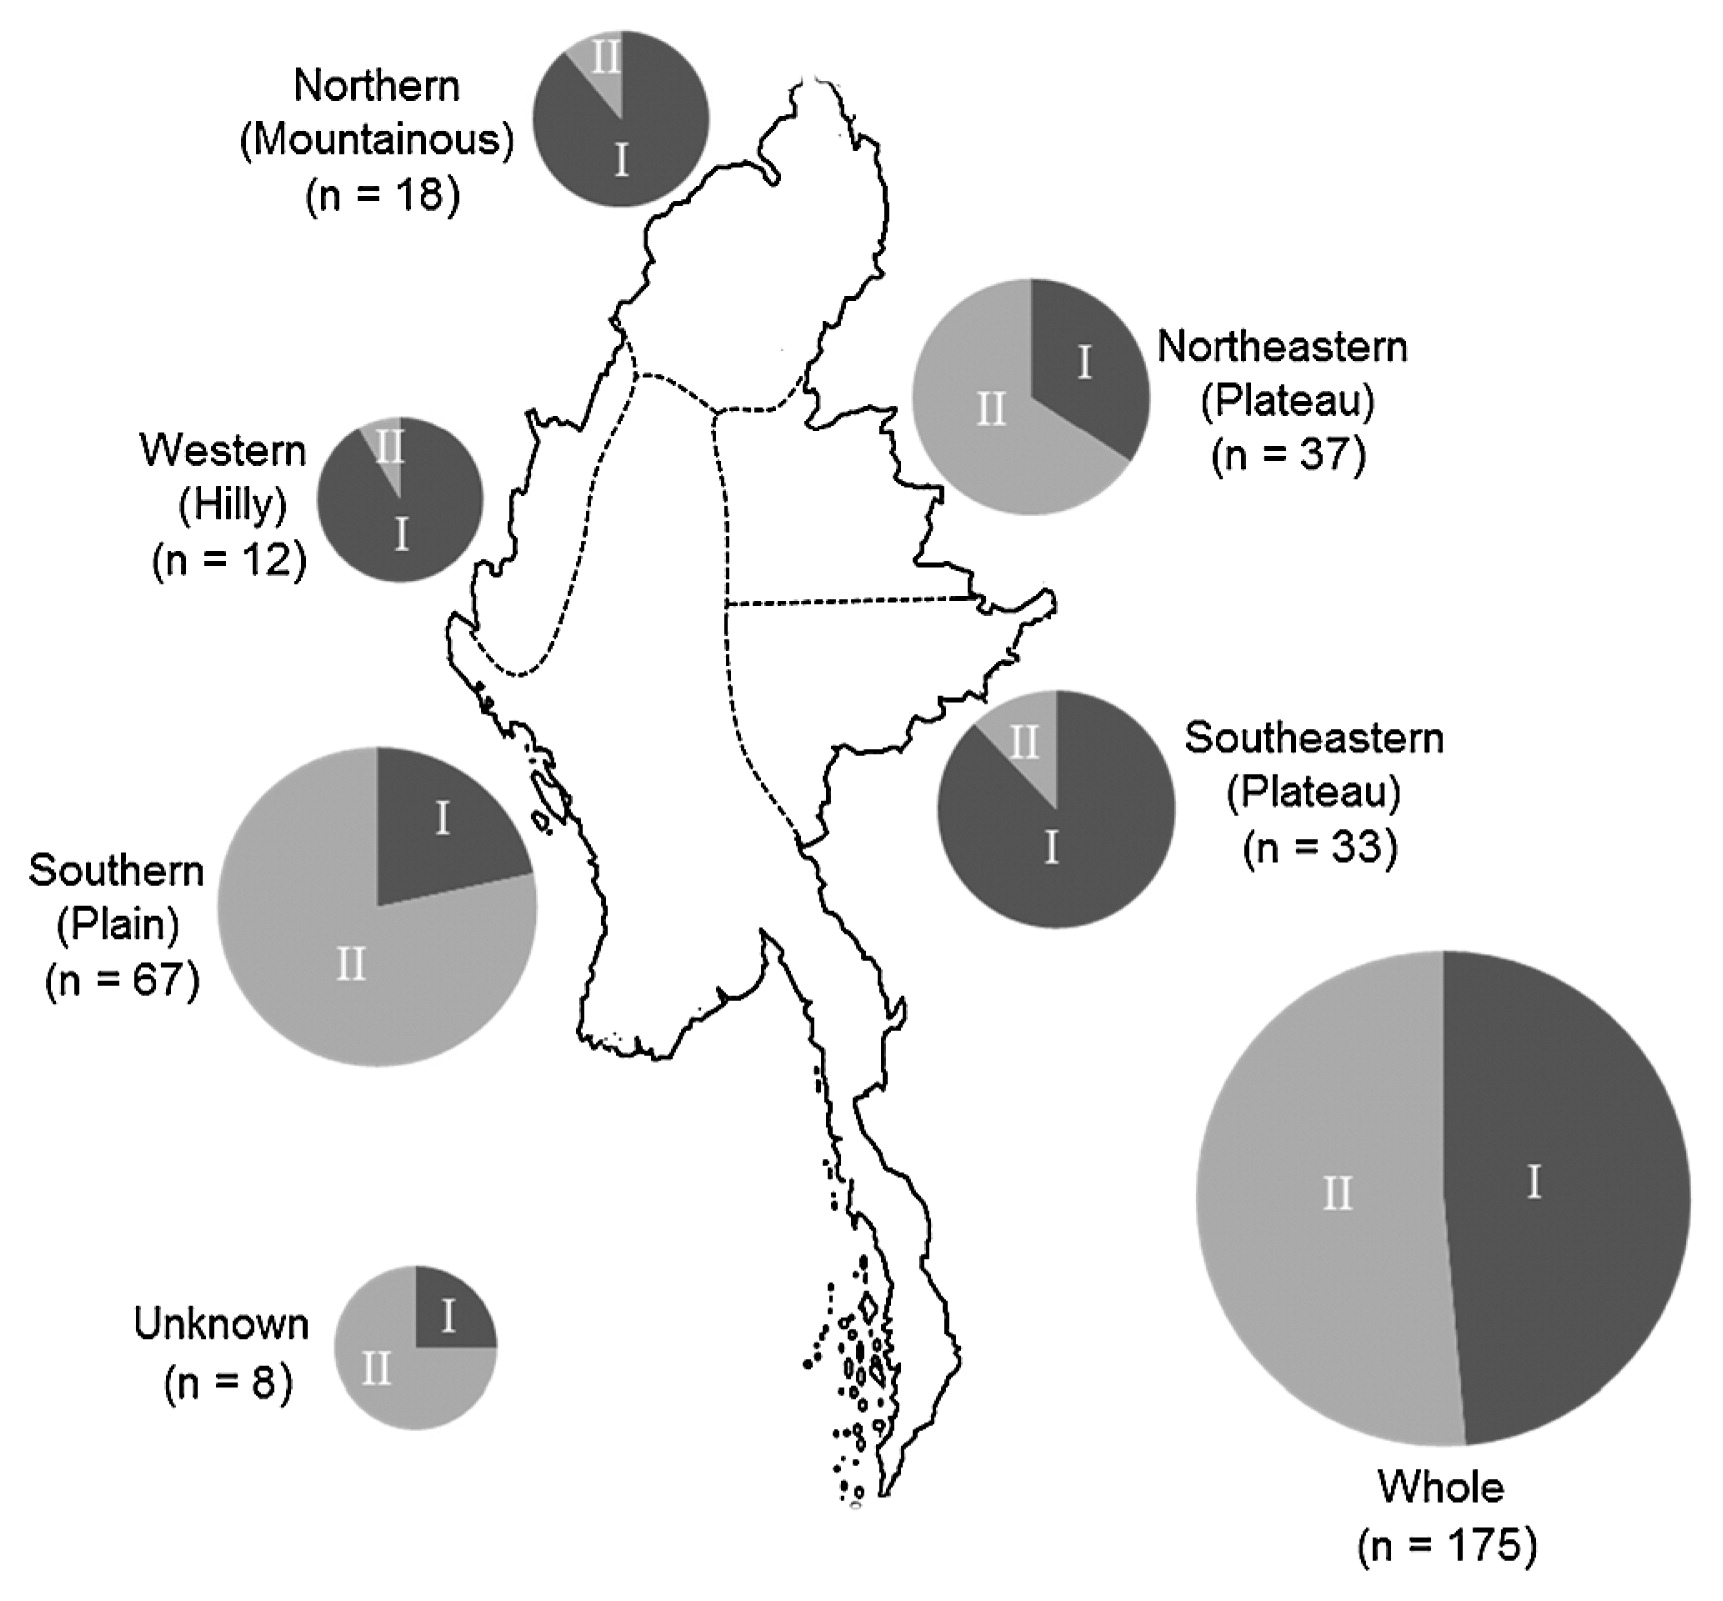
Rice cultivation in lowland is distributing mainly in the Southern area of Myanmar. In the lowland, 3 (1.7%) group I and 50 (28.6%) group II accessions were classified as landraces, and 12 (6.6%) group I and 2 (1.1%) group II accessions were classified as improved. Thus, in the Southern region, landraces were basically cultivated with improved types. Among the upland areas, the Northeastern area was the only one from which improved accessions were obtained. Among the five areas, Southern (lowland) and Northeastern (upland) were the only two represented by improved cultivars, which included mainly group I and group II, respectively.
These findings indicate that the lowland and uplands ecosystems are adapted in Southern area and the other four areas, respectively, and different types improved cultivars are introducing in Northeastern and Southern areas, and Northeastern areas were complete different from the other three areas of upland ecosystem.
Discussion
Nakagahra and Hayashi (1977) and Nakagahra (1978) suggested that the center of diversity of Asian rice was located in mountainous regions in the northern part of Southeast Asia, such as Myanmar, Thailand and Yunnan in China. Myanmar is located at the center of diversity for rice; in addition, it has heterogeneous geographical and ecological conditions such as hills and mountains. In particular, the mountainous regions in Myanmar are close to Assam, India, a hot-spot of genetic diversity of plants (Choudhury et al. 2014), and to Yunnan, China, where Japonica Group rice was domesticated (Huang et al. 2012). The present study clarified the genetic diversity of rice accessions from upland and lowland areas of five areas in Myanmar, assessed with SSR marker and phenol reactions. The SSR analysis of 175 accessions showed high genetic diversity (0.84), similar to that of the country-wide gene bank collection set (0.81) and the country-wide on-farm population set (0.83) investigated by Yamanaka et al. (2011). Wang et al. (2013) reported that the gene diversities varied from 0.46 to 0.53 among rice groups in Bangladesh based on the genotype data of 43 SSR makers. The value in Myanmar was higher than those of Bangladesh. Shatta et al. (1993), Khin Aye et al. (2004), and Saw et al. (2006) found high levels of genetic diversity conserved in rice accessions, and our results confirmed that high diversity of rice germplasm is still maintained in farmers’ fields in Myanmar.
Cluster analysis based on the polymorphism data from SSR markers and phenol reactions clearly differentiated the rice accessions into two groups I and II. Group I, with 85 accessions (48%), corresponded to Indica Group and was dominant in all upland regions except for the Northeastern. Group II, with 90 accessions (52%), corresponded to the Japonica Group and was dominant in the Southern (lowland) region. Through the analysis of isozyme patterns, Shatta et al. (1993) found that 85.9% of the rice germplasm in Myanmar belonged to the Indica Group, and Japonica Group accessions were infrequent. Through phenol reactions and alkaline tests, Khin Aye et al. (2004) similarly found that 87.4% of accessions were Indica Group, and 12.6% were Japonica Group. A possible cause for the apparent discrepancy between those studies and our results might be that we tested fewer accessions, and sampled more accessions from the Southern region, where lowland rice is grown.
The group I (correspond to Indica Group) accessions were dominant in the upland landraces of the Northern, Western, and Southeastern areas. Group II (correspond to Japonica Group) accessions were dominant in lowland landraces of the Southern and Northeastern areas. Thus, Indica Group’s accessions were generally grown in upland, and Japonica Group’s accessions are grown in lowland area of Myanmar. Indica and Japonica Groups’ cultivars are grown mainly in lowland and upland conditions, respectively (unpublished data) in the Philippines and Laos, and the situation of Myanmar was different from them.
Shatta et al. (1993) could not classify 8% of the rice germplasm in Myanmar into any isozyme group, and estimated that they had developed by hybridization among different varietal groups. Several rice accessions had complex genomes representing a combination between Indica and Japonica Groups’ cultivars in this study, and these results also suggested that the accessions in Myanmar were occurred by wide hybridization between Indica and Japonica Groups cross combinations and played a role in maintaining the high diversity of rice germplasm in this country.
We observed high levels of genetic diversity among upland and lowland accessions from five areas in Myanmar, through a combination of genome-wide SSR genotyping and conventional varietal group differentiation with phenol. Both upland and lowland landraces in Myanmar clustered into two major cluster groups corresponding to the Indica and Japonica Groups. In upland ecosystems, the cluster group I accessions were basically distributed among three of the four mountainous or plateau areas (i.e., all except the Northeastern). Cluster group II accessions were dominant in the Northeastern and Southern areas. In these two areas, improved cultivars have been introduced and grown alongside landraces, and the results were different from those in the other areas. Wunna et al. (2015) also indicated the modification of rice population in north area of Myanmar recently. The rice cultivation in Myanmar may be changed dramatically in the near future owing to the introduction of new cultivars as cash crops, which were found in Northeastern and Southern areas. The findings in this study will be useful for understanding the present situation of rice germplasm in Myanmar and its changes over time.
To understand the genetic diversity and variations of rice germplasm and apply the information and materials to rice breeding, the relationships among the differentiation of Indica and Japonica Groups’ accessions, and further data accumulations for agronomic traits, such as heading date, yield components, grain quality, resistance to disease and insects, and tolerance to abiotic stress, will need in Myanmar.
Acknowledgments
We thank the Department of Agriculture and Department of Agriculture Research, Ministry of Agriculture and Irrigation, Myanmar, for facilitating the research material transfer processes. We extend our appreciation to Plant Biotechnology Center lab members for data collection. This research was supported in part by Grant-in-Aid 25257416 from the Japanese Society for Promotion of Science (JSPS) and a JIRCAS research project, “Rice innovation for environmentally sustainable production systems”. The first author was supported by a Ministry of Education, Culture, Sports, Science and Technology (MEXT) scholarship.
Literature Cited
- Agrawal, P.K. (2003) Molecular approaches in evolutionary studies and speciation in genus Oryza—present status. In: Nanda, J.S. and S.D. Sharma (eds.) Monograph on Genus Oryza, Science Publishers, Inc. USA, pp. 139–170.
- Chang, T.T. (1976) The origin, evolution, cultivation, dissemination, and diversification of Asian and African rice. Euphytica 25: 425–441.
- Choudhury, D.R., N. Singh, A.K. Singh, S. Kumar, K. Srinivasan, R.K. Tyagi, A. Ahmad, N.K. Singh and R. Singh (2014) Analysis of genetic diversity and population structure of rice germplasm from North-Eastern region of India and development of a core germplasm set. PLoS ONE. 9: e113094.
- Glaszmann, J.C. (1987) Isozymes and classification of Asian rice varieties. Theor. Appl. Genet. 74: 21–30.
- Huang, X., N. Kurata, X. Wei, Z.X. Wang, A. Wang, Q. Zhao, Y. Zhao, K. Liu, W. Li, Y. Guo et al. (2012) A map of rice genome variation reveals the origin of cultivated rice. Nature 490: 497–501.
- Kawasaki-Tanaka, A. and Y. Fukuta (2014) Genetic variation in resistance to blast disease (Pyricularia oryzae Cavara) in Japanese rice (Oryza sativa L.), as determined using a differential system. Breed. Sci. 64: 183–192.
- Khin, Aye, K. Irie, L. Nang, Kha Yi, Yi Myint, Tin Htut and John Ba Maw (2004) Diversity and distribution of Myanmar rice germplasm for grain quality traits. Proceedings of the Annual Research Conference (Agricultural Sciences), Yangon, Myanmar. 10–12 December, 2003. pp. 1–19.
- Myint, Khin Myo, B. Courtois, A.M. Risterucci, J. Frouin, Khin Soe, Khin Maung Thet, A. Vanavichit and J.C. Glaszmann (2012) Specific patterns of genetic diversity among aromatic rice varieties in Myanmar. Rice 5: 20.
- Win, Khin (1991) A Century of Rice Production in Myanmar. International Rice Research Institute (IRRI), Los Banos, Philippines. 162 p.
- Kono, I., Y. Takeuchi, T. Shimano, T. Sasaki and M. Yano (2000) Comparison of efficiency of detecting polymorphism among japonica 192 varieties in rice using RFLP, RAPD, AFLP and SSR makers. Breed. Res. 2: 197–203.
- Liu, K. and S.V. Muse (2005) PowerMarker: integrated analysis environment for genetic marker analysis. Bioinformatics 21: 2128–2129.
- Matsuo, T. (1997) Origin and distribution of cultivated rice. In: Matsuo, T. et al. (eds.) “Science of the Rice Plant” Vol. 3 Genetics, Food and Agriculture Policy Research Center, Tokyo (Japan), pp. 69–88.
- Nakagahra, M. and K. Hayashi (1977) Origin of cultivated rice as detected by isozyme variations. Jpn. Agric. Res. Q. 11:1–5.
- Nakagahra, M. (1978) The differentiation, classification and center of genetic diversity of cultivated rice (Oryza sativa L.) by isozyme analysis. Trop. Agric. Res. Sci. 11: 77–82.
- Nakagahra, M. (1984) Geographical distribution of esterase genotypes of rice in Asia. Rice Genet. Newsl. 1: 118–120.
- Nei, M., F. Tajima and Y. Tatena (1983) Accuracy of estimated phylo-genetic trees from molecular data. J. Mol. Evol. 19: 153–170.
- Saw, Ohm Mar, K. Doi, Khin Aye, K. Irie and A. Yoshimura (2006) Genetic diversity of Myanmar rice cultivars detected by DNA markers. J. Fac. Agric. Kyushu Univ. 51: 181–187.
- Okoshi, M., J. Hu, R. Ishikawa and T. Fujimura (2004) Polymorphic analysis of landraces of Japanese rice using microsatellite markers. Breed. Res. 6: 125–133.
- Peakall, R. and P.E. Smouse (2006) GenAlEx 6: Genetic Analysis in Excel. Population genetic software for teaching and research. Mol. Ecol. Notes 6: 288–295.
- Shatta, A.M., B.G. de los Reyes, D.S. Brar and G.S. Khush (1993) Classification of Myanmar rice germplasm based on isozyme polymorphism. Rice Genet. Newsl. 10: 73.
- Walls, F.W. (1965) A standard phenol method for testing wheat for varietal purity. Hand Book of Seed Testing, AOSA, Contribution No. 28.
- Wang, M., Z. Zhu, L. Tan, F. Liu, Y. Fu, C. Sun and H. Cai (2013) Complexity of indica-japonica variental differentiation in Bangladesh rice landraces revealed by microsatellite markers. Breed. Sci. 63: 227–232.
- Wunna, , S.A. Gilani, M. Kawase, R. Ohsawa and K.N. Watanabe (2015) Tracking selection signatures based on variation in OsLEA27 within Myanmar landraces of upland and dryland rice. Am. J. Plant Sci. 6: 1937–1950.
- Yamanaka, S., S.A. Jatoi, San San Yi, S.L. Kothari, Tin Htut and K. Watanabe (2011) Genetic diversity of Myanmar rice and their implementation on management methods. Afr. J. Biotechnol. 10: 1290–1298.
- Yamasaki, M. and O. Ideta (2013) Population structure in Japanese rice population. Breed. Sci. 63: 49–57.
- Tun, Ye Tint, K. Irie, Than Sein, K. Shirata, H. Toyohara, F. Kikuchi and H. Fujimaki (2006) Diverse utilization of Myanmar rice with varied amylose contents. Jpn. J. Trop. Agr. 50: 42–50.
