Abstract
Seed size is one of the most important traits in leguminous crops. We obtained a recessive mutant of blackgram that had greatly enlarged leaves, stems and seeds. The mutant produced 100% bigger leaves, 50% more biomass and 70% larger seeds though it produced 40% less number of seeds. We designated the mutant as multiple-organ-gigantism (mog) and found the mog phenotype was due to increase in cell numbers but not in cell size. We also found the mog mutant showed a rippled leaf (rl) phenotype, which was probably caused by a pleiotropic effect of the mutation. We performed a map-based cloning and successfully identified an 8 bp deletion in the coding sequence of VmPPD gene, an orthologue of Arabidopsis PEAPOD (PPD) that regulates arrest of cell divisions in meristematic cells. We found no other mutations in the neighboring genes between the mutant and the wild type. We also knocked down GmPPD genes and reproduced both the mog and rl phenotypes in soybean. Controlling PPD genes to produce the mog phenotype is highly valuable for breeding since larger seed size could directly increase the commercial values of grain legumes.
Introduction
Seed size is one of the most important domestication-related traits for leguminous crops. Compared to the wild ancestors, most domesticated legumes have much larger seeds (Abbo et al. 2014). Larger seed size is still a major target trait for modern breeding, because it is related not only to yield but to commercial value. In some countries, large-seed cultivars of leguminous crops are traded at 2–3 times higher price than small-seed cultivars.
However, seed size is a typical quantitative trait, which is sum of multiple loci with small effects. Many genetic studies on seed size have been performed to date, but even the largest QTLs in those studies could increase the seed size by only 20% (Isemura et al. 2010, 2012, Kaga et al. 2008, Kongjaimun et al. 2012, Zhang et al. 2004).
For blackgram (Vigna mungo (L.) Hepper), however, which is one of the most important legume crops in South Asia, a doubled seed size mutant was obtained by gamma-irradiation to a cultivar ‘Phitsanulok 2’ (used to be called as ‘BC 48’) (Chinchest and Nakeeraks 1990). The mutant plant also had larger leaves and stems, thus we designated it as multiple organ gigantism (mog) mutant. Although a genetic linkage map was constructed using a BC1F1 population derived from the mog mutant and a wild accession ‘TC2210’ (Chaitieng et al. 2006), no further analyses have been reported.
Here we evaluated growth characteristics of the mog mutant and demonstrated the mog mutant was not only bigger but grew faster than the wild type. We also performed a map-based cloning and successfully identified that a mutation in VmPPD gene in the mog mutant. We also knocked down the orthologous genes in soybean (Glycine max) and successfully reproduced the mog phenotype.
Materials and Methods
Plant materials
Seeds of V. mungo (mog mutant (JP219132), ‘Phitsanulok 2’ (JP106710) and TC2210 (JP107873)) were provided by NARO genebank.
Evaluation of growth characteristics
To evaluate growth characteristics of the mog mutant and Phitsanulok 2, 16 plants per line were grown in plastic pots, from July to October in 2004, in a greenhouse with a 12 h dark/12 h light condition. Leaf area was measured by ImageJ (Schneider et al. 2012) after scanning. Number of cells/mm2 were calculated by observing epidermis on the fifth leaves in 10 plants using a stereomicroscope. Cell numbers were counted in the microscopic field, which was estimated to be 0.14 mm2. Four plants were sampled for measuring total leaf area and total dry weight of vegetative tissues (leaves and stems) on the 20th, 40th and 80th days after planting. Pods and seeds were harvested on the 90th day after planting.
Linkage analysis
The first linkage analysis was conducted using 191 F2 plants derived from the mog mutant and TC2210. Plants were grown from July to October in 2005 in the same greenhouse described above. Seeds were harvested from each plant and were measured to calculate 100 seeds weight. DNA extraction, genotyping, linkage map construction and QTL analysis was performed as described by Kaga et al. (2008). Detailed information of the SSR markers are available from [https://www.gene.affrc.go.jp/databases-marker_information_en.php].
To develop a population for fine mapping, we selected 51 F2 plants that harbored the marker loci CEDG156 and CEDG271 as heterozygous and as many other loci fixed with alleles of TC2210 as possible. We backcrossed TC2210 as the recurrent parent to the selected F2 plants and obtained 466 BC1F1 seeds. Of the 466, we selected and cultivated 24 BC1F1 plants, performed the second backcross and obtained 519 BC2F1 seeds. We genotyped 200 of the 519, selected 32 and performed the third backcross. Of the 384 BC3F1 seeds obtained, we selected two plants, selfed them and obtained 1,564 BC3F2 seeds.
We cultivated the BC3F2 population in plastic pots in the greenhouse from May to August in 2008 with a condition of 12 h dark/12 h light. We evaluated each plant to confirm whether the leaves were rippled. Seeds were harvested from each plant and were measured for 100 seeds weight. To determine whether the BC3F2 plants were fixed with the wild type allele or heterozygous at the MOG locus, we sowed BC3F3 seeds of the 1,139 BC3F2 plants (50 seeds per line) whose leaves showed the wild type phenotype. We cultivated the plants in the field from June to August in 2009. We evaluated all the plants for the rl phenotype.
To develop more markers, we first BLASTed the marker sequences of CEDG156 and CEDG271 in soybase v1.1 (http://soybase.org/) (Grant et al. 2010) to identify the syntenic region of the mog locus in soybean (Glycine max (L.) Merr.). We then downloaded the genome shotgun sequences of mungbean (V. radiata (L.) R. Wilczek) (Tangphatsornruang et al. 2009) and retrieved those aligned to the syntenic region of soybean. From the retrieved sequences, we designed 69 SSR markers using read2marker (Fukuoka et al. 2005) (Supplemental Table 1). Of the 69, nine were found polymorphic between the mog mutant and TC2210 and were used to genotype the BC3F2 plants.
Around the marker MBGS46949, eight genes were present in the soybean genome v1.1 (Schmutz et al. 2010). According to the genome shotgun sequences of mungbean (Tangphatsornruang et al. 2009), we designed primers to sequence introns of the eight genes in blackgram (Supplemental Table 2). Since we found no polymorphism except single nucleotide substitutions in all the eight genes between the mutant and TC2210, we designed CAPS (Konieczny and Ausubel 1993) or dCAPS (Neff et al. 1998) markers to distinguish the parental genotypes (Supplemental Table 3).
BAC library
After we found the four gene loci were completely linked to the mog phenotype, we screened the BAC library constructed from genomic DNA of the blackgram cultivar ‘Phitsanulok 2’. The BAC library construction and screening were performed as described by Wang et al. (2015). The DNA markers “38930_set1” and ”39010_set1” were used for screening (Supplemental Table 2). After screening, the BAC DNA of the clone VmR48p23 was extracted using ZR BAC DNA Miniprep Kit (Zymo Research). The extracted DNA was sheared into ~3 kb fragments, cloned into pUC118 vector, sequenced with BigDye Terminator (Thermo Fisher Scientific) and ABI3730 (Thermo Fisher Scientific), assembled by CLC Genomic Workbench (QIAGEN) and annotated manually. The sequence of the assembled BAC clone was deposited as LC101731 in DNA Data Bank of Japan (http://www.ddbj.nig.ac.jp/).
Sequencing candidate genes
We sequenced the whole ORFs of the four genes around the MOG locus in the mog mutant. Template DNA was amplified with KOD-plus (TOYOBO) and primers listed in Supplemental Table 4, and was sequenced with BigDye Terminator (Thermo Fisher Scientific) and ABI3730 (Thermo Fisher Scientific). The obtained sequences were aligned to the BAC sequence by CLC Genomic Workbench (QIAGEN).
Soybean transformation
To knockdown the PPD orthologues in soybean (GmPPD1 and GmPPD2), we constructed a starting RNAi vector according to the following procedures. From the T-DNA destination vector pH7GWIWG2(I) (Karimi et al. 2002), we retrieved a DNA fragment containing the inverted Gateway and a 644-bp linker between the promoter and the terminator of the cauliflower mosaic virus (CaMV) 35S transcript by SacI and KpnI digestion. We then transferred the SacI-KpnI fragment into the SacI-KpnI sites of pUHG (Khalafalla et al. 2005), a plasmid vector for soybean transformation that contained a hygromycin phosphotransferase gene (hpt) and green fluorescent protein gene (GFP) as marker genes. The resulting vector was designated as pUHG:P35S-IR. For construction of the RNAi vector targeting GmPPD genes, an artificial 300-bp cDNA fragment was synthesized, cloned into pEX-A vector (Eurofin Genomics) and then transferred as described previously (Nishizawa et al. 2010) to pUHG:P35S-IR to produce pUHG: GmPPD-RNAi.
Transformation of soybean (cv. Jack) by particle bombardment and subsequent plant regeneration were performed as described previously (Khalafalla et al. 2005). The plants regenerated from somatic embryos tolerant to hygromycin B (Roche Diagnostics) were monitored with a fluorescence stereomicroscope (Leica), and those expressing the GFP were grown under the green house condition. A transgenic line transformed with the empty vector, pUHG (Khalafalla et al. 2005), was used as a control.
Quantitative Real-Time PCR
Total RNA was isolated from the young, unexpanded leaves of T2 plants using RNeasy Plant Mini Kit (QIAGEN). One microgram of RNA was used to obtain cDNA with QuantiTect Reverse Transcription Kit (QIAGEN) according to the manufacturer’s instructions. The amount of the transcripts was then quantified using THUNDERBIRD SYBR qPCR Mix (TOYOBO) and ViiA 7 Real-Time PCR System (Thermo Fisher Scientific). All the qPCR amplifications were performed in quadruplicate in a total volume of 20 μl. Expression levels were measured using real-time RT-PCR and have been calculated using the delta-delta CT method (Livak and Schmittgen 2001) relative to the expression of Tubulin gene (Glyma.08g115100). The following primers were used for RT-PCR: GmPPD1 5′-CTGAGTAAGCTGGACTGGACTCGTT-3′ and 5′-CTAGTGGATCATTTGGGCAAATGAC-3, GmPPD2 5′-TTGAGTAAACTGGACAGGACTCACC-3′ and 5′-CTAGTGGATCATTTGGGCAAATGAC-3, Tubulin 5′-TCTTGGACAACGAAGCCATCT-3′ and 5′-TGGTGAGGGACGAAATGATCT-3′.
Significance of transcriptional changes were tested by pairwise t-test with the Holm correction method (Holm 1979).
Results
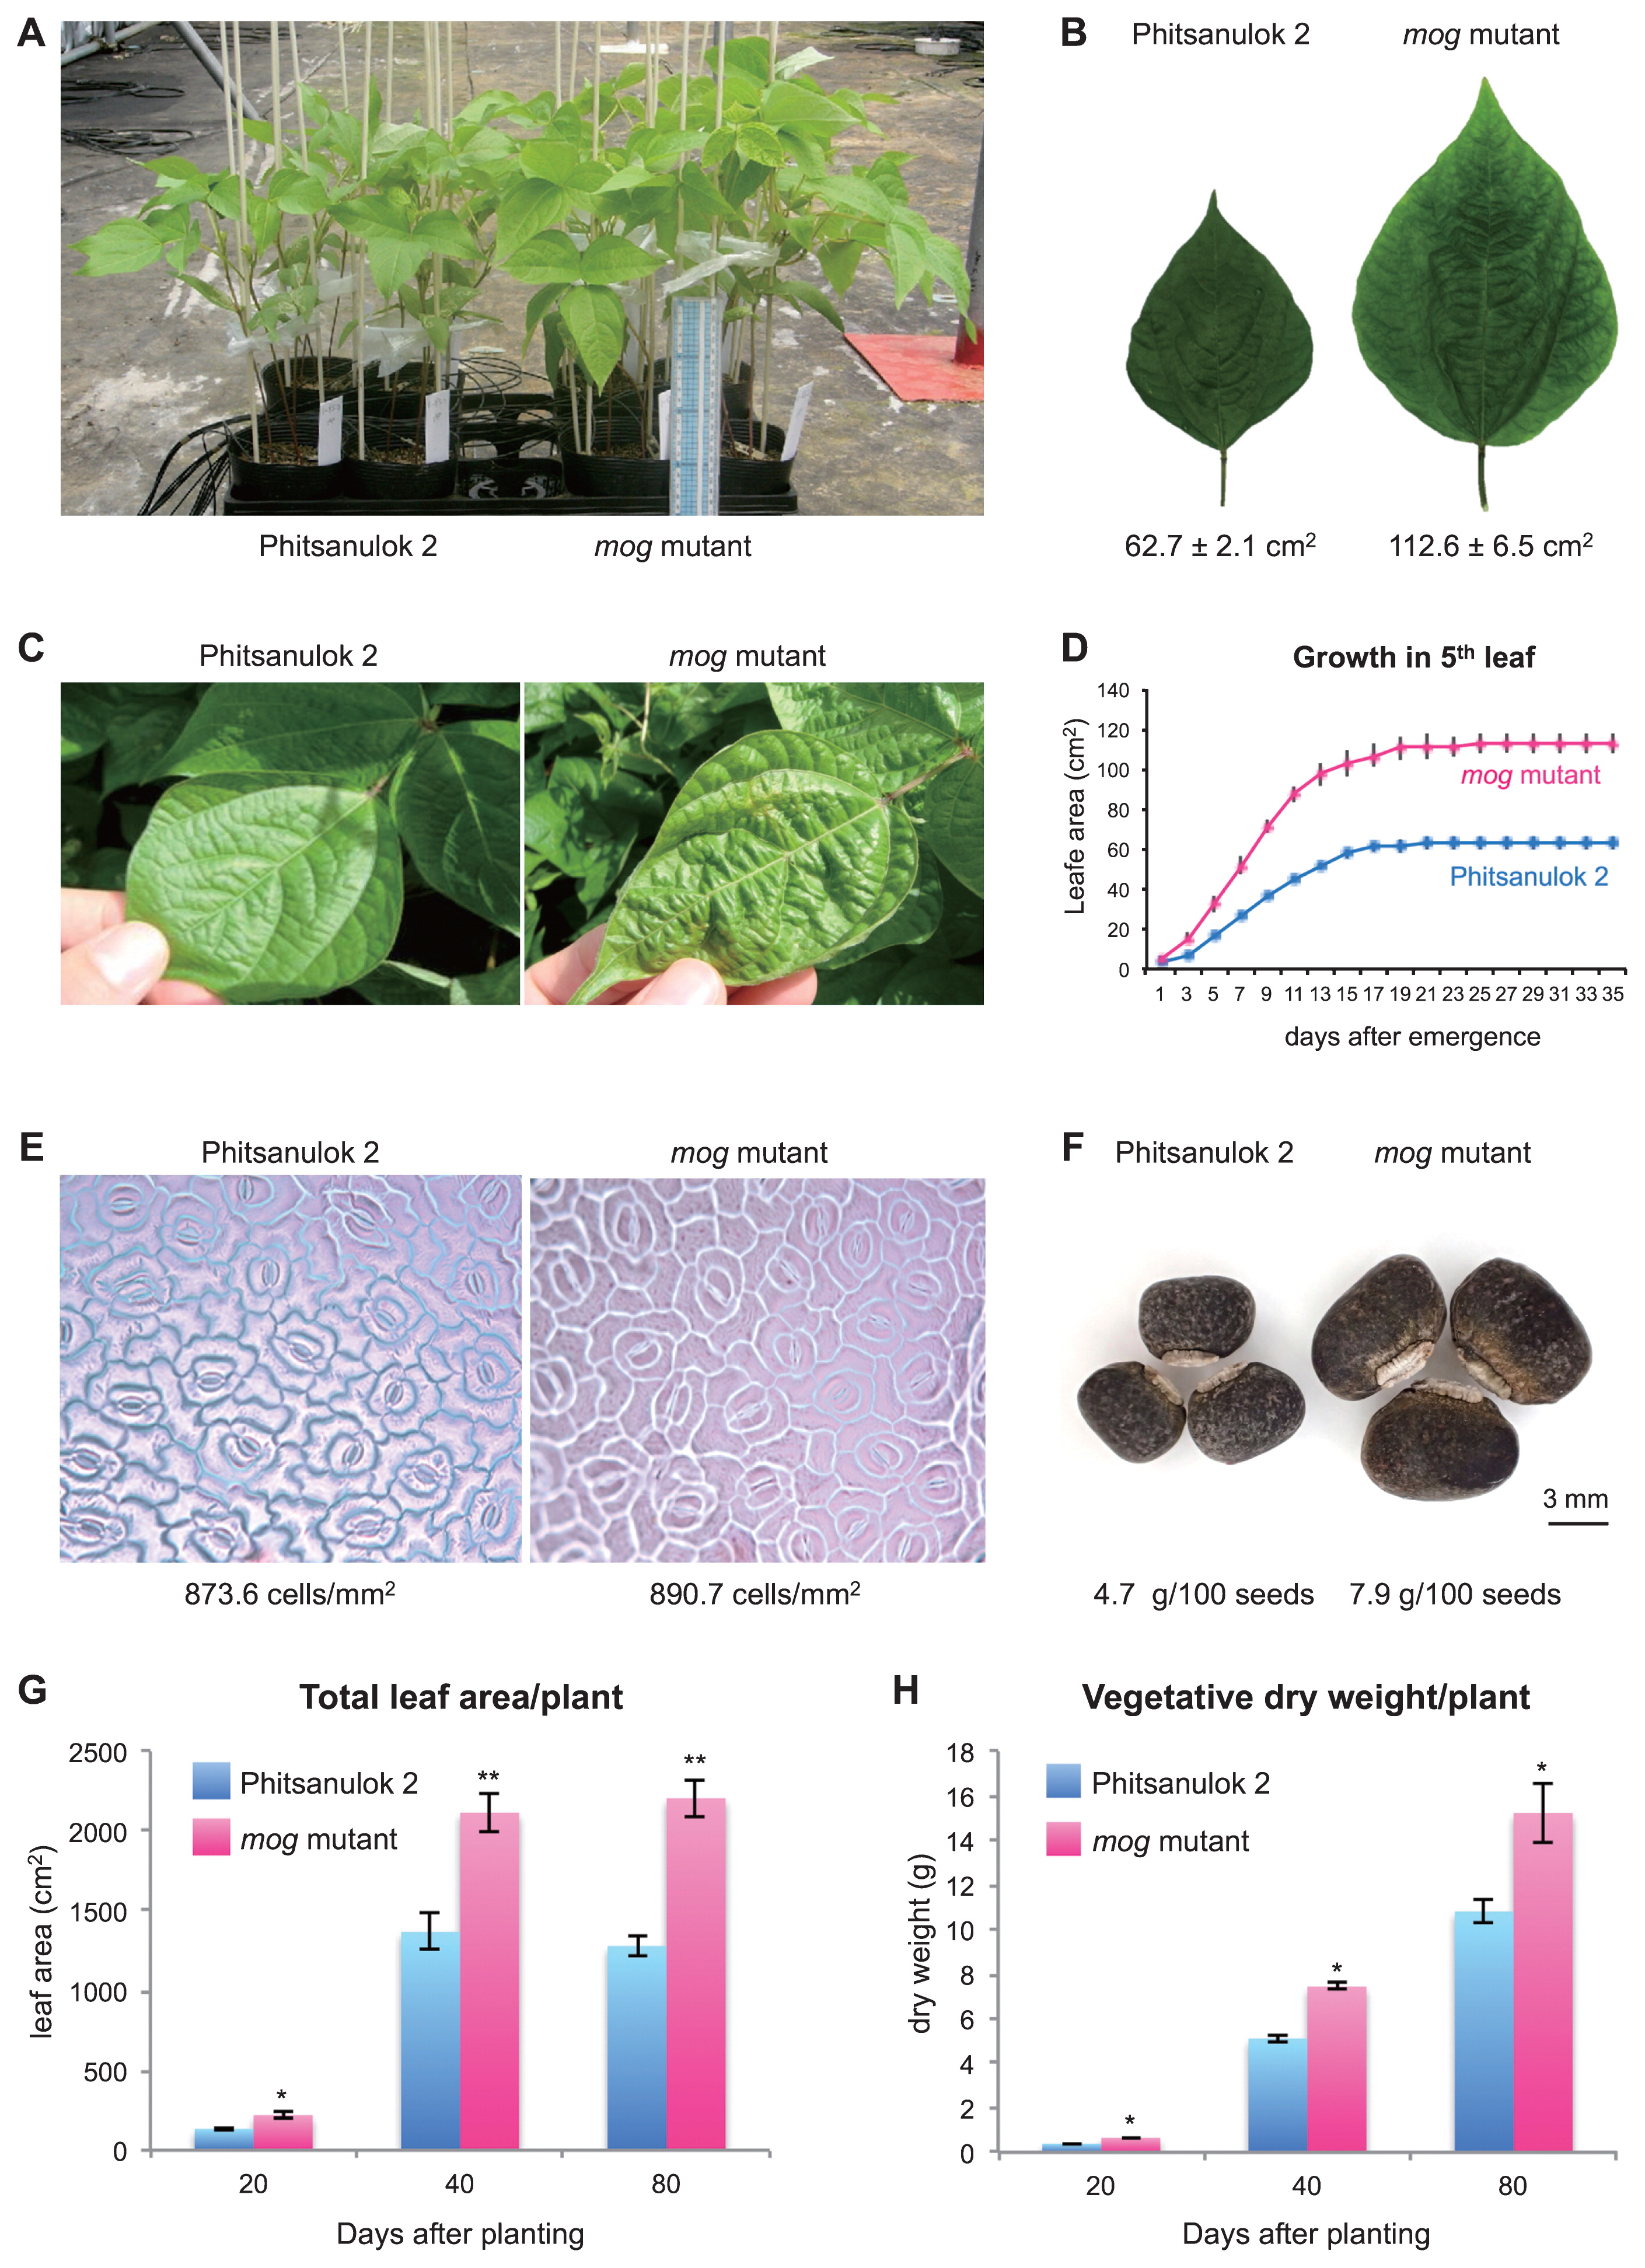
To evaluate growth characteristics of the mog mutant, we grew the mutant and the cultivar ‘Phitsanulok 2’ (wild type) in a greenhouse and measured various traits several times until seeds were set (Table 1, Fig. 1).
Table 1
Summary of traits on seed production in ‘Phitsanulok 2’ and the
mog mutant
|
Phitsanulok 2 |
mog |
Ratio |
Significancea |
| Total seed weight (g) |
18.6 |
17.9 |
0.96 |
n.s. |
| Number of seeds |
397.5 |
226.5 |
0.57 |
** |
| 100 seed weight (g) |
4.7 |
7.9 |
1.69 |
** |
| Number of pods |
62 |
47 |
0.76 |
* |
| Number of seeds/pod |
6.4 |
4.8 |
0.75 |
* |
a **: Significant at 1% level; *: Significant at 5% level; n.s.: not significant, based on the analysis of variance.
Our survey revealed the mutant was bigger than the wild type in all organ sizes (Fig. 1A). Compared to the leaves in the wild type, those in the mutant were 100% larger and were rippled (Fig. 1B, 1C). We also measured the area of the fifth leaf every two days and found that it took 21 days for the leaf to become fully expanded in both the wild type and the mog mutant (Fig. 1D).
To determine whether the mog phenotype was due to increases in cell numbers or cell sizes, we observed the leaf epidermises with a stereoscopic microscopy. As a result, the cell size was almost the same between the wild type and the mutant, indicating the gigantism was the result of increase in cell numbers (Fig. 1E).
Although the difference in the seed size was not so large as that in the leaf size, the mog mutant increased the seed weight by 70% compared to the wild type (Fig. 1F, Table 1). In addition, the mog mutant acquired systemic gigantism including total leaf area (Fig. 1G) and plant biomass (Fig. 1H), neither of which required longer time to reach plateau. The increase in these traits were also 50–70%.
As for the total weight of seeds, however, the increased seed size in the mog mutant was counterbalanced by reduced seed numbers, resulting in a similar total seed weight per plant to that of the wild type (Table 1). Compared to the wild type, the mutant produced 24% less number of pods and 25% less number of seeds per pod, leading to 44% less number of total seeds.
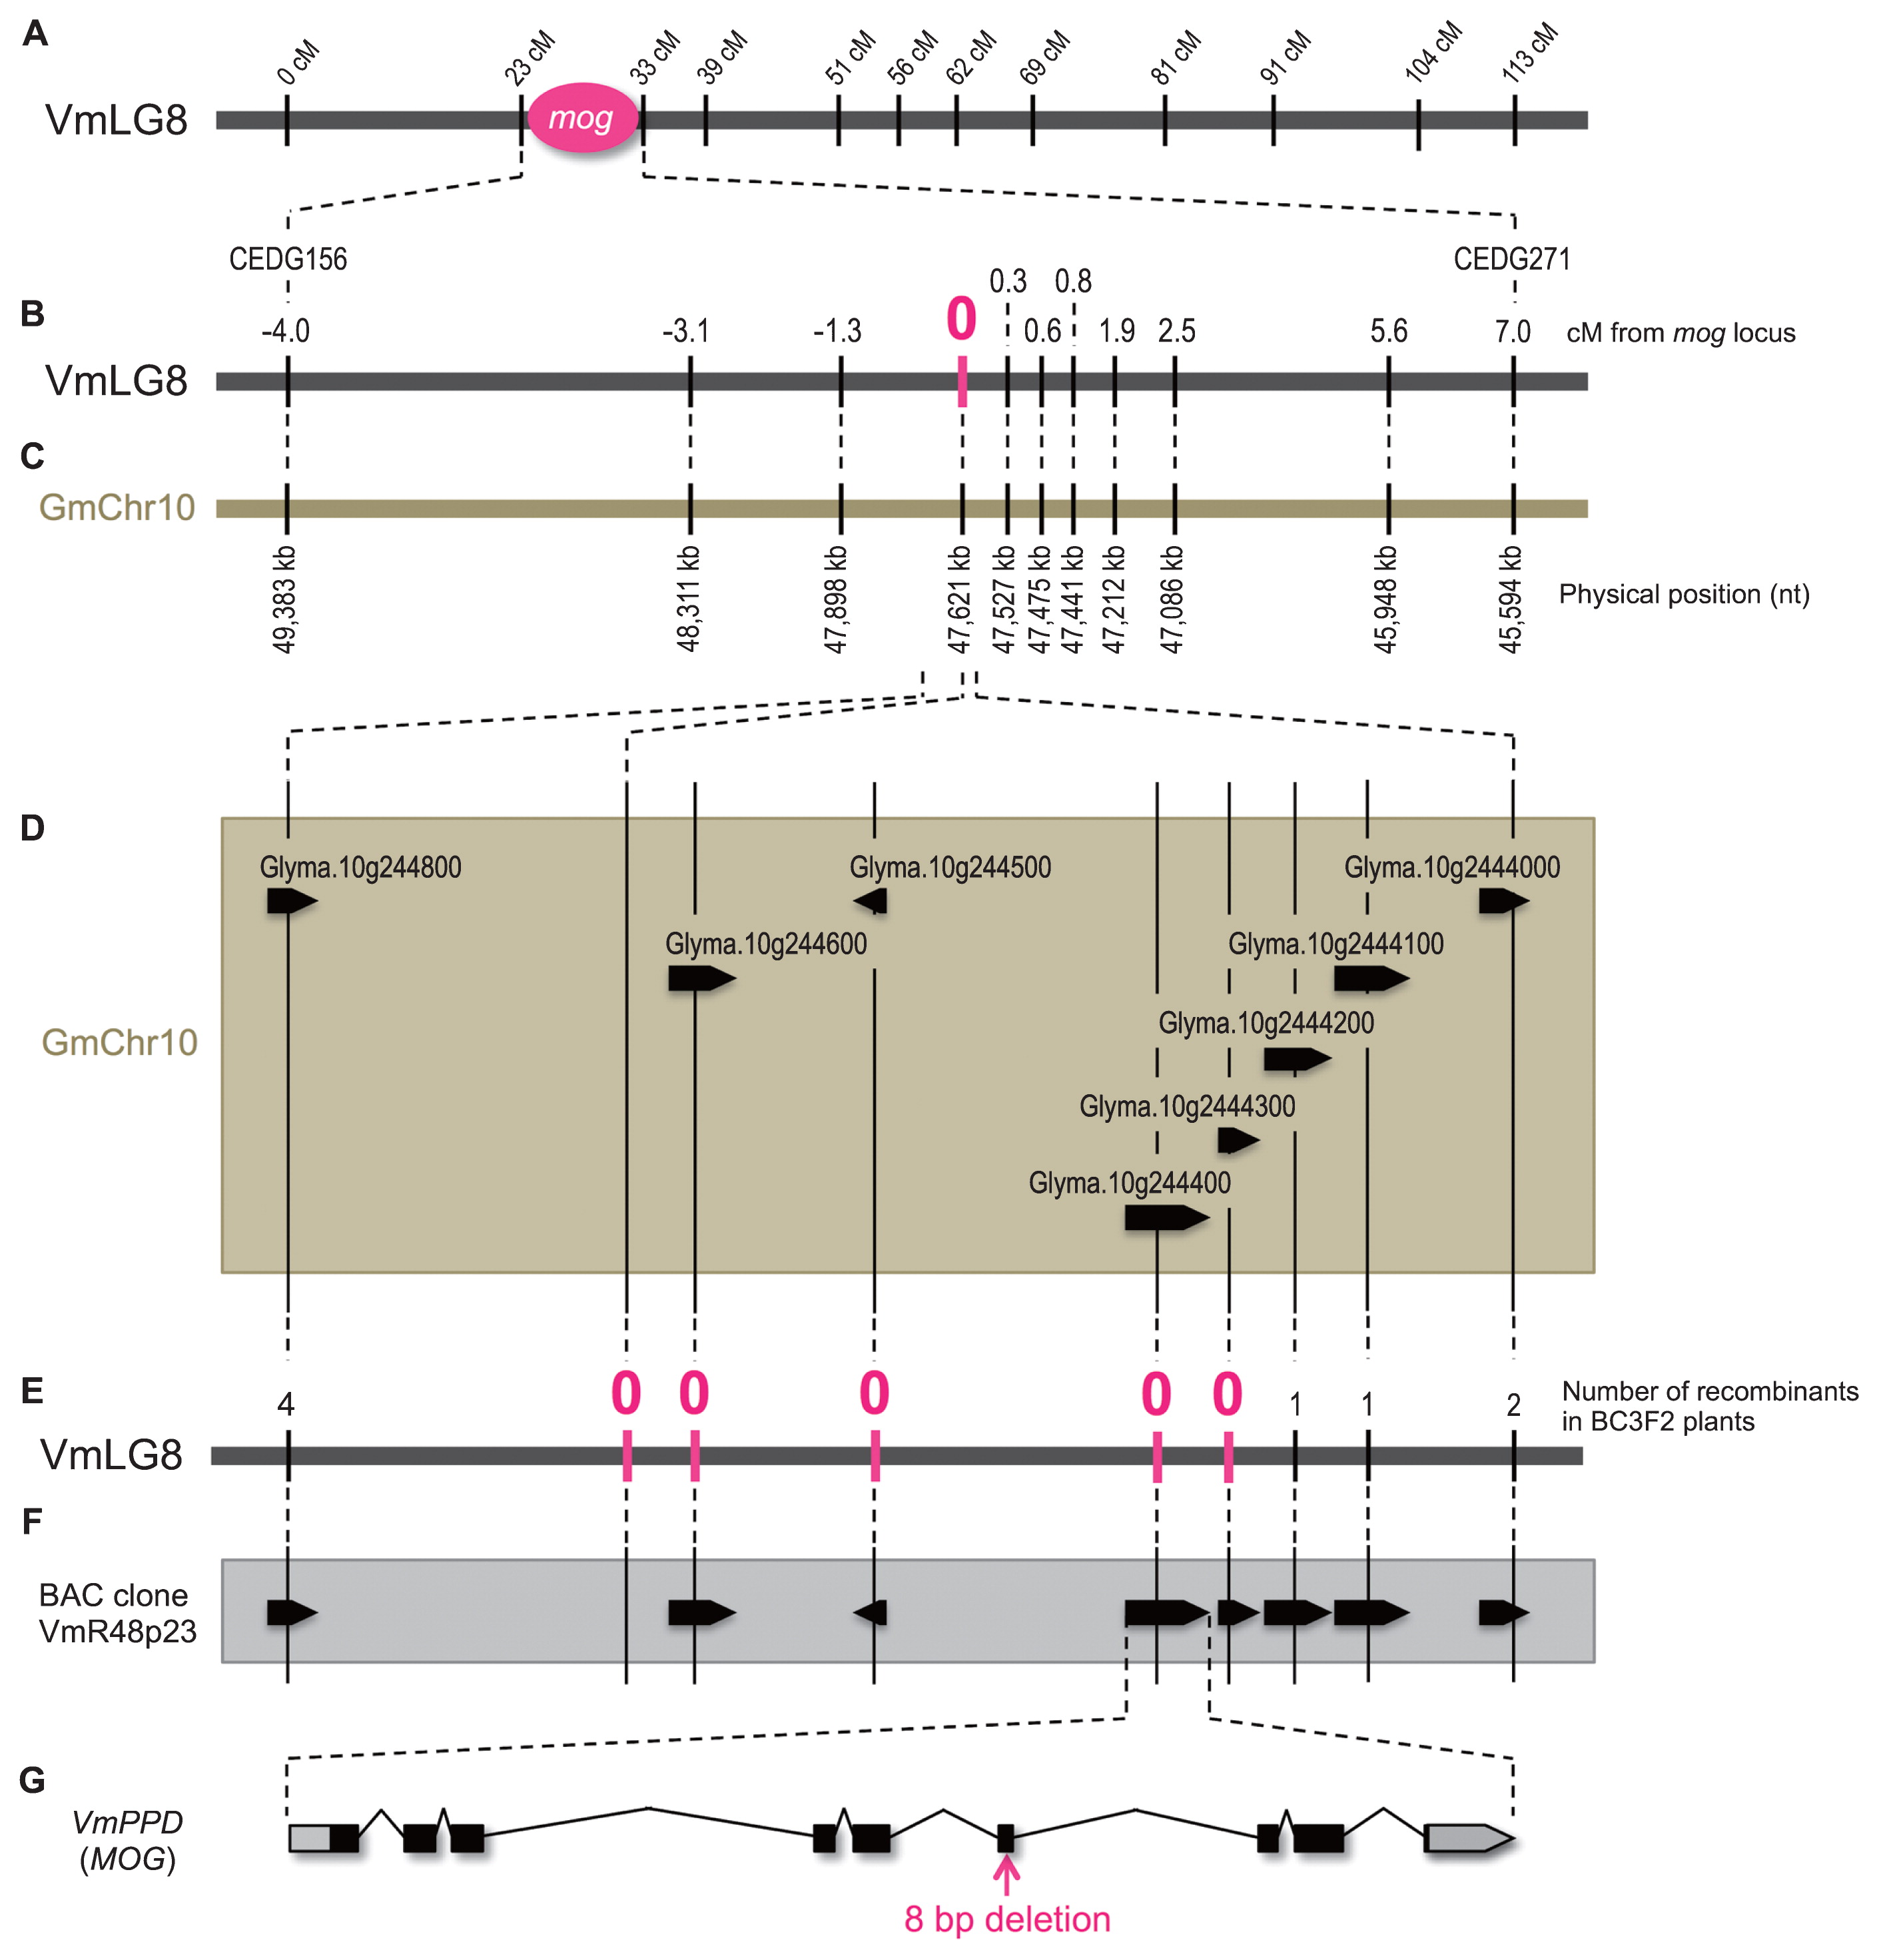
The traits of the mutant as described above provided us enough reason to map the mutant locus. Thus we developed an F2 population by crossing an accession ‘TC2210’ to the mog mutant. TC2210 is an accession of wild blackgram and thus its seeds were much smaller (1.8 g/100 seeds) than the mutant or the wild type. After developing a genetic map (Supplemental Fig. 1), we measured 100 seeds weight of 191 F2 plants and performed QTL analysis. The results revealed only two QTLs could explain more than 5% of phenotypic variance in seed size, and the one on the linkage group 8 (LG8) had an extremely strong effect that explained 65.9% of phenotypic variance with a LOD score of 66.9 (Table 2). We considered this locus, between the SSR loci of CEDG156 (22.7 cM) and CEDG271 (32.8 cM) on LG8, was the MOG locus (Fig. 2A).
Table 2
QTLs for 100 seeds weight detected in the F
2 population derived from the
mog mutant and ‘TC2210’
| LG |
Position |
LOD |
PVEa |
Additive effect |
Dominance effect |
Marker 1b |
Marker 2b |
P value |
| LG01 |
46.5 cM |
4.9 |
2.0% |
0.32 g |
0.01 g |
VES0025 |
VES0670 |
0.0005 |
| LG02 |
40.4 cM |
7.4 |
3.0% |
0.38 g |
0.14 g |
VES0718 |
GMES1033 |
0.0001 |
| LG03 |
6.8 cM |
5.3 |
1.9% |
0.34 g |
0.01 g |
cp00361 |
VES0120 |
0.0002 |
| LG05 |
15.4 cM |
4.9 |
2.0% |
−0.33 g |
−0.06 g |
CEDG020 |
DMBSSR217 |
0.0001 |
| LG07 |
42.5 cM |
3.5 |
1.7% |
0.30 g |
−0.01 g |
GMES5773 |
Bng152 |
0.0036 |
| LG08 |
32.2 cM |
66.9 |
65.9% |
2.00 g |
−0.51 g |
CEDG156 |
CEDG271 |
0.0001 |
| LG09 |
34.5 cM |
13.6 |
5.6% |
0.60 g |
0.09 g |
CEDGAG001 |
sgA060 |
0.0001 |
| LG10 |
31.3 cM |
7.8 |
3.0% |
0.44 g |
−0.04 g |
cgP157 |
GMES4400 |
0.0001 |
a Phenotypic variance explained.
To examine whether the MOG locus had been identified as seed size QTL in other legumes, we compared the blackgram linkage map with other Asian Vignas including azuki bean (V. angularis (Willd.) Ohwi & H. Ohashi) (Kaga et al. 2008), rice bean (V. umbellata (Thunb.) Ohwi & H. Ohashi) (Isemura et al. 2010) or mungbean (V. radiata) (Isemura et al. 2012). However, the MOG locus did not overlap with any seed size QTLs previously identified (Supplemental Fig. 2).
To finely map the MOG locus, we conducted three rounds of backcross to develop a BC3F2 population. Of the 1,564 BC3F2 plants, 425 showed the rippled leaf (rl) phenotype (see Fig. 1C) whereas the remaining 1,139 plants showed the wild type (RL) phenotype, suggesting the rl phenotype is controlled by a single recessive allele. In addition, all the rl plants produced larger seeds while others produced smaller seeds without any exception (2.9 g/100 seeds vs. 1.8 g/100 seeds, respectively) (Supplemental Fig. 3).
In addition, we cultivated the BC3F3 lines (50 plants per line) derived from the BC3F2 plants with the RL phenotype to determine whether the wild type plants have the genotype of [RL/RL] or [RL/rl]. Of the 1,139 lines, 756 lines generated plants with the rl phenotype while 383 lines generated only the RL phenotype. As such, the segregation of [RL/RL] : [RL/rl] : [rl/rl] was within the expected ratio of 1:2:1 (Χ2 = 3.98, p = 0.13). Compared to the [RL/RL] plants, the heterozygous plants bore slightly larger seeds, further confirming both the rl and the mog phenotypes were controlled by the same allele in the MOG locus (Supplemental Fig. 3).
Since no genomic information of brackgram was available, we relied on the synteny between blackgram and soybean to obtain more DNA markers. The region containing the mog locus was syntenic to 49.4 Mb-45.6 Mb on chr10 in soybean and 36.9 Mb-41.4 Mb on chr20 (Fig. 2A–2C). Since both the soybean regions were totally syntenic to each other, we ignored the latter in this study. However, it was not easy to design new markers based on soybean sequence, because soybean and blackgram are genetically divergent. On the other hand, the genome shotgun sequences of mungbean, which belongs to the same taxonomic section of the genus Vigna as blackgram, were also available although the assembly was highly poor (Tangphatsornruang et al. 2009). As such, we designed SSR markers based on mungbean sequences that were aligned well to the syntenic region of soybean. We obtained nine polymorphic markers, of which the locus MBGS46949 was completely linked to the MOG locus (Fig. 2B). In soybean, eight genes were present around this locus (Fig. 2D). Using the mungbean sequences, we designed primers to sequence introns of the blackgram orthologues and developed more DNA markers (Fig. 2E). Of the eight, we found four marker loci, four genes namely, were completely linked to the MOG locus (Fig. 2E).
However, it was still possible that this locus in blackgram contained other genes than the four. Thus, we constructed a genomic BAC library of the wild type blackgram and screened for a clone that contained the MOG locus. We identified VmR48p23 as such a clone, sequenced the whole clone and annotated. As a result, we identified only the four genes and found no other gene coding sequences in this locus (Fig. 2F).
We then sequenced the whole ORFs of the four genes in the mog mutant. As a result, we found no sequence alterations except an 8 bp deletion in the 6th exon of an orthologue of Glyma.10g244400 (Fig. 2G, Supplemental Fig. 4), which was also orthologous to Arabidopsis PEAPOD (PPD) gene (White 2006). Thus we designated the gene as VmPPD.
To further confirm that VmPPD is responsible for the mog phenotype, we knocked down the PPD orthologues in soybean (GmPPD1; Glyma.10g244400 and GmPPD2; Glyma.20g150000) by RNAi (Fig. 3, Supplemental Fig. 5). Of the six independently-transformed T2 lines obtained, we found three lines (7-1-1B, 7-1-2C and 7-2-1E) were clearly bigger than others and had significantly suppressed the GmPPD transcriptions (Fig. 3C, Supplemental Fig. 6). Compared to the control (transgenic with empty vector), all three lines showed bigger leaves (Fig. 3A) and significantly bigger seeds (Fig. 3B, Table 3). The leaves of the RNAi plants were also rippled (Figs. 1C, 3A). The 7-1-2C plants produced higher yield (total seed weight) than the control plants, although the difference was not significant (Table 3). The 7-2-1E plants were even bigger than the 7-1-2C plants, but produced significantly less pods, less seeds and lower yield than the control plants (Table 3). The number of seeds per pod was also significantly lower in 7-2-1E than in control (Table 3).
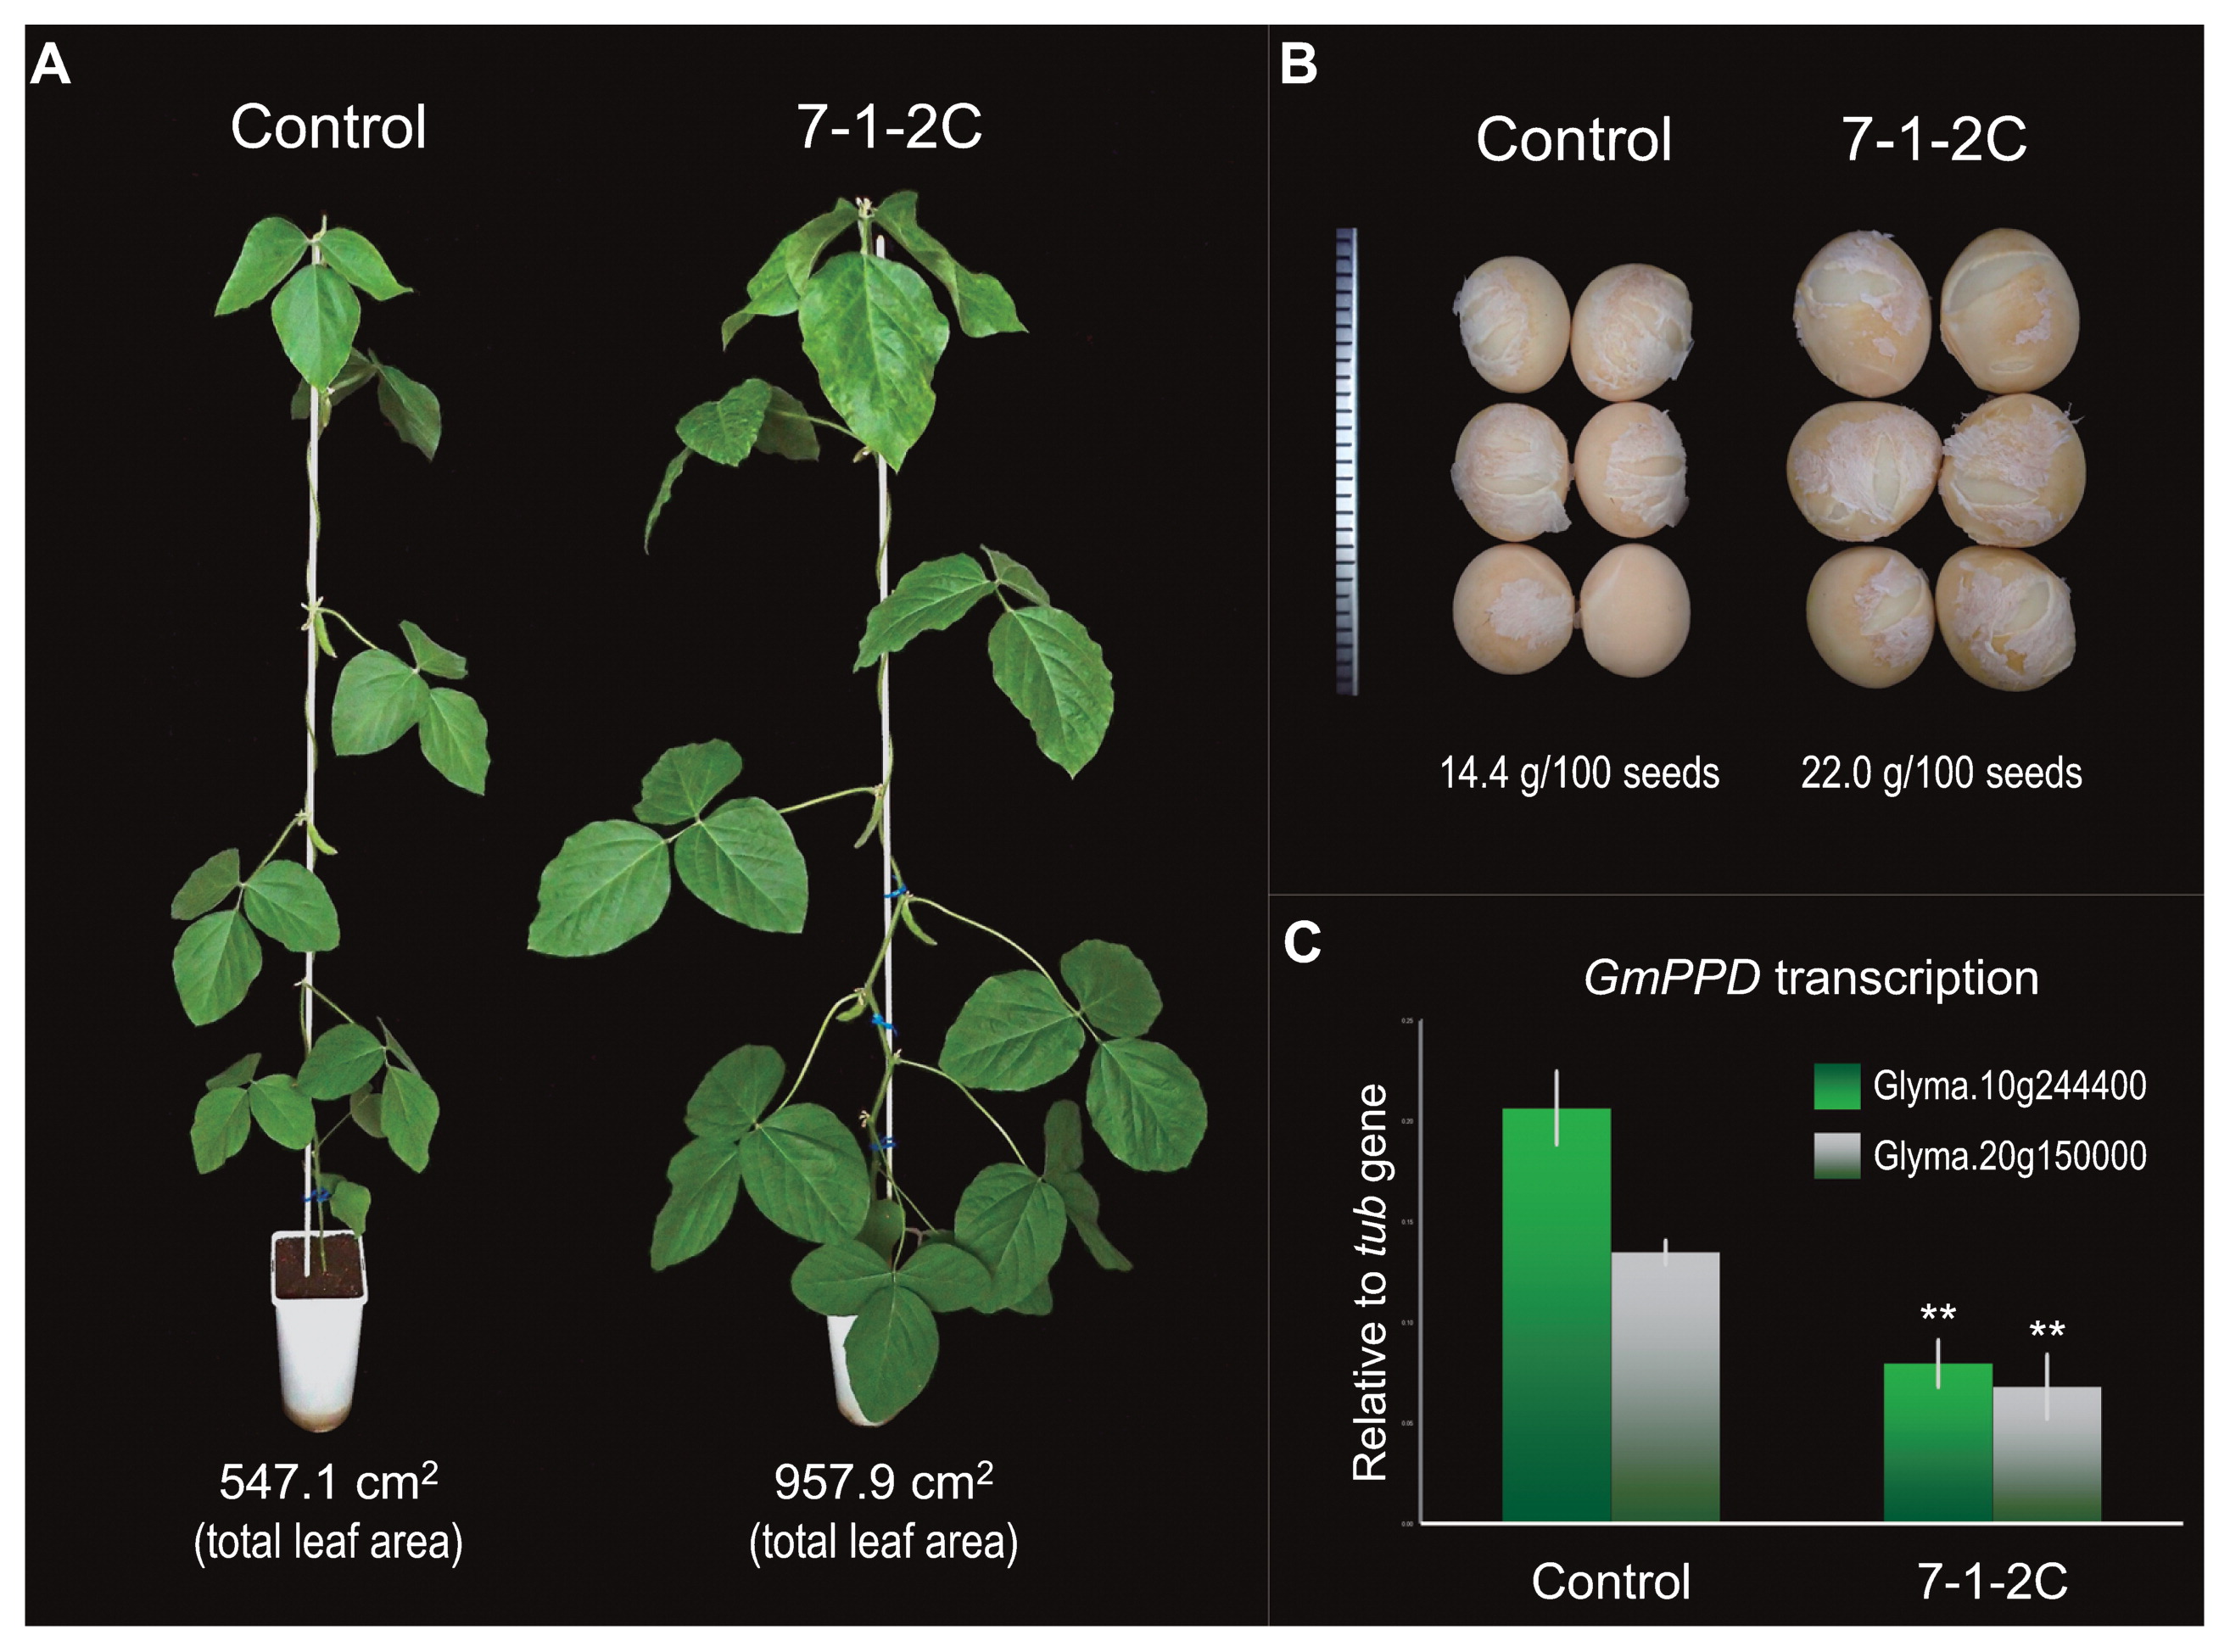
Table 3
Summary of traits on seed production in transgenic soybean
|
7-1-1B |
7-1-2C |
7-2-1E |
Control |
| Total seed weight (g/plant) |
4.4 |
5.6 |
2.2* |
3.7 |
| Number of seeds/plant |
25.5 |
20.8 |
8.5** |
26.5 |
| Seed weight (g/100 seeds) |
17.1* |
22.0** |
26.1** |
14.4 |
| Number of pods/plant |
10.2 |
10.5 |
7.0* |
11.3 |
| Number of seeds/pod |
2.6 |
2.0 |
1.2* |
2.3 |
** Significant at 1% level.
* Significant at 5% level.
Discussion
In this study, we demonstrated that the mog and rl phenotypes in the blackgram mutant was due to a loss-of-function mutation in VmPPD gene, an orthologue of Arabidopsis PEAPOD (White 2006). This mutation led to 100% increase in leaf size, 50–70% increase in biomass, and >70% increase in seed size (Figs. 1, 3). The increase of seed size by the mutation is by far the largest, compared to other seed size QTLs identified in Vigna crops, which increase seed size by no more than 20% (Isemura et al. 2010, 2012, Kaga et al. 2008, Kongjaimun et al. 2012, Zhang et al. 2004) (Supplemental Fig. 2). Although ppd mutants or PPD-knockdowns did not necessarily achieve higher yield of total seed weight (Tables 1, 3), the larger seed size could improve the commercial value of leguminous crops.
The function of PPD genes were originally elucidated in A. thaliana, where the null mutant of AtPPD genes showed increased leaf size (White 2006). Because PPD genes serve to arrest cell divisions in meristematic cells, malfunction of PPDs leads to more cell divisions and increased organ sizes (Fig. 1E). Although no change in seed size has been reported for ppd mutants or PPD-knockdowns in Arabidopsis, it might be because seed size is determined by cotyledons in legumes but by endosperms in Arabidopsis (Olsen 2004). As such, at least in legumes, PPD is also involved in seed size regulation. The recent report on a deletion mutation of PPD in Medicago trancatula also expresses the mog phenotype (Ge et al. 2016), further supporting our conclusion that the loss-of-function mutation in VmPPD is the cause for the mog phenotype.
We should mention here that PPD is one of the broadly conserved transcription factors in plants (Bai et al. 2011). Although the monocot species has lost this family, most of the dicot species, and even Lycopodiophyta species, have at least one copy of PPD. Since the function of PPD genes are conserved at least between legumes and Brassicaceae, we expect it is also conserved in other Dicots.
As such, it would be possible to increase leaf size and biomass by suppressing PPDs in horticultural crops. In addition, the faster growth by suppressing PPD (Fig. 1D, 1G, 1H) may accelerate harvesting cycles, especially for leafy vegetables cultivated in plant factories. As genome-editing via CRISPR/Cas system (Baltes and Voytas 2015) and virus-induced gene silencing (Ramegowda et al. 2014) are being practical in various agricultural and forestry species, the application of PPD-knockouts could be realized in the near future.
Acknowledgement
This work was funded in part by JSPS KAKENHI Grant Number 23688002 and 13J09808.
Literature Cited
- S. Abbo, R.P. van-Oss, A. Gopher, Y. Saranga, I. Ofner and Z. Peleg (2014) Plant domestication versus crop evolution: a conceptual framework for cereals and grain legumes. Trends Plant Sci. 19: 351–360.
- Bai, Y., Y. Meng, D. Huang, Y. Qi and M. Chen (2011) Origin and evolutionary analysis of the plant-specific TIFY transcriptin factor family. Genomics 98: 128–136.
- Baltes, N.J. and D.F. Voytas (2015) Enabling plant synthetic biology through genome engineering. Trends Biotechnol. 33: 120–131.
- Chaitieng, B., A. Kaga, N. Tomooka, T. Isemura, Y. Kuroda and D.A. Vaughan (2006) Development of a black gram [Vigna mungo (L.) Hepper] linkage map and its comparison with an azuki bean [Vigna angularis (Willd.) Ohwi and Ohashi] linkage map. Theor. Appl. Genet. 113: 1261–1269.
- Chinchest, A. and P. Nakeeraks (1990) Mutation breeding of blackgram (Vigna mungo). In: The Mungbean Meeting 90: 43–46.
- Fukuoka, H., T. Nunome, Y. Minamiyama, I. Kono, N. Namiki and A. Kojima (2005) Read2Marker: a data processing tool for microsatellite marker development from a large data set. Biotechniques 39: 472–475.
- Ge, L., J. Yu, H. Wang, D. Luth, G. Bai, K. Wang and R. Chen (2016) Increasing seed size and quality by manipulating BIG SEEDS1 in legume species. Proc. Natl. Acad. Sci. USA 113: 12414–12419.
- Grant, D., R.T. Nelson, S.B. Cannon and R.C. Shoemaker (2010) SoyBase, the SUDA-ARS soybean genetics and genomics database. Nucleic Acids Res. 38: D843–D846.
- Holm, S. (1979) A simple sequentially rejective multiple test procedure. Scandinavian J. Stat. 6: 65–70.
- Isemura, T., A. Kaga, N. Tomooka, T. Shimizu and D.A. Vaughan (2010) The genetics of domestication of rice bean, Vigna umbellata. Ann. Bot. 106: 927–944.
- Isemura, T., A. Kaga, S. Tabata, P. Somta, P. Srinives, T. Shimizu, U. Jo, D.A. Vaughan and N. Tomooka (2012) Construction of a genetic linkage map and genetic analysis of domestication related traits in mungbean (Vigna radiata). PLoS ONE 7: e41304.
- Kaga, A., T. Isemura, N. Tomooka and D.A. Vaughan (2008) The genetics of domestication in the azuki bean (Vigna angularis). Genetics 178: 1013–1036.
- Karimi, M., D. Inzé and A. Depicker (2002) GATEWAY vectors for Agrobacterium-mediated plant transformation. Trends Plant Sci. 7: 193–195.
- Khalafalla, M.M., S.M. Rahman, H.A. El-Shemy, Y. Nakamoto, K. Wakasa and M. Ishimoto (2005) Optimazation of particle bombardment conditions by monitoring of transient sGFP(S65T) expression in transformed soybean. Breed. Sci. 55: 257–263.
- Kongjaimun, A., A. Kaga, N. Tomooka, P. Somta, D.A. Vaughan and P. Srinives (2012) The genetics of domestication of yardlong bean, Vigna unguiculata (L.) Walp. ssp. unguiculata cv.-gr. sesquipedalis. Ann. Bot. 109: 1185–1200.
- Konieczny, A. and F.M. Ausubel (1993) A procedure for mapping Arabidopsis mutations using co-dominant ecotype-specific PCR-based markers. Plant J. 4: 403–410.
- Livak, K.J. and T.D. Schmittgen (2001) Analysis of relative gene expression data using real-time quantitative PCR and the 2(-Delta-Delta C(T)) method. Methods 25: 402–408.
- Neff, M.M., J.D. Neff, J. Chory and A.E. Pepper (1998) dCAPS, a simple technique for the genetic analysis of single nucleotide polymorphisms: experimental applications in Arabidopsis thaliana genetics. Plant J. 14: 387–392.
- Nishizawa, K., K. Takagi, M. Teraishi, A. Kita and M. Ishimoto (2010) Application of somatic embryos to rapid and reliable analysis of soybean seed components by RNA interference-mediated gene silencing. Plant Biotechnol. 27: 409–420.
- Olsen, O.A. (2004) Nuclear endosperm development in cereals and Arabidopsis thaliana. Plant Cell 16: S214–S227.
- Ramegowda, V., K.S. Mysore and M. Senthil-Kumar (2014) Virus-induced gene silencing is a versatile tool for unraveling the functional relevance of multiple abiotic-stress-responsive genes in crop plants. Front. Plant Sci. 5: 323.
- Schmutz, J., S.B. Cannon, J. Schlueter, J. Ma, T. Mitros, W. Nelson, D.L. Hyten, Q. Song, J.J. Thelen, J. Cheng et al. (2010) Genome sequence of the palaeopolyploid soybean. Nature 463: 178–183.
- Schneider, C.A., W.S. Rasband and K.W. Eliceir (2012) NIH Image to ImageJ: 25 years of image analysis. Nat. Methods 9: 671–675.
- Tangphatsornruang, S., P. Somta, P. Uthaipaisanwong, J. Chanprasert, D. Sangsrakru, W. Seehalak, W. Sommanas, S. Tragoonrung and P. Srinives (2009) Characterization of microsatellites and gene contents from genome shotgun sequences of mungbean (Vigna radiata (L.) Wilczek). BMC Plant Biol. 9: 137.
- Wang, L., S. Kikuchi, C. Muto, K. Naito, T. Isemura, M. Ishimoto, X. Cheng, A. Kaga and N. Tomooka (2015) Reciprocal translocation identified in Vigna angularis dominates the wild population in East Japan. J. Plant Res. 128: 653–663.
- White, D.W.R. (2006) PEAPOD regulates lamina size and curvature in Arabidopsis. Proc. Natl. Acad. Sci. USA 103: 13238–13243.
- Zhang, W.K., Y.J. Wang, G.Z. Luo, J.S. Zhang, C.Y. He, X.L. Wu, J.Y. Gai and S.Y. Chen (2004) QTL mapping of ten agronomic traits on the soybean (Glycine max L. Merr.) genetic map and their association with EST markers. Theor. Appl. Genet. 108: 1131–1139.