Abstract
Seed dormancy is important in rice breeding because it confers resistance to pre-harvest sprouting (PHS). To detect quantitative trait loci (QTLs) for pre-harvest sprouting resistance, we used chromosome segment substitution lines (CSSLs) derived from a cross between the Japanese upland rice cultivar ‘Owarihatamochi’ and the lowland rice cultivar ‘Koshihikari’. In the CSSLs, several chromosomal regions were associated with PHS resistance. Among these, the chromosome 9 segment from ‘Owarihatamochi’ had the greatest association with increased PHS resistance. Further QTL analysis using an advanced backcross population (BC4F2) derived from a ‘Koshihikari’ × ‘Owarihatamochi’ cross revealed two putative QTLs, here designated qSDR9.1 (Seed dormancy 9.1) and qSDR9.2, on chromosome 9. The ‘Owarihatamochi’ alleles of the two QTLs reduced germination. Further fine mapping revealed that qSDR9.1 and qSDR9.2 were located within 4.1-Mb and 2.3-Mb intervals (based on the ‘Nipponbare’ reference genome sequence) defined by the simple sequence repeat marker loci RM24039 and RM24260 and Indel_2 and RM24540, respectively. We thus identified two QTLs for PHS resistance in ‘Owarihatamochi’, even though resistance levels are relatively low in this cultivar. This unexpected finding suggests the advantages of using CSSLs for QTL detection.
Introduction
Seed dormancy is an important trait in programs for the breeding of rice and other cereal crop species because it confers resistance to pre-harvest sprouting (PHS). PHS often occurs under temperature and humidity conditions that favor it, or after untimely rain at the seed maturity stage, and it results in reduced grain quality and substantial loss of yield. One of the solutions to PHS is to enhance seed dormancy, which can be classified into primary and secondary dormancy. Primary dormancy is acquired during the seed maturation stage and reaches high levels in freshly harvested seeds; this type of dormancy is released during dry storage (after-ripening; Holdsworth et al. 2008) and is critical for PHS resistance. A high level of primary dormancy before harvest is a desirable trait in cereal crop species, because it prevents germination under predisposing environmental conditions, thus giving greater PHS tolerance. On the other hand, strong seed dormancy negatively affects germinability and seedling establishment in cultivation in the field (Jennings and Jesus 1964). Therefore, the development of cultivars with appropriate levels of primary seed dormancy is a very important objective in the breeding of cereal crops, including rice.
Seed dormancy is a quantitative trait that is controlled by environmental and endogenous genetic factors. Several quantitative trait loci (QTLs) controlling seed dormancy have been identified in rice and in other cereal crop species such as wheat (Chen et al. 2008, Flintham et al. 2002, Liu and Bai 2010) and barley (Gao et al. 2003, Gualano and Benech-Arnold 2009, Ullrich et al. 2008) and in the model plant Arabidopsis (Bentsink et al. 2006). In Arabidopsis, DELAY OF GERMINATION 1 (DOG1) was the first dormancy QTL to be cloned (Bentsink et al. 2006). Inactivation of DOG1 is key to seed dormancy release (Nakabayashi et al. 2012) and is regulated by DNA methylation (Müller et al. 2012), chromatin modification (Molitor et al. 2014), and alternative splicing (Nakabayashi et al. 2015), as well as through the action of a chromatin remodeling factor, KYP/SUVH4 protein (Footitt et al. 2015, Zheng et al. 2012). In wheat, a QTL, QPhs.ocs-3A, encoding Mother of Flowering Time (MFT) has been reported (Nakamura et al. 2011). Recently, a wheat PHS resistance gene, PHS1, and a barley PHS resistance gene, SD2, were isolated, and it was revealed that a mitogen-activated protein kinase cascade controls seed dormancy (Nakamura et al. 2016, Torada et al. 2016). Furthermore, map-based cloning of barley Qsd1 has revealed that an aminotransferase encoded by Qsd1 controls seed dormancy (Sato et al. 2016).
QTLs for seed dormancy or PHS resistance have also been mapped in rice. So far, more than 165 QTLs associated with seed dormancy have been identified (reviewed by Magwa et al. 2016). These QTLs have been reported in the progeny of crosses between japonica and indica cultivars (Dong et al. 2003, Gao et al. 2008, Guo et al. 2004, Lin et al. 1998, Wan et al. 2005, You et al. 2006), in weedy rice (Gu et al. 2004), and in the wild relatives of rice Oryza rufipogon and Oryza nivara (Cai and Morishima 2000, Lee et al. 2005, Thomson et al. 2003). Moreover, many QTL candidates have been detected by using population genomics methods such as genome-wide association study (Magwa et al. 2016). Of these QTLs, Seed dormancy 4 (Sdr4), a major regulator of dormancy in rice, was the first to be molecularly identified in crops. It was identified through map-based cloning using backcross inbred lines (BILs) derived from crosses between the japonica cultivar ‘Nipponbare’ and the indica cultivar ‘Kasalath’ (Sugimoto et al. 2010). A major QTL for PHS resistance has been identified on the short arm of chromosome 3 in BILs derived from crosses between the lowland japonica rice cultivars ‘Nipponbare’ and ‘Koshihikari’ (Hori et al. 2010). Among the japonica cultivars, ‘Koshihikari’ has relatively strong PHS resistance. A strong candidate PHS resistance gene from weedy rice, qSD7-1, is present at the Rc locus, which encodes a transcription factor that controls both pigmentation and abscisic acid biosynthesis (Gu et al. 2011). Map-based cloning of qSD1-2 of weedy rice has shown that this gene region includes OsGA20ox2, also known as semidwarf1 (sd1), and controls seed dormancy through gibberellic acid biosynthesis (Ye et al. 2015).
Usually, QTL analysis for PHS resistance is done by using populations derived from crosses between cultivars with high and low levels of PHS resistance. Previously, we attempted to identify PHS resistance QTLs in crosses between ‘Nipponbare’ and PHS-resistant ‘Kasalath’ (Lin et al. 1998), ‘Koshihikari’ and resistant ‘Nona Bokra’ (Marzogui et al. 2012), and ‘Nipponbare’ and the more resistant ‘Koshihikari’ (Hori et al. 2010). In these genetic analyses, the donor cultivars showed higher PHS resistance than the recurrent parent cultivar and PHS resistance QTLs were identified. However, we made a very interesting observation during the development of CSSLs by using the Japanese upland rice ‘Owarihatamochi’. In general, upland rice cultivars, including ‘Owarihatamochi’, have high germinability rates upon direct seeding to overcome competition from weeds (Sasaki 1974). Although ‘Owarihatamochi’ exhibits low levels of PHS resistance (lower than in ‘Koshihikari’), here we observed some progeny with relatively high levels of PHS resistance among advanced backcross progeny of a cross between these ‘Owarihatamochi’ and ‘Koshihikari’ as the recurrent parent. These progeny, unexpectedly, had higher PHS resistance than ‘Koshihikari’. This interesting observation suggests that some genetic factor in ‘Owarihatamochi’ increases the level of PHS resistance.
We then performed further analyses, including validation of the effects of the QTLs found on chromosome 9, by using an advanced backcross population, BC4F2, derived from crosses between ‘Owarihatamochi’ and ‘Koshihikari’. Fine mapping narrowed down the candidate genomic regions of the QTLs. For further characterization of the identified QTLs, we investigated the mRNA levels of dormancy-related genes in substitution lines stacking each QTL, and we discuss the possible mechanisms of action of the genes associated with the QTLs.
Materials and Methods
Plant materials
To detect the chromosomal regions involved in PHS resistance, we used CSSLs developed from a cross between ‘Owarihatamochi’ (very weak dormancy) and ‘Koshihikari’ (weak dormancy). The procedure used to develop the CSSLs is summarized in Fig. 1. We began with an F1 population derived from ‘Koshihikari’ and ‘Owarihatamochi’, and we repeatedly backcrossed the progeny with ‘Koshihikari’ to produce BC4F1 plants. We conducted a whole-genome survey using 121 simple sequence repeat (SSR) markers in each backcross generation (BC1F1 to BC4F1) to select target chromosome segments in each CSSL and to minimize the number of non-target chromosome segments from the donor. Selected BC4F1 plants were self-pollinated to produce 29 BC4F2 populations. Forty-four plants were selected from among 1400 BC4F2 individuals by using marker-assisted selection. Although heterozygous segments remained in the non-target regions, almost all target regions were homozygous. The self-pollinated progeny of all 44 plants gave 44 CSSLs in the BC4F5 generation. The genotypes of the CSSLs, which we characterized by using 339 SNP markers (Supplemental Table 1), were determined by using 768-plex single nucleotide polymorphisms for the Illumina Golden Gate Bead Array technology platform (Illumina, Inc., San Diego, CA, USA) on the basis of previously reported information (Nagasaki et al. 2010).

To measure the levels of PHS resistance, the 44 CSSLs and their background controls (‘Koshihikari’ and ‘Owarihatamochi’) were grown in a paddy field at the National Institute of Agrobiological Sciences (NIAS), in Tsukuba, in 2011. For QTL analysis, 189 BC4F2 plants, which were produced by crossing ‘Owarihatamochi’ with ‘Koshihikari’, were grown in the experimental field at NIAS in 2012. The plants were genotyped by using 11 SSR markers. For fine mapping of the putative QTLs detected on chromosome 9, the self-pollinated BC4F3 progeny were genotyped by using 13 DNA markers, and 7 pairs of recombinant BC4F4 lines were selected. The BC4F5 plants were used to verify the allelic effects of the QTLs detected. To measure the expression levels of Sdr4, OsDOG1L-2, which is regulated by Sdr4 (Sugimoto et al. 2010), and OsHB20, an ortholog of AtHB20 (Barrero et al. 2010), from among the BC4F3 plants we selected two substitution lines (SLs) for the QTLs detected; in these lines, recombination occurred between the SSR marker loci RM24260 and RM24540 (4.0 Mb) and RM24039 and RM24260 (4.1 Mb), respectively.
Evaluation for pre-harvest sprouting resistance
Levels of PHS resistance were evaluated by measuring germination rates at seed maturity. The time when each panicle protruded from the leaf sheath was defined as the heading date. To synchronize conditions after the ripening period, three panicles sampled at 6 or 8 WAH (weeks after heading) from each of three plants in the case of the CSSLs, or at 9 WAH in the case of fine mapping and BC4F4 progeny-testing for the putative QTLs qSDR9.2 and qSDR9.1, were wrapped in paper towels and dipped in water. Samples taken at 6 WAH were used to find CSSLs with lower levels of PHS resistance, whereas those taken at 8 WAH were used to find those with higher levels of PHS resistance. The harvested panicles were immediately incubated in the dark at 30°C and 100% humidity for 7 days. In the case of CSSL and QTL analyses, the number of germinated seeds was then counted as a percentage of the total number of seeds on each panicle. In the case of fine mapping and BC4F4 progeny testing of qSDR9.2 and qSDR9.1, 50 seeds from each of three panicles from each of three plants from each line were collected, and the number of seeds that germinated was counted and indicated as a percentage (i.e., average germination rate). To evaluate the PHS resistance of the parental cultivars, 50 seeds collected from each line at 4 to 8 WAH were placed on a filter paper in an 11-cm Petri dish, and 5 mL of distilled water was added. The dishes were then placed in an incubator at 30°C and 100% humidity. These experiments were performed twice, and the results represent the mean values from three experiments. Because we were focusing on PHS resistance in plants in the paddy field before harvesting, we used fresh seeds and did not control their water content.
DNA extraction and SSR marker analysis
Genomic DNA was extracted as follows: leaves (<2.5 cm long) were homogenized in 40 μL of 0.5 M NaOH with stainless-steel beads, and 160 μL of 1 M Tris-HCl (pH 9.0) was then added. Supernatants were isolated by centrifugation (3100 g). For PCR, a fivefold dilution of the supernatant was used. SSR markers showing polymorphism between ‘Koshihikari’ and ‘Owarihatamochi’ were obtained by investigating SSR motifs in the target chromosomal regions (IRGSP ver. 1, http://rapdb.dna.affrc.go.jp/) and used to genotype the F2 to F4 plants. PCR was performed with initial denaturation for 2 min at 95°C and 35 cycles (1 min at 95°C, 1 min at 60°C, and 2 min at 72°C), followed by final extension for 3 min at 72°C. PCR products were electrophoresed on 3% agarose gel to detect polymorphisms.
Linkage mapping and QTL analysis
Linkage maps were constructed from the genotypes by using version 3.0 of MAPMAKER/EXP (Lander et al. 1987). Genetic distances were estimated by using the software’s Kosambi map function (Kosambi 1944). For QTL analysis, we used composite interval mapping, as implemented in the Zmapqtl program (model 6) provided in version 2.5 of QTL Cartographer software (Wang et al. 2005). Genome-wide threshold values (α = 0.05) used to detect putative QTLs were based on the results of 1000 permutations.
RNA preparation and real-time PCR
RNA was purified by using an RNeasy Plant Kit with on-column DNase I treatment (Qiagen, Hilden, Germany). cDNA was synthesized from total RNA (2.5 μg) by using a ReverTra Ace qPCR RT Master Mix (Toyobo, Osaka, Japan; FSQ-201), in accordance with the manufacturer’s instructions. The RT-PCR analysis was conducted with an ABI7900HT Fast real-time PCR system and Thunderbird SYBR qPCR Mix (Toyobo; QPS-201). To quantify Sdr4 and Act-1 mRNA levels, specific primers were used (Table 1). PCR was performed for 2 min at 50°C, then 10 min at 95°C, followed by 40 cycles of 15 s at 95°C and 1 min at 60°C. The quantified fragments of cloned cDNAs were used as copy-number standards. The results are represented as the means of at least three biological replicates.
Table 1
Primer sequences used in this study
| (A) Primer sequence for mapping |
| Marker Name |
Forward |
Reverse |
| Indel_2 |
TCAGCTACTGCATGTACGACAA |
AACTACCAAGGCACAACTAGGC |
| (B) Primer sequences for expression analysis |
| Gene |
Forward |
Reverse |
RAP-ID |
cDNA |
| Sdr4 |
TCGTGCTCGGCCAAGATCGCGTG |
GAGAACAAACAAATCTCACTAAAGC |
Os07g0585700 |
– |
| OsDOG1L-2 |
CAACTCAAGTCGTCGCGATA |
ATCACATGCAAACGCAAAAA |
Os01g0159000 |
AK106273 |
| OsHB20 |
GGGATTAATGTTGGATCAATCATCA |
CATCAAAAAGGTAATGGAGGTAAAATG |
Os02g0725700 |
AK107861 |
| Act1 |
CTTCAACACCCCTGCTATGTACG |
TGACACCATCACCAGAGTCCAAC |
Os03g0718100 |
AK100267 |
Results
CSSL development
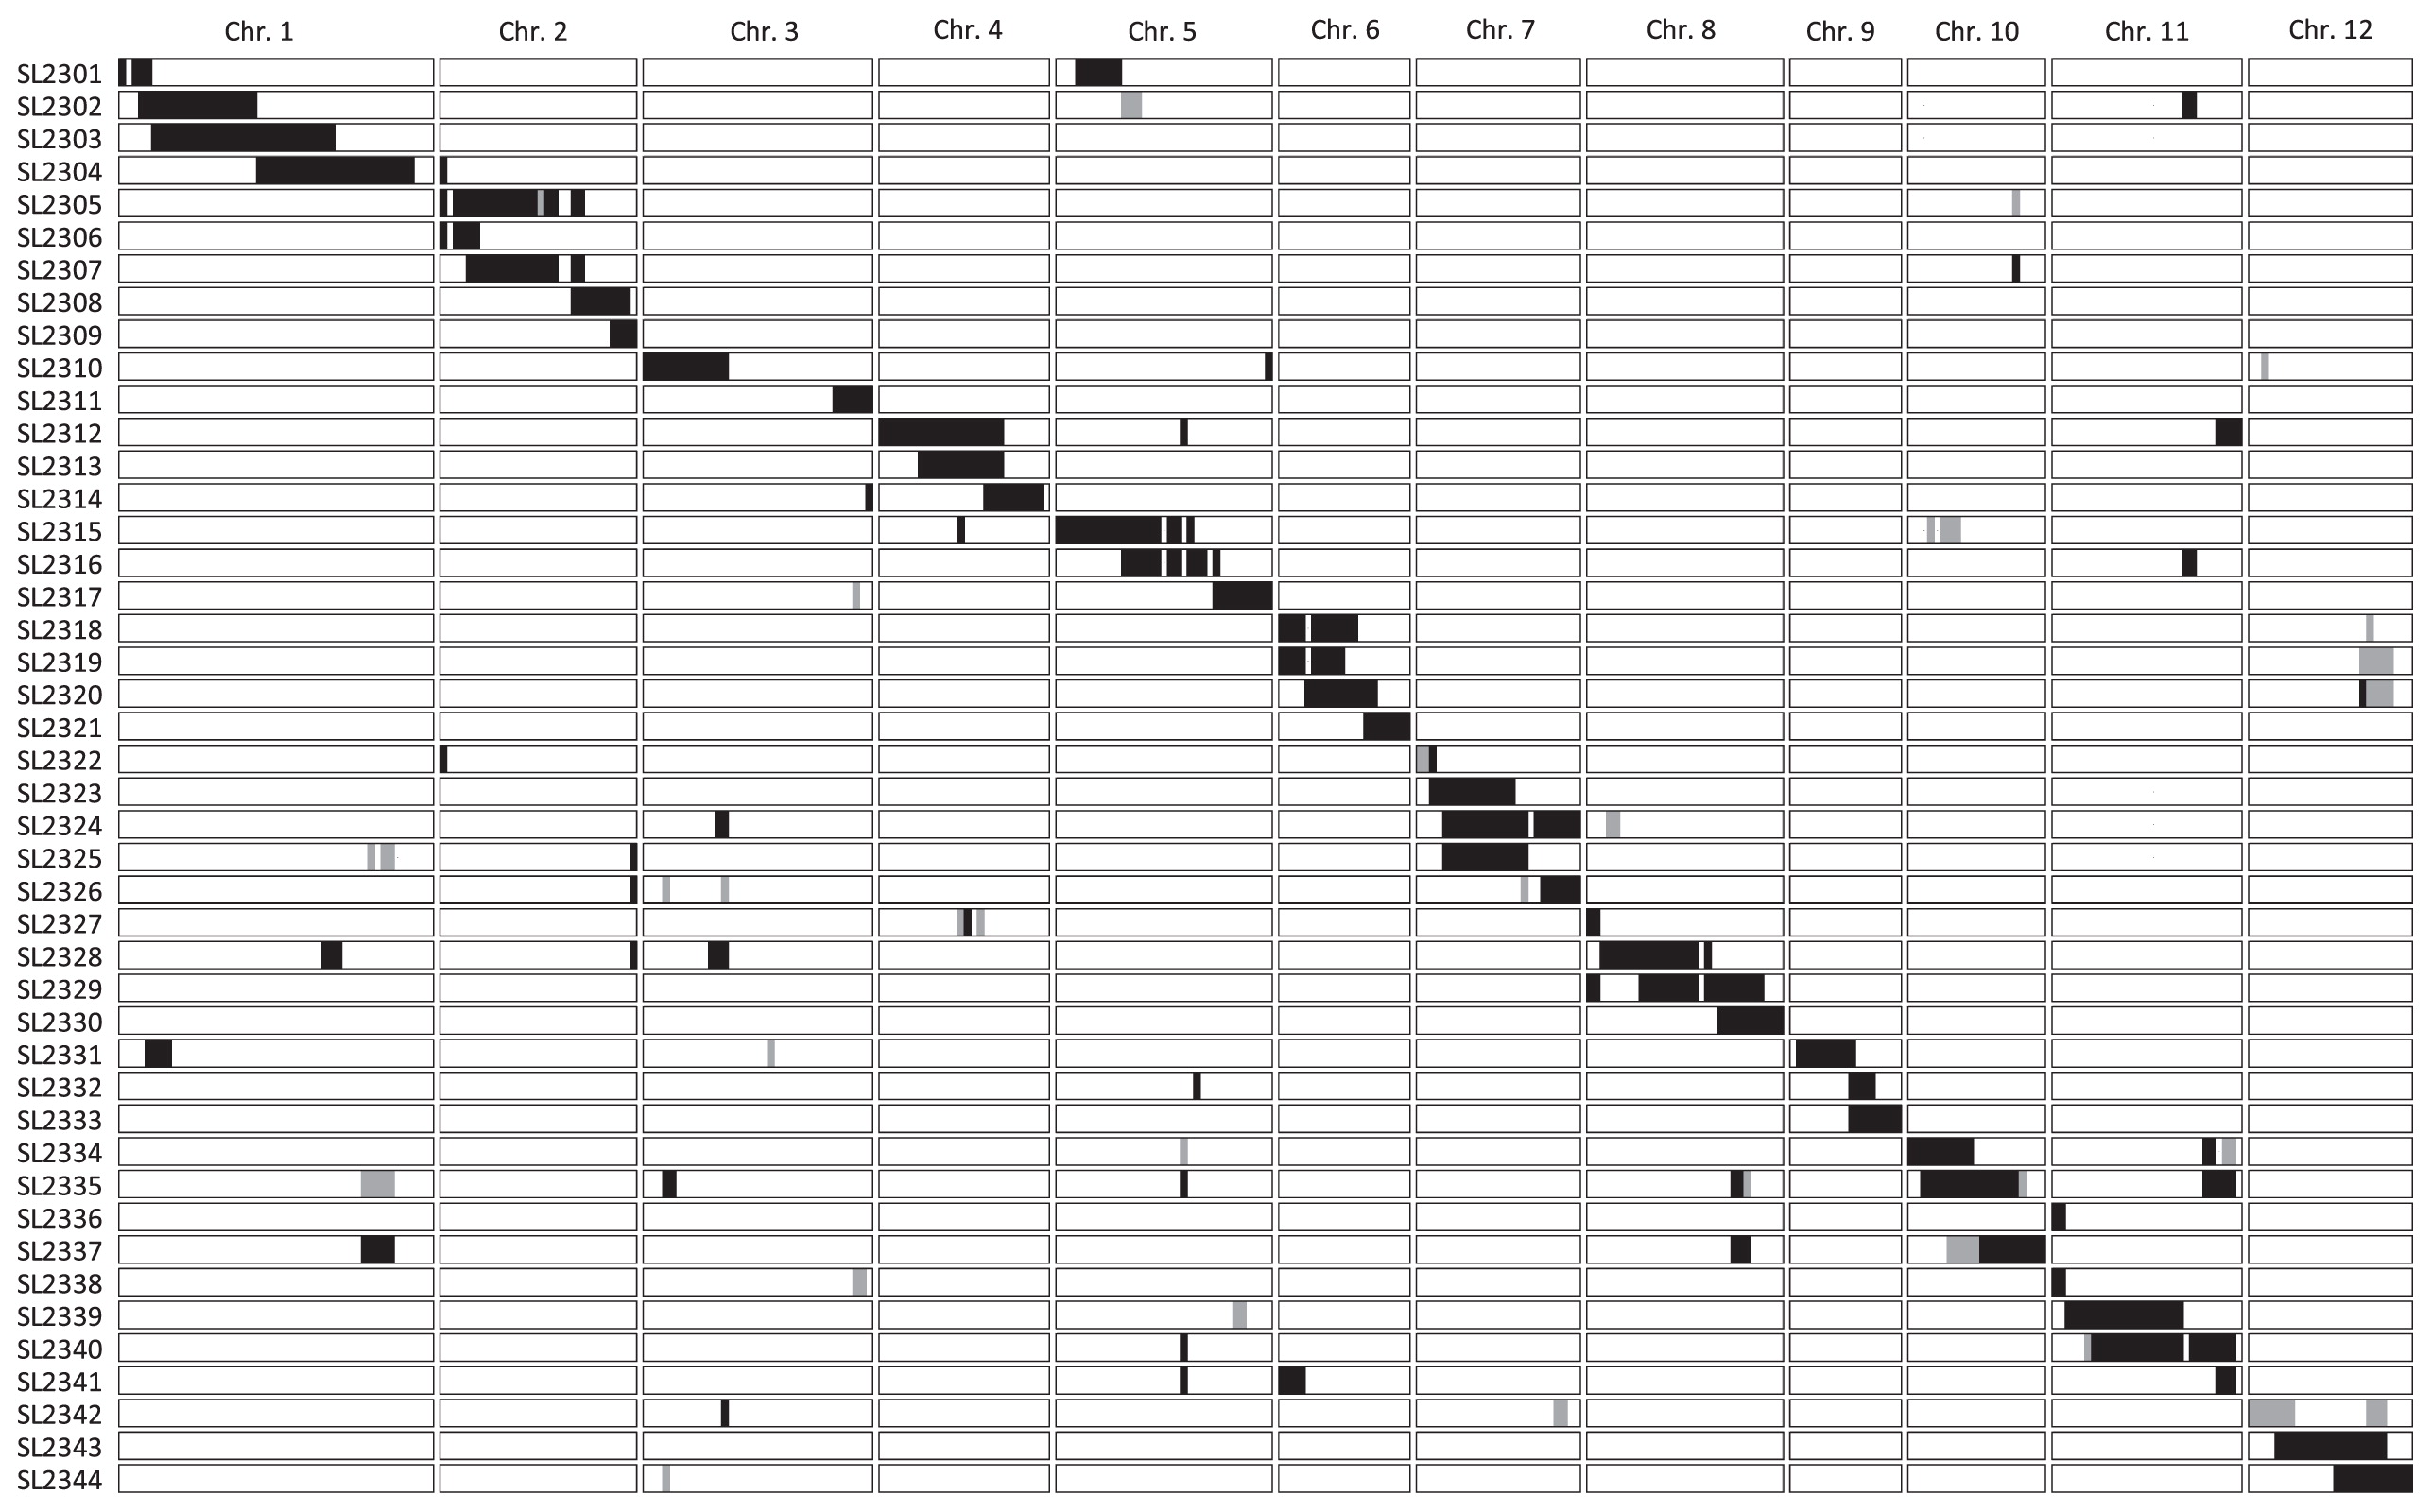
We successfully developed 44 CSSLs with relatively small chromosome segments of ‘Owarihatamochi’ in the genetic background of ‘Koshihikari’ (Fig. 2, Supplemental Table 1). In each CSSL, a particular target chromosomal region was substituted with that from ‘Owarihatamochi’, and in some CSSLs one or two small untargeted chromosomal regions were also substituted. The target chromosomal regions covered most of the 12 chromosomes, with the exception of some small regions. In addition, some lines contained small heterozygous chromosomal regions. Although the set of CSSLs did not cover all the chromosomes, the CSSLs developed were applicable to comparative QTL surveys of any trait between ‘Koshihikari’ and ‘Owarihatamochi’.
Identification of putative chromosomal regions for seed dormancy
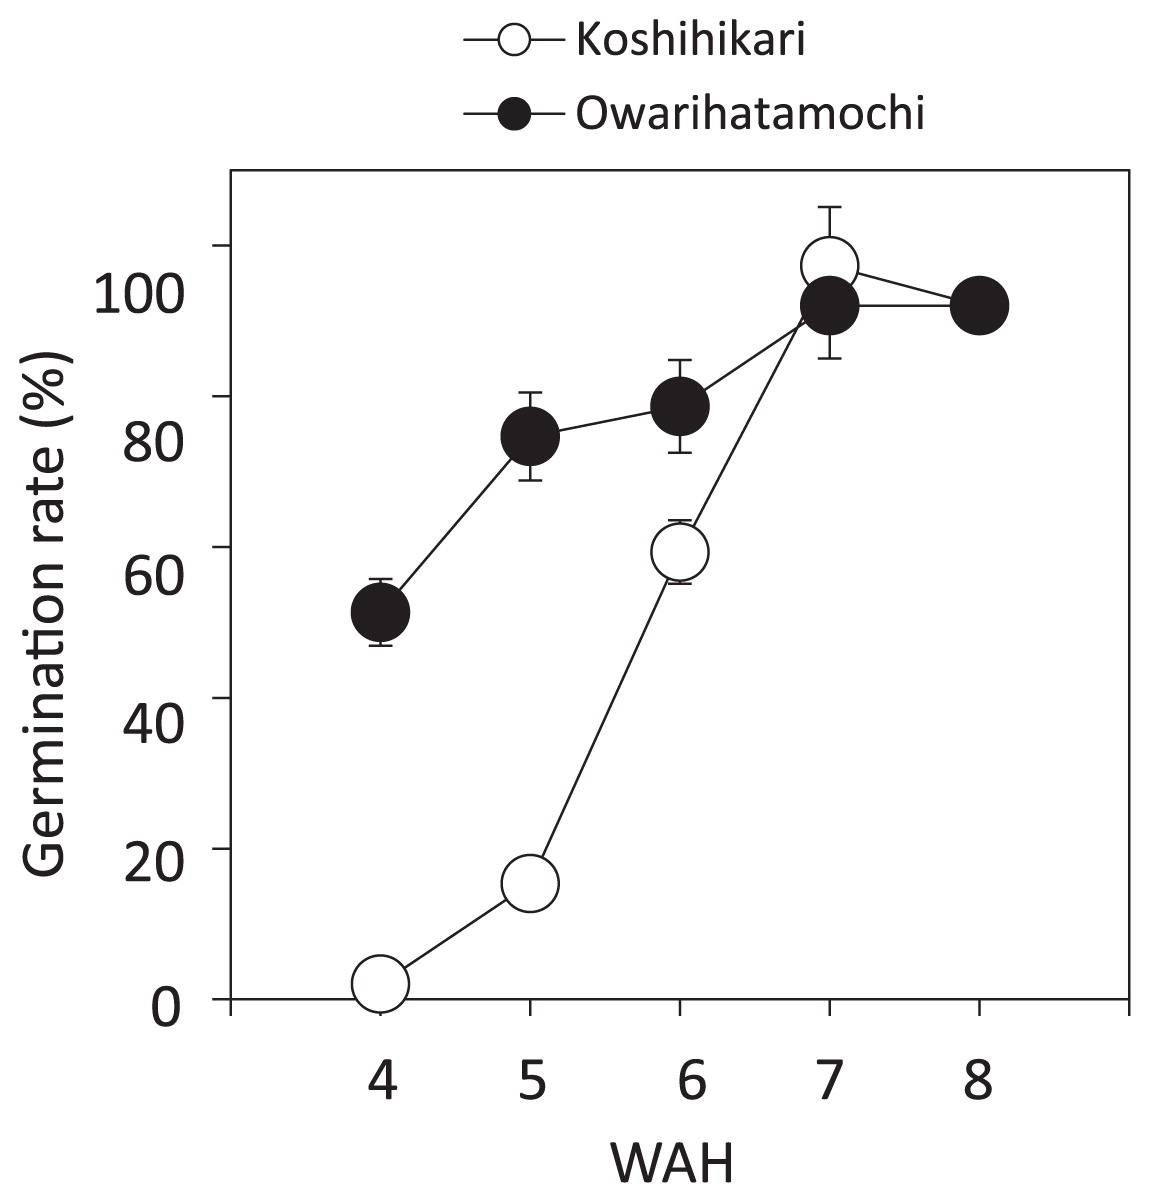
We investigated the germination rates of ‘Koshihikari’ and ‘Owarihatamochi’ every week from 4 to 8 WAH. Between 4 and 5 WAH the seeds of ‘Koshihikari’ went from dormancy to less than 20% germination, whereas those of ‘Owarihatamochi’ already had a high germination rate at 4 WAH (51%, Fig. 3). The germination rate of ‘Koshihikari’ increased to 59.3% in the period from 5 to 7 WAH, indicating that a transition from the dormant to the non-dormant state had occurred. At 8 WAH, the germination rates of both ‘Koshihikari’ and ‘Owarihatamochi’ were 92%. These results confirmed that the dormancy level of ‘Owarihatamochi’ was lower than that of ‘Koshihikari’.
To identify candidate chromosomal regions for seed dormancy, the germination rates of the parents and the 44 CSSLs were evaluated at 6 and 8 WAH (Fig. 4A, 4B). We first assigned putative QTLs for low and high PHS resistance on the donor’s chromosomes of a certain CSSL when germination rates significantly differed between the CSSL and the recurrent parent at P < 0.05, P < 0.01, or P < 0.001. Then we predicted the candidate regions for the PHS resistance QTLs on the basis of the association, among CSSLs, between the phenotype and the genotype within a certain chromosomal region. Putative QTLs were assigned in such a way as to maximize the number of CSSLs in which the phenotype could be explained by the genotype of that region (Supplemental Fig. 1).
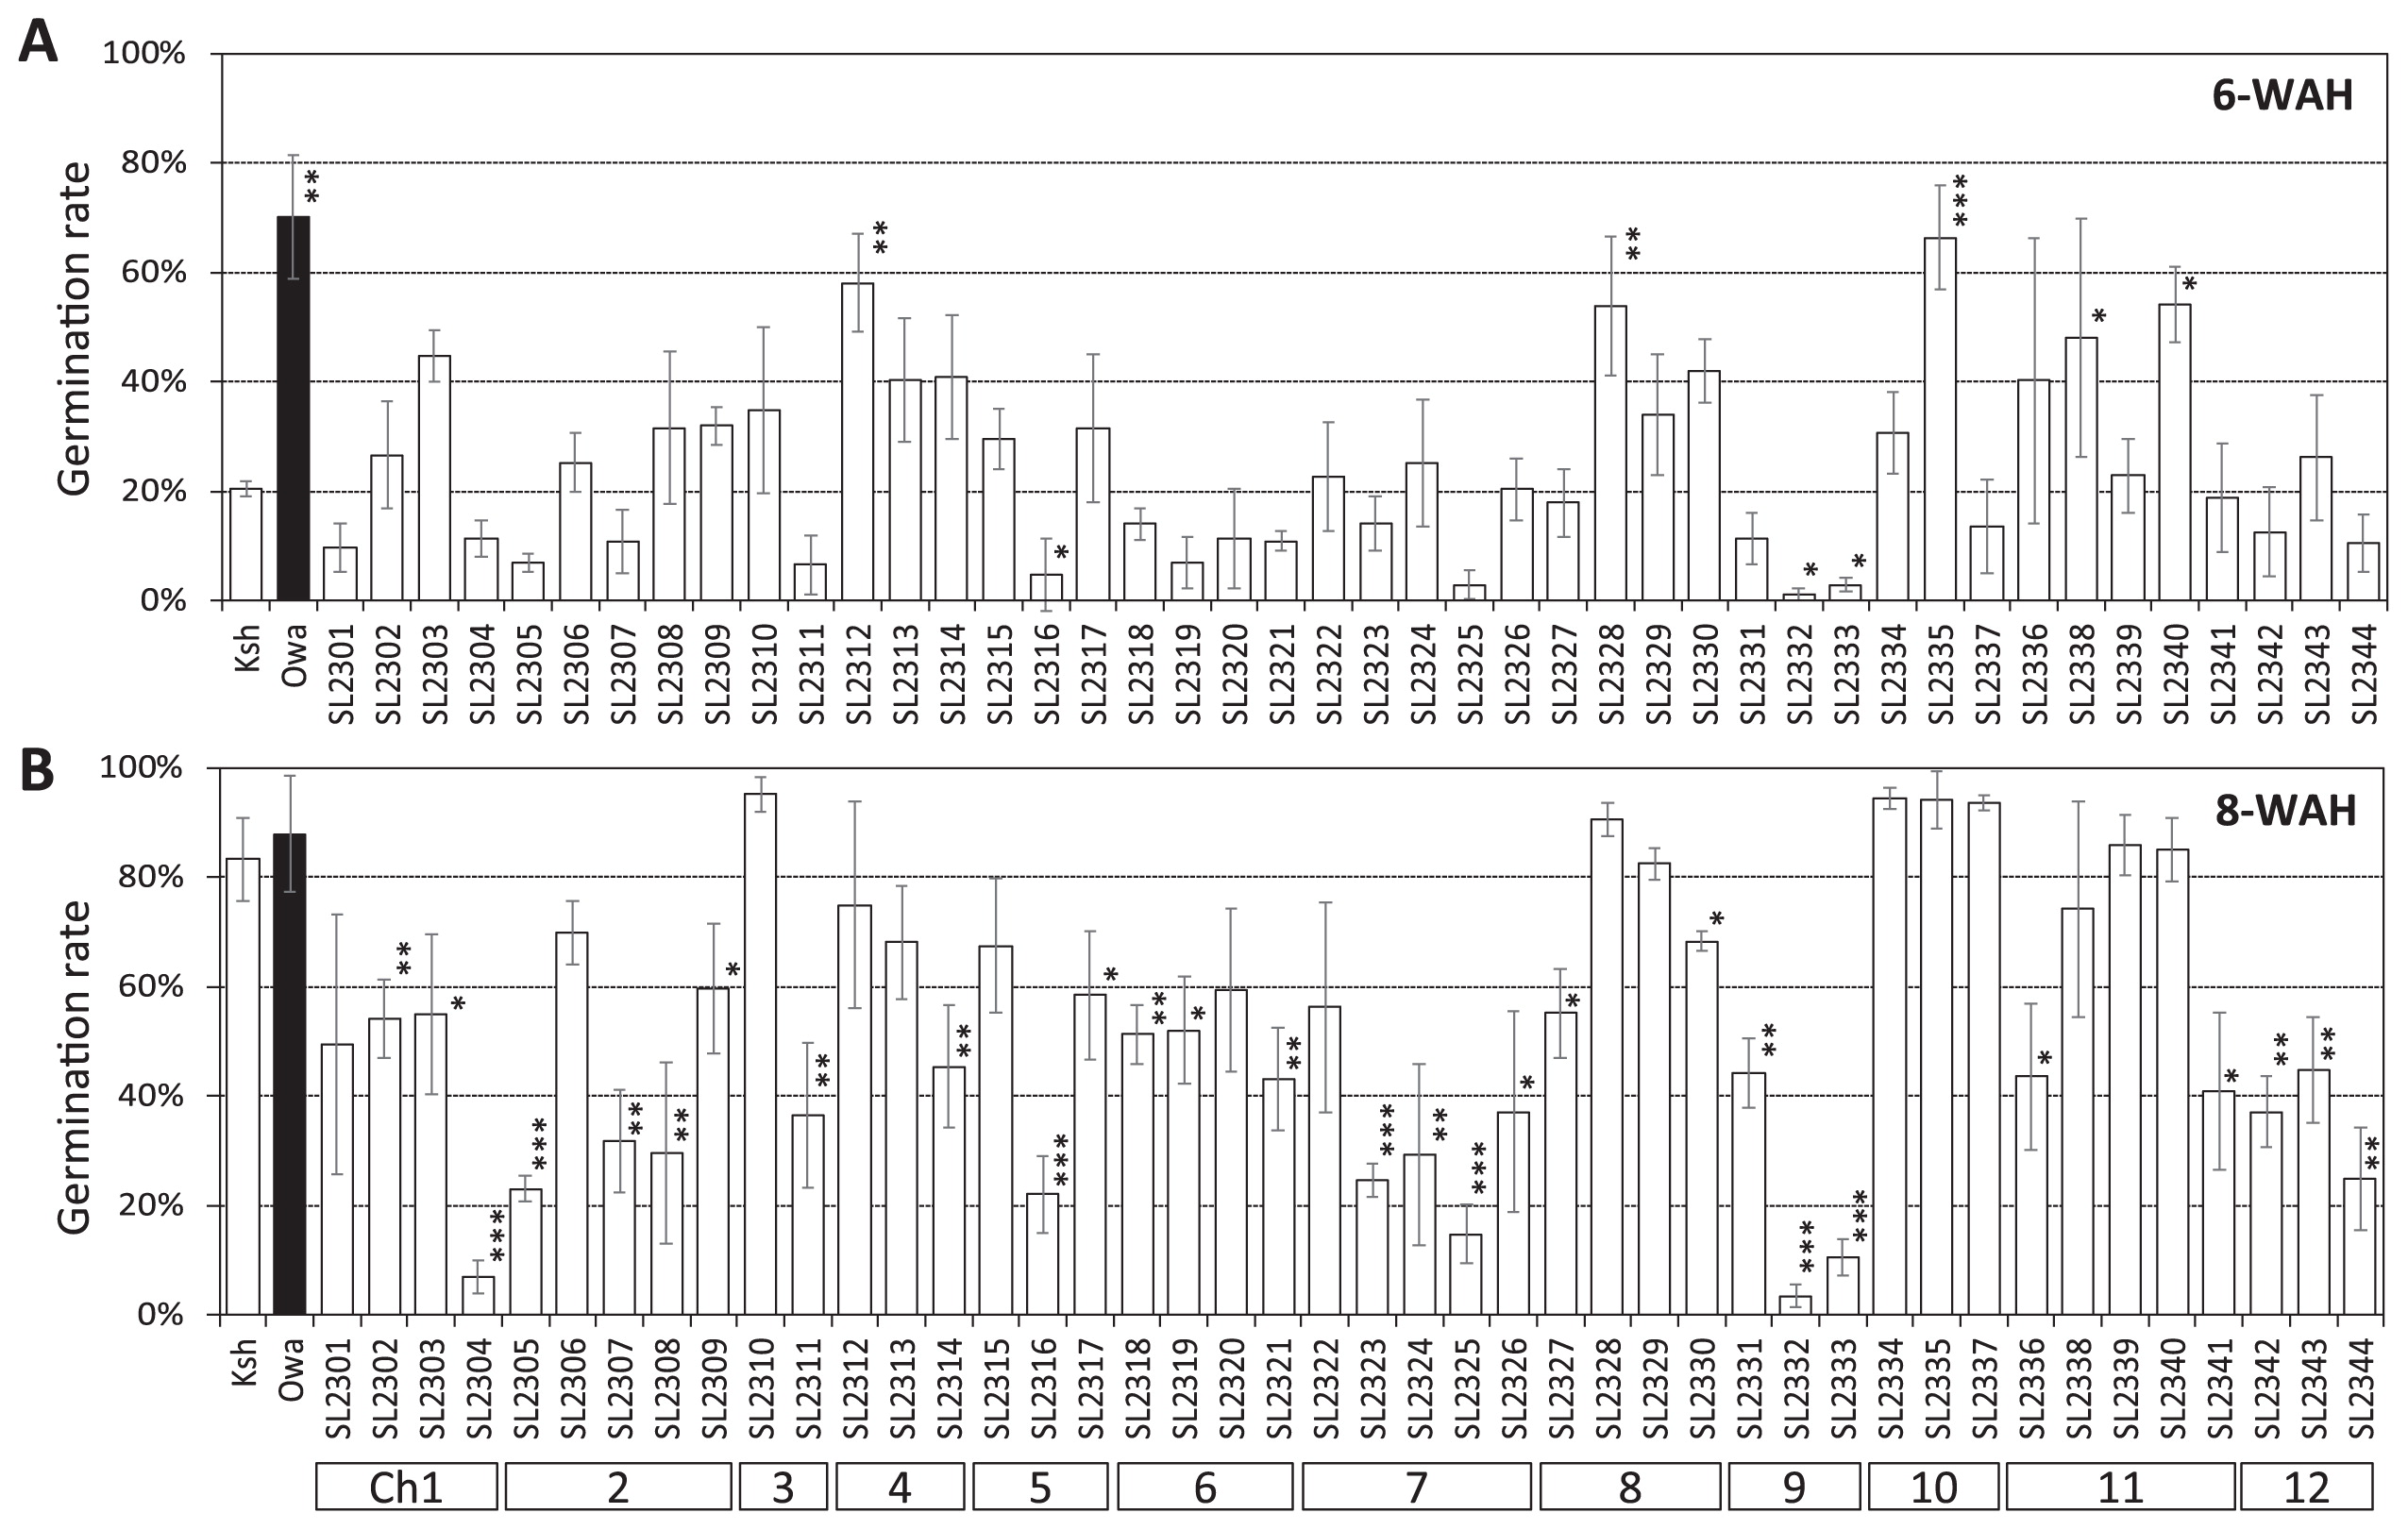
At 6 WAH, the germination rates of five CSSLs (SL2312, SL2328, SL2335, SL2338, and SL2340) were significantly higher than that of the ‘Koshihikari’ control (Student’s t-test, P < 0.05). The chromosome segment substitutions in these lines suggested that four chromosomal regions—on the short arm of chromosome 4, the short arm of chromosome 8, the central part of chromosome 10, and the long arm of chromosome 11—were associated with relatively low levels of PHS resistance.
At 8 WAH, the germination rates of ‘Koshihikari’ and ‘Owarihatamochi’ were 83.3% and 87.9%, respectively. At this time, a wide range of variation in germination rates was observed among the CSSLs, ranging from 3.4% to 95.1%. The germination rates of 27 CSSLs were significantly lower than that of the ‘Koshihikari’ control (Fig. 4B). PHS resistance QTL candidates were detected on all chromosomes except chromosome 10. The chromosome segment substitutions in these lines suggested that 16 chromosomal regions—two QTLs on chromosome 1, two QTLs on chromosome 2, one QTL on the end of the long arm of chromosome 3, one QTL on the end of the long arm of chromosome 4, one QTL in the central part of chromosome 5, two QTLs on chromosome 6, two QTLs on chromosome 7, one QTL on the end of the long arm of chromosome 8, two QTLs in the central part of chromosome 9, one QTL on the end of the long arm of chromosome 11, and one QTL on the long arm of chromosome 12 (Supplemental Fig. 1)—were associated with relatively high levels of PHS resistance. Among the CSSLs showing significantly higher levels of PHS resistance than in the recurrent parent, we were unable to find the regions explaining the effects of the substitutions in SL2327 and SL2336. The region substituted in SL2327 overlapped with those in SL2329. However, significantly higher levels of PHS resistance than in the recurrent parent was not found in SL2329. The region substituted in SL2336 overlapped with those in SL2338. However, significantly higher levels of PHS resistance than in the recurrent parent was not found in SL2338.
Among the QTL candidates detected, the putative QTLs on chromosome 9 exhibited the largest difference in allelic effects between ‘Koshihikari’ and ‘Owarihatamochi’ (Fig. 4); this and the results above suggested that the ‘Owarihatamochi’ allele increased the level of seed dormancy, thus increasing the level of PHS resistance.
Validation and fine mapping of QTLs for PHS resistance
We then performed further analyses (fine mapping and characterization) of the putative QTLs on chromosome 9 to validate the allelic effect. To validate the existence of the putative QTLs, we conducted a QTL analysis by using the BC4F2 population. A wide range of variation in germination rates was observed, and two QTLs were detected—in the intervals between SSR markers RM24103 and RM24126 and RM24353 and RM1189—on the long arm of chromosome 9 (Fig. 5A). These QTLs explained 6.1% and 9.2%, respectively, of the phenotypic variance in the F2 plants, and the presence of the ‘Owarihatamochi’ allele decreased the germination rate by 7.3% and 8.9%, respectively. These results verified the presence of the QTLs on the long arm of chromosome 9 and showed that the presence of the ‘Owarihatamochi’ allele at the QTLs decreased the germination rate. We designated the two QTLs qSDR9.1 (SEED DORMANCY 9.1) and qSDR9.2.

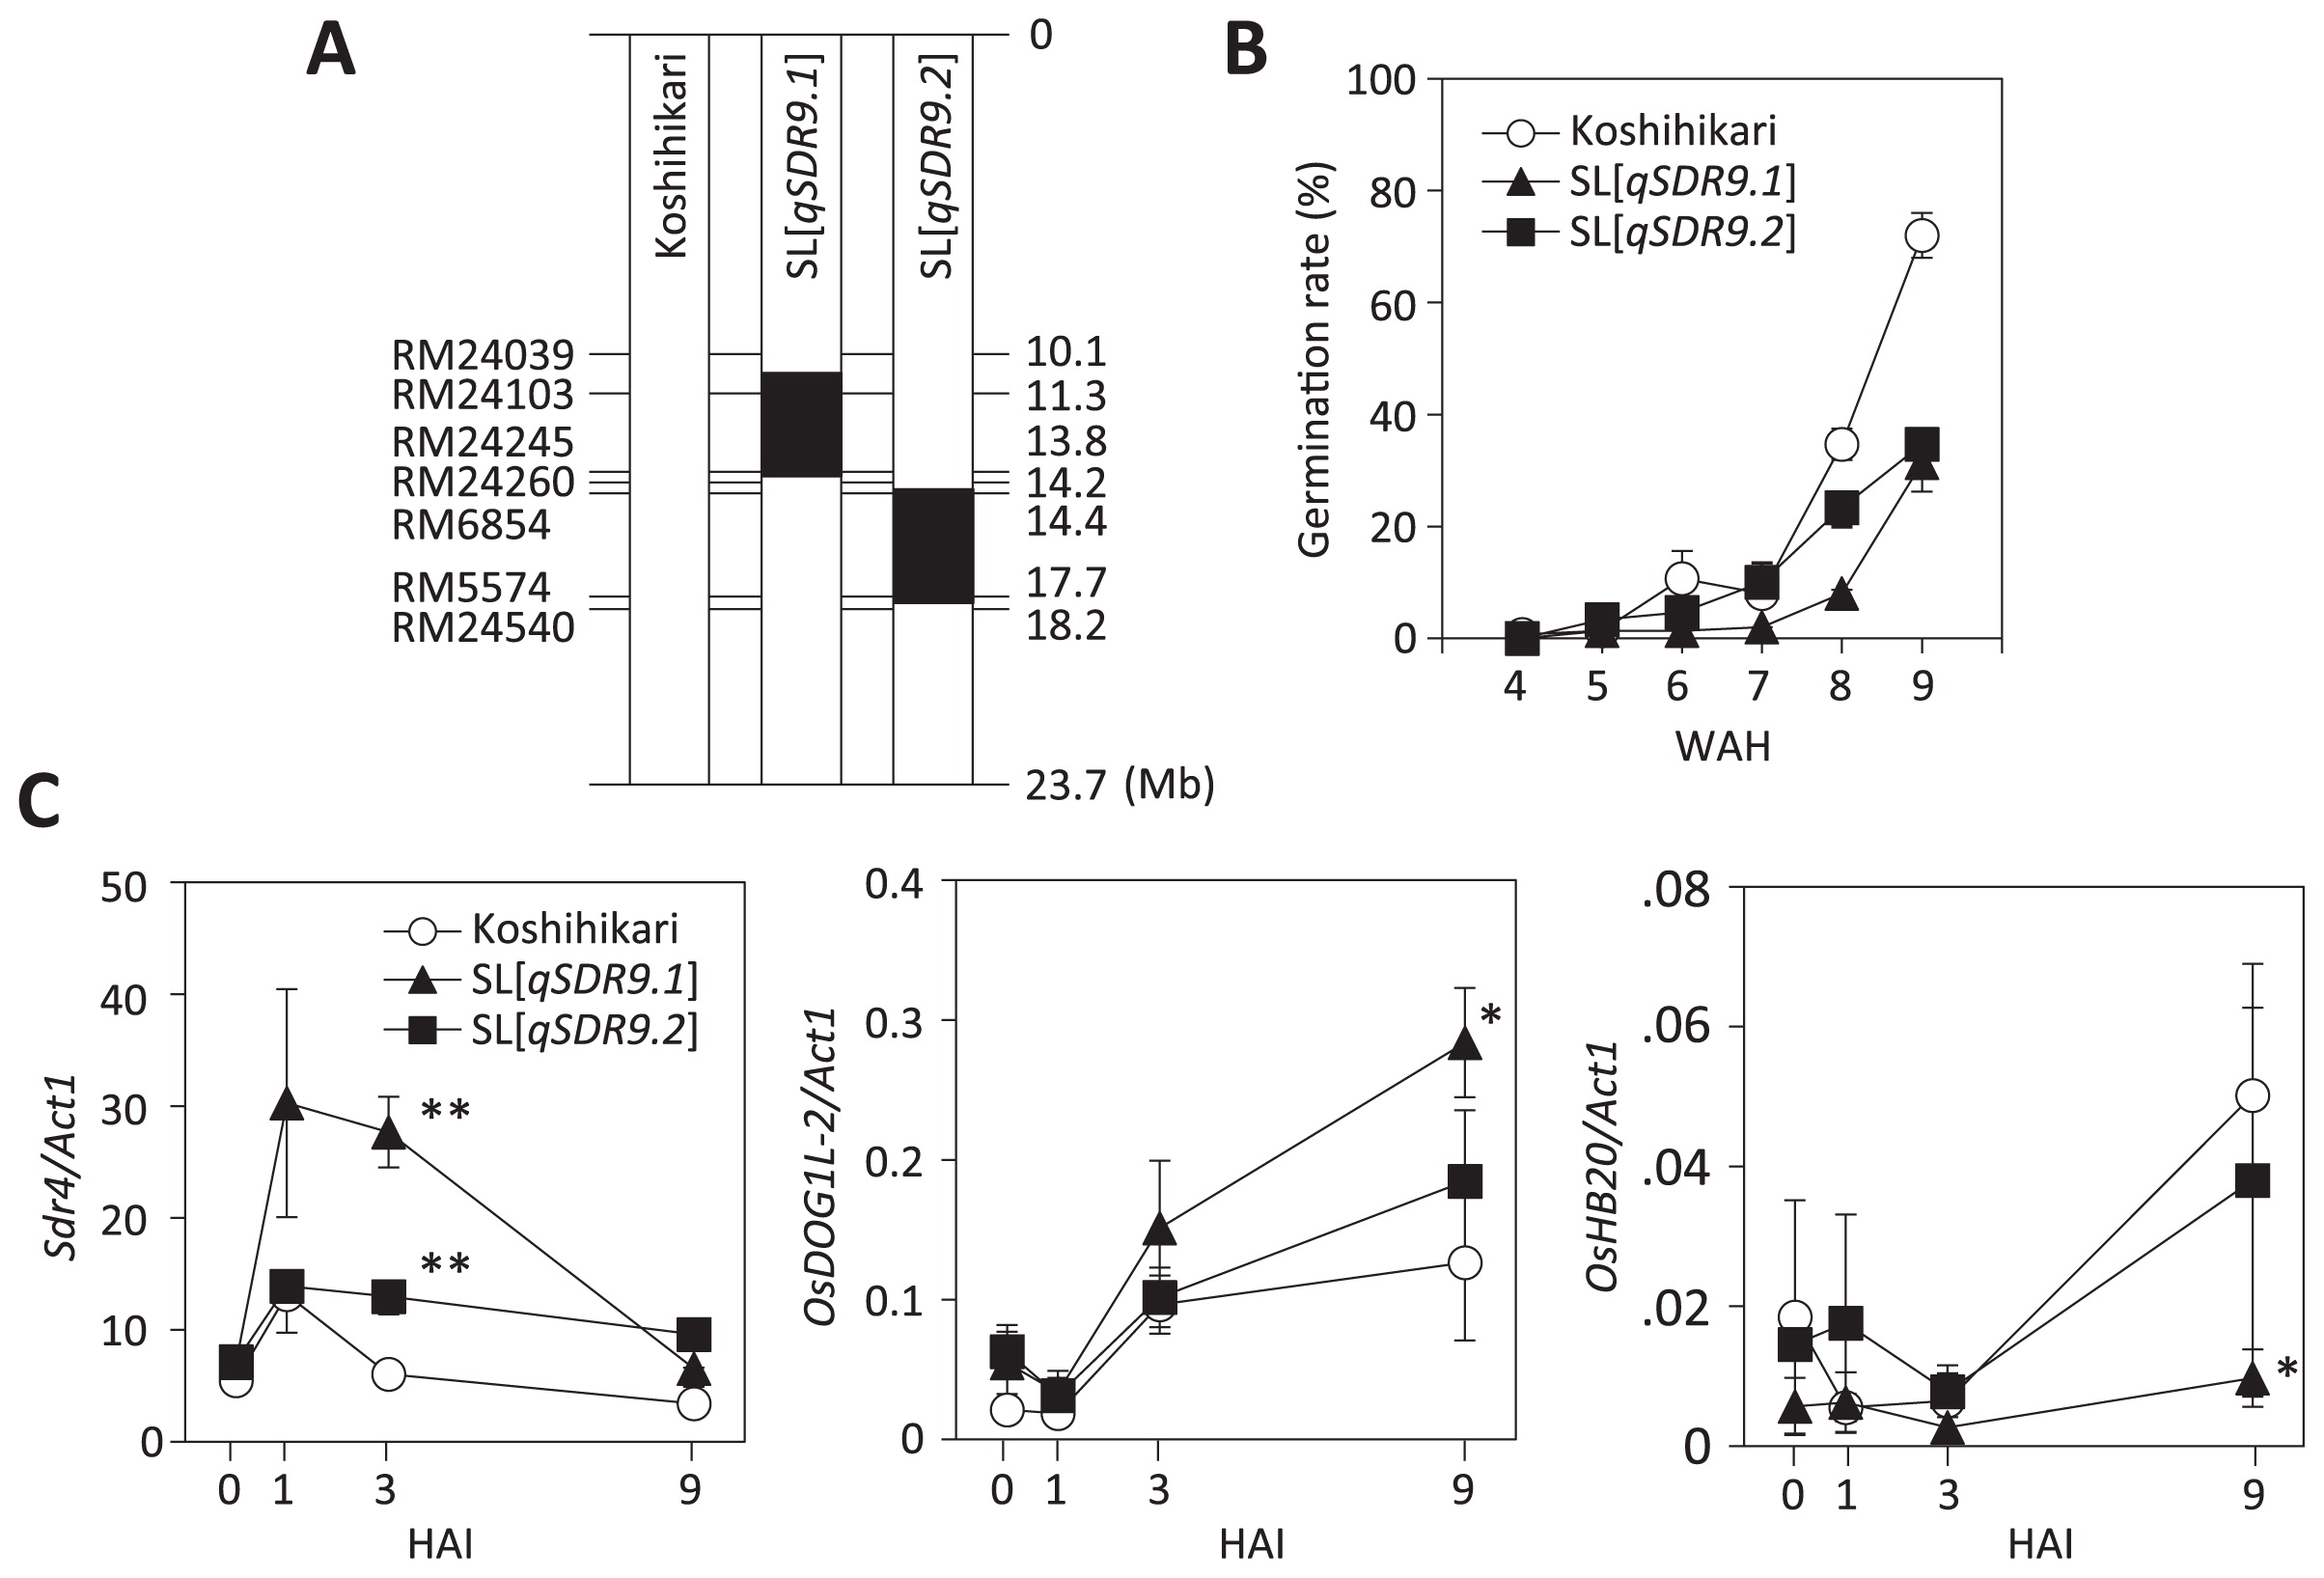
To further narrow down the candidate genomic regions of qSDR9.1 and qSDR9.2 on the long arm of chromosome 9, we performed fine mapping using a BC4F3 population. We developed seven recombinant pairs of BC4F3 lines (Fig. 5B). At 8.7% to 30.7%, the germination rates of six pairs—#5478, #5379, #5388, #5404, #5418, and #5389—harboring different ‘Owarihatamochi’ segments were significantly lower than those of the equivalent lines homozygous for the ‘Koshihikari’ allele (32.2% to 61.3%) at 9 WAH. However, #5400 harboring ‘Owarihatamochi’ segments had a significantly higher germination rate than the equivalent line homozygous for the ‘Koshihikari’ allele. The phenotypic variances of all seven pairs were significant (P < 0.05). Together, these results clearly delimited the candidate genomic region of qSDR9.1 to between SSR marker loci RM24039 and RM24260 (a 4.1-Mb interval in the ‘Nipponbare’ genome reference sequence) on chromosome 9 and that of qSDR9.2 to between Indel_2 and RM 24540 (2.3 Mb).
Characterization of qSDR9.1 and qSDR9.2
To elucidate the molecular functions of qSDR9.1 and qSDR9.2 within the known seed dormancy mechanism, we investigated the mRNA levels of dormancy-related genes (Sdr4 and OsDOG1L-2) in the embryo. To reduce noise from other chromosomal regions, we developed SLs carrying the ‘Owarihatamochi’ alleles of qSDR9.1 (SL[qSDR9.1]) and qSDR9.2 (SL[qSDR9.2]) in a ‘Koshihikari’ genetic background (Fig. 6A). The germination rates of SL[qSDR9.1] and SL[qSDR9.2] were lower than that of ‘Koshihikari’ at 8 and 9 WAH (Fig. 6B). Expression analysis revealed that the mRNA level of Sdr4 was significantly higher in SL[qSDR9.1] than in ‘Koshihikari’ 3 h after imbibition at 4 WAH (Fig. 6C). Likewise, OsDOG1L-2 mRNA was upregulated in SL[qSDR9.1] 9 h after imbibition. The expression of OsHB20, an ortholog of the Arabidopsis germination-promoting gene AtHB20, was reduced in SL[qSDR9.1] 9 h after imbibition (Fig. 6C). In contrast, the mRNA levels of Sdr4, OsDOG1L-2, and OsHB20 were not significantly altered in SL[qSDR9.2], except for a small but significant effect on Sdr4 gene expression 3 h after imbibition. It is therefore difficult to predict the probable function of qSDR9.1.
Discussion
Genetic dissection of seed dormancy in the Japanese upland rice ‘Owarihatamochi’
Because Japanese upland rice is planted by direct seeding, its breeding has been focused on germinability and seedling vigor to overcome competitors such as weeds. Furthermore, the field conditions for upland rice are drier than those in the paddies used for lowland rice. Under these environmental conditions and requirements, upland rice has not required PHS resistance. One Japanese upland rice cultivar, ‘Owarihatamochi’, exhibits weak PHS resistance (see Fig. 3). Here, we used an advanced backcross population derived from a cross between ‘Koshihikari’ and ‘Owarihatamochi’ (Fig. 3). We detected at least six putative QTL regions determining PHS resistance in the two cultivars. ‘Owarihatamochi’ had alleles with putative QTLs on chromosomes 4, 8, 10, and 11 associated with reduced PHS resistance; these alleles were likely dormant in ‘Koshihikari’. Sdr5 and qPHS-8 have been reported on chromosome 8 (Dong et al. 2003, Takeuchi et al. 2003) and qDOR11-3 to -6 and qSD-11 have been reported on chromosome 11 (Cai and Morishima 2000, Miura et al. 2002). The germination rates of 27 CSSLs were significantly (Student’s t-test, P < 0.05) lower than that of the ‘Koshihikari’ at 8 WAH (Fig. 4B). The candidate QTL region on chromosome 10 was predicted to be located between 14.0 and 15.1 Mb. We found here that OsHB20 was located in this region.
However, PHS resistance QTL candidates were detected on all chromosomes except chromosome 10. The reported QTLs qSD-1 and Sdr6 are colocalized on the short arm of chromosome 1; OsDOG1L-1, OsDOG1L-2, and qSD1-2 are also found in this region (Gu et al. 2004, Marzougui et al. 2012, Sugimoto et al. 2010, Ye et al. 2015). SD1, qPHS1, and qRGV1 have been found on the long arm of chromosome 1 (Dong et al. 2003, Lee et al. 2005). The QTL qRGV2 is colocalized with central part of chromosome 2 (Lee et al. 2005). The QTLs SD-3.2 and qPHS3-2, for which the most probable candidate gene is OsGA20ox-1 (Abe et al. 2012, Dong et al. 2003), are colocalized on the long arm of chromosome 3. The QTLs qPHS-4 and qSD4 (Dong et al. 2003, Gu et al. 2004) are located on chromosome 4. qDOR6-2, qSD6, Sdr9, and Sdr10 (Cai and Morishima 2000, Gu et al. 2006, Marzougui et al. 2012) are located on chromosome 6. The QTL qSD7-1/Rc (Gu et al. 2011) is located on the short arm of chromosome 7, and qSD-7, qSDn-7, qRVG1, and Sdr4 (Gu et al. 2004, Miura et al. 2002, Sugimoto et al. 2010, Wan et al. 2005, You et al. 2006) are found on the long arm. qDOR8 and qPSR8 have been reported on the long arm of chromosome 8 (Cai and Morishima 2000, Dong et al. 2003). Until now, no QTLs for seed dormancy had been reported on chromosomes 5 and 9. qSDn-11 (Wan et al. 2005), on the end of the long arm of chromosome 11, and qSD12 (Gu et al. 2010) on chromosome 12, have been reported. Since, SL2332 showed lowest germination rate, 3.4%, we considered that the priority of the QTLs on chromosome 9 were greater than that of other QTL candidates detected in the ‘Owarihatamochi’ genome. We therefore focused on the QTLs on chromosome 9 in our further analysis.
Of the 16 QTL candidates associated with PHS resistance that we detected across the genome, 4 candidates were not colocalized with reported QTLs as mentioned before, suggesting that ‘Owarihatamochi’, a tropical japonica upland rice, has large amount of natural variations in PHS resistance, including not yet been reported.
Comparison between previously reported QTLs and qSDR9.1 and qSDR9.2
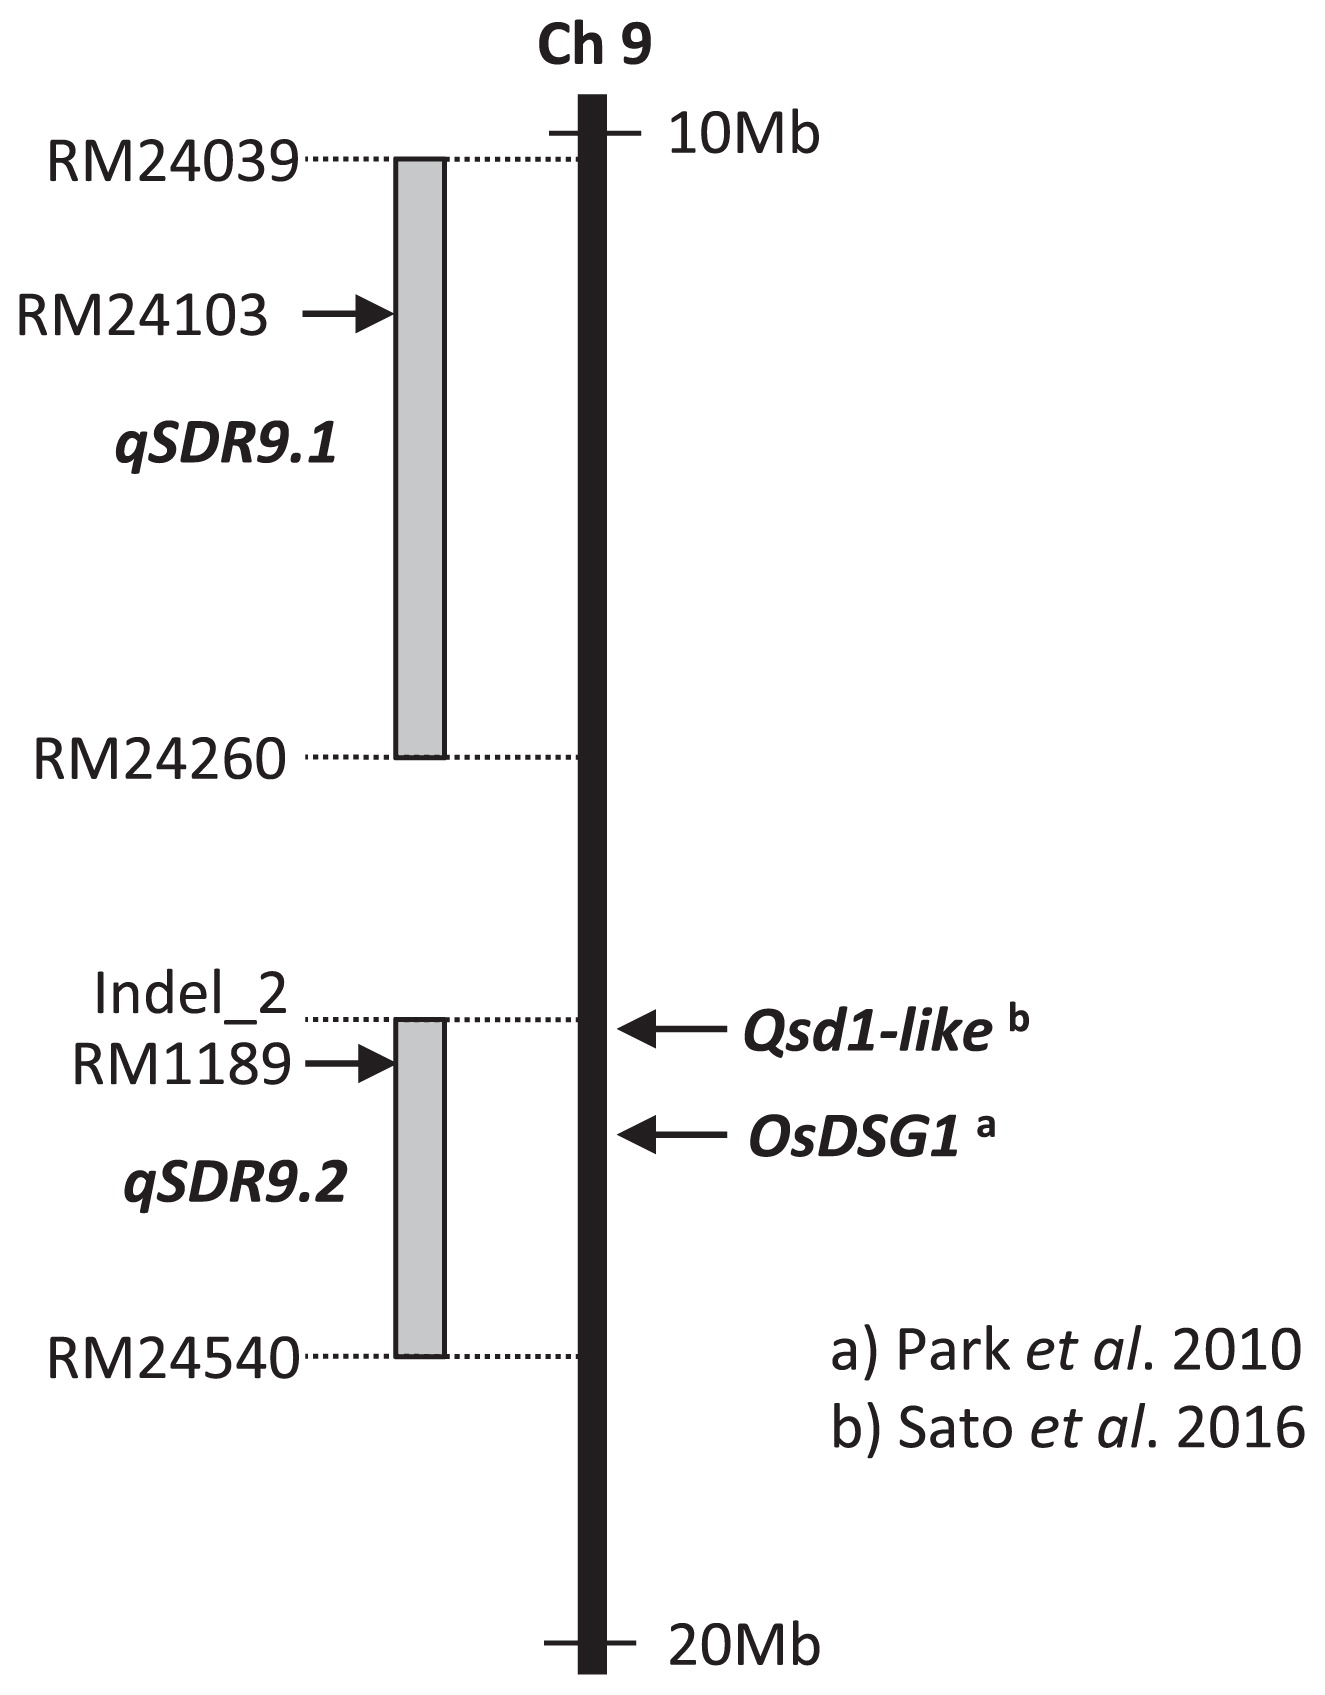
The candidate genomic regions of qSDR9.1 and qSDR9.2 were mapped to the intervals between marker loci RM24039 and RM24260 (4.1 Mb) and Indel_2 and RM24540 (2.3 Mb), respectively (Fig. 7). On the basis of data obtained from the QTL Annotation Rice Online Database [Q-TARO, http://qtaro.abr.affrc.go.jp/ (Yonemaru et al. 2010)], the candidate region of qSDR9.2 overlapped with the region in which Oryza sativa Delayed Seed Germination 1 (OsDSG1) is located (Park et al. 2010, Fig. 7). The osdsg1 mutant was originally identified by its delayed-germination phenotype from a population of T-DNA-tagging lines generated from the japonica cultivar Dongjin. OsDSG1 is a rice ortholog of Arabidopsis AIP2, which encodes an E3 ligase that negatively regulates ABI3 (Zhang et al. 2005). Likewise, OsDSG1 encodes a RING finger E3 ligase that negatively regulates OsVP1, which is a rice homolog of Arabidopsis ABI3 (Hattori et al. 1994). The recently reported barley PHS resistance gene, Qsd1, encodes an alanine aminotransferase and may regulate the metabolism of glutamate (Sato et al. 2016). The ortholog of Qsd1 is Os09g0433900. It is located within the candidate region of qSDR9.2 (Fig. 7). Although the above-mentioned genes are probable candidates for qSDR9.2, additional work needs to be done to clone the gene at qSDR9.2. The other QTL, qSDR9.1, was not colocalized with any reported seed dormancy or PHS resistance QTLs.
Expression analysis of several dormancy- and germination-related genes using SL[qSDR9.1] revealed that the mRNA levels of Sdr4 and OsDOG1L-2 were higher in SL[qSDR9.1] than in ‘Koshihikari’ 1 and 9 h, respectively, after imbibition at 4 WAH (Fig. 6C). This result suggests that the gene underlying qSDR9.1 acts upstream of Sdr4 and OsDOG1L-2 and provides PHS resistance by positively regulating these genes upon imbibition. In Arabidopsis, DOG1 protein levels are stably high in freshly harvested and after-ripened seeds, although the abundance of active DOG1 protein is potentially reduced in after-ripened seeds through a post-translational modification (Nakabayashi et al. 2012). Dormancy release is expected to involve DOG1 inactivation, probably through oxidation of the protein (Nakabayashi et al. 2012). We can therefore speculate that, if there is increased production of Sdr4 and OsDOG1L-2 in seeds that are dormant at 4 WAH, then imbibition will contribute to dormancy-related protein accumulation and elongation of the dormancy period after ripening. Unlike the case with SL[qSDR9.1], with SL[qSDR9.2] there was no significant difference in Sdr4 and OsDOG1L-2 mRNA levels compared with those in the ‘Koshihikari’ control. Therefore, it is difficult to speculate on a putative model involving qSDR9.2.
To our knowledge, this report is the first example of PHS resistance QTL identification in Japanese upland rice, which showed shallow dormancy. The reason why so many PHS resistance QTLs, including qSDR9.1 and 9.2, were detected in the Japanese upland rice used here needs to be clarified by analyses using other upland rice cultivars. Accumulation of information on the genetic effects of PHS resistance QTLs, along with the cloning of qSDR9.1 and qSDR9.2, may uncover the reason behind this abundance in QTLs and shed light on the stacking of the many relevant alleles. Ultimately it will help us to effectively fine-tune PHS resistance in practical rice breeding.
Acknowledgments
This work was supported by grants from the Ministry of Agriculture, Forestry, and Fisheries of Japan (Genomics-based Technology for Agricultural Improvement, IVG2003 and IVG3003).
Literature Cited
- Abe, A., H. Takagi, T. Fujibe, K. Aya, M. Kojima, H. Sakakibara, A. Uemura, M. Matsuoka and R. Terauchi (2012) OsGA20ox1, a candidate gene for a major QTL controlling seedling vigor in rice. Theor. Appl. Genet. 125: 647–657.
- Barrero, J.M., A.A. Millar, J. Griffiths, T. Czechowski, W.R. Scheible, M. Udvardi, J.B. Reid, J.J. Ross, J.V. Jacobsen and F. Gubler (2010) Gene expression profiling identifies two regulatory genes controlling dormancy and ABA sensitivity in Arabidopsis seeds. Plant J. 61: 611–622.
- Bentsink, L., J. Jowett, C.J. Hanhart and M. Koornneef (2006) Cloning of DOG1, a quantitative trait locus controlling seed dormancy in Arabidopsis. Proc. Natl. Acad. Sci. USA 103: 17042–17047.
- Cai, W. and H. Morishima (2000) Genomic regions affecting seed shattering and seed dormancy in rice. Theor. Appl. Genet. 100: 840–846.
- Chen, C.X., S.B. Cai and G.H. Bai (2008) A major QTL controlling seed dormancy and pre-harvest sprouting resistance on chromosome 4A in a Chinese wheat landrace. Mol. Breed. 21: 351–358.
- Dong, Y., E. Tsuzuki, H. Kamiunten, H. Terao, D. Lin, M. Matsuo and Y. Zheng (2003) Identification of quantitative trait loci associated with pre-harvest sprouting resistance in rice (Oryza sativa L.). Field Crops Res. 81: 133–139.
- Flintham, J., R. Adlam, M. Bassoi, M. Holdsworth and M. Gale (2002) Mapping genes for resistance to sprouting damage in wheat. Euphytica 126: 39–45.
- Footitt, S., K. Müller, A.R. Kermode and W.E. Finch-Savage (2015) Seed dormancy cycling in Arabidopsis: chromatin remodelling and regulation of DOG1 in response to seasonal environmental signals. Plant J. 81: 413–425.
- Gao, F.Y., G.J. Ren, X.J. Lu, S.X. Sun, H.J. Li, Y.M. Gao, H. Luo, W.G. Yan and Y.Z. Zhang (2008) QTL analysis for resistance to preharvest sprouting in rice (Oryza sativa). Plant Breed. 127: 268–273.
- Gao, W., J.A. Clancy, F. Han, D. Prada, A. Kleinhofs and S.E. Ullrich (2003) Molecular dissection of a dormancy QTL region near the chromosome 7 (5H) L telomere in barley. Theor. Appl. Genet. 107: 552–559.
- Gu, X.Y., S.F. Kianian and M.E. Foley (2004) Multiple loci and epistases control genetic variation for seed dormancy in weedy rice (Oryza sativa). Genetics 166: 1503–1516.
- Gu, X.Y., T. Liu, J. Feng, J.C. Suttle and J. Gibbons (2010) The qSD12 underlying gene promotes abscisic acid accumulation in early developing seeds to induce primary dormancy in rice. Plant Mol. Biol. 73: 97–104.
- Gu, X.Y., M.E. Foley, D.P. Horvath, J.V. Anderson, J. Feng, L. Zhang, C.R. Mowry, H. Ye, J.C. Suttle, K. Kadowaki et al. (2011) Association between seed dormancy and pericarp color is controlled by a pleiotropic gene that regulates abscisic acid and flavonoid synthesis in weedy red rice. Genetics 189: 1515–1524.
- Gualano, N.A. and R.L. Benech-Arnold (2009) Predicting pre-harvest sprouting susceptibility in barley: looking for “sensitivity windows” to temperature throughout grain filling in various commercial cultivars. Field Crops Res. 114: 35–44.
- Guo, L., L. Zhu, Y. Xu, D. Zeng, P. Wu and Q. Qian (2004) QTL analysis of seed dormancy in rice (Oryza sativa L.). Euphytica 140: 155–162.
- Hattori, T., T. Terada and S.T. Hamasuna (1994) Sequence and functional analyses of the rice gene homologous to the maize Vp1. Plant Mol. Biol. 24: 805–810.
- Holdsworth, M.J., L. Bentsink and W.J. Soppe (2008) Molecular networks regulating Arabidopsis seed maturation, after-ripening, dormancy and germination. New Phytol. 179: 33–54.
- Hori, K., K. Sugimoto, Y. Nonoue, N. Ono, K. Matsubara, U. Yamanouchi, A. Abe, Y. Takeuchi and M. Yano (2010) Detection of quantitative trait loci controlling pre-harvest sprouting resistance by using backcrossed populations of japonica rice cultivars. Theor. Appl. Genet. 120: 1547–1557.
- Kosambi, D.D. (1944) The estimation of map distance from recombination values. Ann. Eugen. 12: 172–175.
- Jennings, P.R. and J.D. Jesus Jr. (1964) Effect of heat on breaking dormancy in rice. Crop Sci. 4: 530–533.
- Lander, E.S., P. Green, J. Abrahamson, A. Barlow, M.J. Daly, S.E. Lincoln and L.A. Newberg (1987) MAPMAKER: an interactive computer package for constructing primary genetic linkage maps of experimental and natural populations. Genomics 1: 174–181.
- Lee, S.J., C.S. Oh, J.P. Suh, S.R. McCouch and S.N. Ahn (2005) Identification of QTLs for domestication-related and agronomic traits in an Oryza sativa × O. rufipogon BC1F7 population. Plant Breed. 124: 209–219.
- Lin, S.Y., T. Sasaki and M. Yano (1998) Mapping quantitative trait loci controlling seed dormancy and heading date in rice, Oryza sativa L., using backcross inbred lines. Theor. Appl. Genet. 96: 997–1003.
- Liu, S. and G. Bai (2010) Dissection and fine mapping of a major QTL for preharvest sprouting resistance in white wheat Rio Blanco. Theor. Appl. Genet. 121: 1395–1404.
- Magwa, R.A., H. Zhao and Y. Xing (2016) Genome-wide association mapping revealed a diverse genetic basis of seed dormancy across subpopulations in rice (Oryza sativa L.). BMC Genet. 17: 28.
- Marzougui, S., K. Sugimoto, U. Yamanouchi, M. Shimono, T. Hoshino, K. Hori, M. Kobayashi, K. Ishiyama and M. Yano (2012) Mapping and characterization of seed dormancy QTLs using chromosome segment substitution lines in rice. Theor. Appl. Genet. 124: 893–902.
- Miura, K., S.Y. Lin, M. Yano and T. Nagamine (2002) Mapping quantitative trait loci controlling seed longevity in rice (Oryza sativa L.). Theor. Appl. Genet. 104: 981–986.
- Molitor, A.M., Z. Bu, Y. Yu and W.H. Shen (2014) Arabidopsis AL PHD-PRC1 complexes promote seed germination through H3K4me3-to-H3K27me3 chromatin state switch in repression of seed developmental genes. PLoS Genet. 10: e1004091.
- Müller, K., D. Bouyer, A. Schnittger and A.R. Kermode (2012) Evolutionarily conserved histone methylation dynamics during seed life-cycle transitions. PLoS ONE 7: e51532.
- Nagasaki, H., K. Ebana, T. Shibaya, J. Yonemaru and M. Yano (2010) Core single-nucleotide polymorphisms—a tool for genetic analysis of the Japanese rice population. Breed. Sci. 60: 648–655.
- Nakabayashi, K., M. Bartsch, Y. Xiang, E. Miatton, S. Pellengahr, R. Yano, M. Seo and W.J. Soppe (2012) The time required for dormancy release in Arabidopsis is determined by DELAY OF GERMINATION1 protein levels in freshly harvested seeds. Plant Cell 24: 2826–2838.
- Nakabayashi, K., M. Bartsch, J. Ding and W.J. Soppe (2015) Seed dormancy in Arabidopsis requires self-binding ability of DOG1 protein and the presence of multiple isoforms generated by alternative splicing. PLoS Genet. 11: e1005737.
- Nakamura, S., F. Abe, H. Kawahigashi, K. Nakazono, A. Tagiri, T. Matsumoto, S. Utsugi, T. Ogawa, H. Handa, H. Ishida et al. (2011) A wheat homolog of MOTHER OF FT AND TFL1 acts in the regulation of germination. Plant Cell 23: 3215–3229.
- Nakamura, S., M. Pourkheirandish, H. Morishige, Y. Kubo, M. Nakamura, K. Ichimura, S. Seo, H. Kanamori, J. Wu, T. Ando et al. (2016) Mitogen-Activated Protein Kinase Kinase 3 regulates seed dormancy in barley. Curr. Biol. 26: 775–781.
- Park, G.G., J.J. Park, J. Yoon, S.N. Yu and G. An (2010) A RING finger E3 ligase gene, Oryza sativa Delayed Seed Germination 1 (OsDSG1), controls seed germination and stress responses in rice. Plant Mol. Biol. 74: 467–478.
- Sasaki, T. (1974) Studies on breeding for the germinability at low temperature of rice varieties adapted to direct sowing cultivation in flooded paddy field in cool region. Rep. Hokkaido Prefect. Agric. Exp. Stn. 24: 1–90.
- Sato, K., M. Yamane, N. Yamaji, H. Kanamori, A. Tagiri, J.G. Schwerdt, G.B. Fincher, T. Matsumoto, K. Takeda and T. Komatsuda (2016) Alanine aminotransferase controls seed dormancy in barley. Nat. Commun. 7: 11625.
- Sugimoto, K., Y. Takeuchi, K. Ebana, A. Miyao, H. Hirochika, N. Hara, K. Ishiyama, M. Kobayashi, Y. Ban, T. Hattori et al. (2010) Molecular cloning of Sdr4, a regulator involved in seed dormancy and domestication of rice. Proc. Natl. Acad. Sci. USA 107: 5792–5797.
- Takeuchi, Y., S.Y. Lin, T. Sasaki and M. Yano (2003) Fine linkage mapping enables dissection of closely linked quantitative trait loci for seed dormancy and heading in rice. Theor. Appl. Genet. 107: 1174–1180.
- Thomson, M.J., T.H. Tai, A.M. McClung, X.H. Lai, M.E. Hinga, K.B. Lobos, Y. Xu, C.P. Martinez and S.R. McCouch (2003) Mapping quantitative trait loci for yield, yield components and morphological traits in as advanced backcross population between Oryza rufipogon and the Oryza sativa cultivar Jefferson. Theor. Appl. Genet. 107: 479–493.
- Torada, A., M. Koike, T. Ogawa, Y. Takenouchi, K. Tadamura, J. Wu, T. Matsumoto, K. Kawaura and Y. Ogihara (2016) A causal gene for seed dormancy on wheat chromosome 4A encodes a MAP kinase kinase. Curr. Biol. 26: 782–787.
- Ullrich, S.E., J.A. Clancy, I.A. del Blanco, H. Lee, V.A. Jitkov, F. Han, A. Kleinhofs and K. Matsui (2008) Genetic analysis of preharvest sprouting in a six-row barley cross. Mol. Breed. 21: 249–259.
- Wan, J.M., Y.J. Cao, C.M. Wang and H. Ikehashi (2005) Quantitative trait loci associated with seed dormancy in rice. Crop Sci. 45: 712–716.
- Wang, S., C.J. Basten and Z.B. Zeng (2005) Windows QTL Cartographer 2.5. Department of Statistics, North Carolina State University, Raleigh. http://statgen.ncsu.edu/qtlcart/WQTLCart.htm
- Ye, H., J. Feng, L. Zhang, J. Zhang, M.S. Mispan, Z. Cao, D.H. Beighley, J. Yang and X.Y. Gu (2015) Map-based cloning of seed dormancy1–2 identified a gibberellin synthesis gene regulating the development of endosperm-imposed dormancy in rice. Plant Physiol. 169: 2152–2165.
- Yonemaru, J., T. Yamamoto, S. Fukuoka, Y. Uga, K. Hori and M. Yano (2010) Q-TARO: QTL Annotation Rice Online database. Rice 3: 194–203.
- You, J., Q. Li, B. Yue, W.Y. Xue, L.J. Luo and L.Z. Xiong (2006) Identification of quantitative trait loci for ABA sensitivity at seed germination and seedling stages in rice. Acta Genetica Sinica 33: 532–541.
- Zhang, X., V. Garreton and N.H. Chua (2005) The AIP2 E3 ligase acts as a novel negative regulator of ABA signaling by promoting ABI3 degradation. Genes Dev. 19: 1532–1543.
- Zheng, J., F. Chen, Z. Wang, H. Cao, X. Li, X. Deng, W.J. Soppe, Y. Li and Y. Liu (2012) A novel role for histone methyltransferase KYP/SUVH4 in the control of Arabidopsis primary seed dormancy. New Phytol. 193: 605–616.