Abstract
Pepper (Capsicum) is one of the most important vegetable and spice crops. Aphid-transmitted cucumber mosaic virus (CMV) causes significant damage to pepper crops across the world. The genetic basis of CMV resistance in pepper is complex, and the mechanisms underlying resistance remain largely unknown. Here, we employed a SLAF-seq approach to generate a high-density genetic map of pepper. The map spanned 1,785.46 cM, containing 12,727 markers on 12 chromosomes, with a mean marker distance of 0.16 cM between adjacent markers. We used this map and the interval mapping (IM) and multiple QTL mapping (MQM) procedures to detect genetic regions associated with quantitative trait for CMV resistance. Three QTLs, qcmv11.1, qcmv11.2 and qcmv12.1, conferred resistance to CMV and showed trait variation of 10.2%, 19.2% and 7.3% respectively. Our results will help to develop markers linked to CMV-resistant QTLs to improve pepper resistance to CMV.
Introduction
Pepper (Capsicum) is an important vegetable and spice crop, with 34.6 million tons fresh fruit and 3.5 million tons dried pods harvested from 3.9 million hectares across the world in the year 2011 (Food and Agriculture Organization, www.fao.org). Viral diseases often threaten pepper production, and the aphid-transmitted cucumber mosaic virus (CMV) is the most common viral diseases (Kang et al. 2010). CMV can cause severe systemic mosaic symptoms including leaf distortion and fruit lesion, and can dramatically reduce the marketable yield of pepper (Chaim et al. 2001, Palukaitis et al. 1992). Therefore, developing CMV resistant lines will help prevent crop damage and loss.
Most of the genetic mapping studies of CMV resistance in pepper plants suggest that the trait is controlled by multiple loci, and different sources exhibit different inheritable models of resistance to CMV (Grube et al. 2000, Suzuki et al. 2003). QTLs studies of CMV resistance have identified a varying number major and minor of QTLs in C. annuum cv. ‘Perennial’ (Caranta et al. 1997), and two major and several minor QTLs in C. annuum line ‘BJ0747-1-3-1-1’ (Yao et al. 2013). Recent studies have identified specific genic regions conferring CMV resistance, such as cmvP1-5.1 and cmvP1-10.1 in CMVP1-resistant C. annuum line ‘A1’ (Min et al. 2016), qCmr2.1 and qCmr11.1 in C. frutescens cv. PBC688 (Guo et al. 2016). Additionally, a single dominant gene Cmr1 on the second chromosome was found to confer resistance against CMVKorean and CMVFNY strains in the C. annuum cultivar ‘Bukang’ (Kang et al. 2010). Taking results of genetic mapping of CMV resistance in pepper from various groups suggest that CMV resistance is a complex genetic trait (Yao et al. 2013). However, only a few linked markers have been tied to CMV resistance, which is caused by the low coverage of the linkage markers, leading to QTLs that cover large chromosomal regions. Therefore, a high-density genetic linkage map is likely to significantly improve the chances of QTL fine mapping.
The advances of next-generation sequencing (NGS) technologies by whole-genome resequencing (WGRS), restriction site-associated DNA sequencing (RAD-seq) (Baird et al. 2008), genotyping-by-sequencing (GBS) (Baird et al. 2008, Poland et al. 2012) and sequence-based genotyping (SBG) (Truong et al. 2012) have provided unprecedented means to identify a large number of genetic markers throughout the genome to construct high-density genetic maps. Similar to other methods that have been developed for increasing high-throughput SNP discovery, specific length amplified fragment sequencing (SLAF-seq), which discovers de novo SNPs using high-throughput sequencing (Sun et al. 2013), has been successfully applied to create high-density genetic maps in several plant species, including sesame (Zhang et al. 2013), cucumber (Wei et al. 2014, Xu et al. 2014), soybean (Li et al. 2014, Qi et al. 2014, Zhang et al. 2016a) and wax gourd (Jiang et al. 2015).
In a previous study, F2 and back-cross populations derived from a cross between C. annuum inbred line ‘BJ0747-1-3-1-1’ (resistant female parent) and C. annuum inbred line ‘XJ0630-2-1-2-1-1’ (susceptible male parent) were used to identify QTLs for CMV resistance (Yao et al. 2013) using a low-density genetic map, therefore the QTLs were localized to large chromosomal regions. Here, we employed a SLAF-seq approach to generate a high-density genetic map using the same population as Yao et al. (2013) to refine and discover QTLs for CMV resistance, and aid molecular marker-assisted (MAS) breeding to improve pepper crop quality.
Materials and Methods
Mapping population and DNA extraction
Pepper inbred line ‘BJ0747-1-3-1-1’ (‘BJ0747’ for short) was previously identified as CMV-resistant (Yao et al. 2013). ‘XJ0630-2-1-2-1-1’ (‘XJ0630’ for short) is a CMV-susceptible inbred line. The resistant line ‘BJ0747’ and the susceptible line ‘XJ0630’ were crossed to generate F1 offspring, which were then self-pollinated to generate F2 with a segregating population of 195 individuals. Each F2 was self-pollinated to generate F2:3 families.
Young leaves from the two parental lines and the 195 F2 progeny were collected, and genomic DNA was extracted by a modified CTAB method (Murray and Thompson 1980). DNA was quantified using a Micro-Spectrophotometer (K5500, KaiAo, Beijing, China), and quality of total DNA was verified by agarose gels electrophoresis with a lambda DNA standard (GelDoc XR System, Bio-Rad, USA).
Virus strain, inoculation methods and phenotypic evaluation
The CMVHB-jz strain, which was isolated from a major pepper production area in Jingzhou City, Hubei Province, was gifted by Dr. Li Cai (College of Plant Science & Technology of Huazhong Agricultural University). CMV-inoculation was performed as previously (Yao et al. 2013) with modifications. 0.5 g leaves of CMV infected Nicotiana tabacum cv. Samsun NN were ground in 5 mL of 0.1 M phosphate buffer (pH 7.2) to prepare the inoculums. Pepper seedlings at the four true leaf stage were dusted with 600-mesh carborundum, and inoculated with CMV by rubbing the leaves with inoculums. After inoculation, pepper seedlings were kept in a plastic house maintained at 25 to 30°C under fluorescent lighting (14 h light/10 h dark cycle, 200 μmol/m2/s, 70% relative humidity). CMV symptoms were observed two weeks after inoculation. Each plant was examined visually and assigned a disease grade according to the severity of mosaic and leaf distortion on a scale of 0 to 9 based on previously published methods (Yao et al. 2013). Disease indices of a population were calculated from disease grades of individual plants within a population using the following equation: disease indices (DIs) = (∑ (Number of plants in the disease grade × Disease grade)/(9 × Total number of plants) × 100.
F2 lines were evaluated for resistance using selfed F2:3 families. The parental lines and their F1 were used as a control for phenotypic evaluation. For this, F2:3 families, the parental lines and the F1 were arranged in a randomized complete block design with two replicates, and each replicate had 10 plants. Disease indices from the F2:3 families were used to represent the phenotypic values of individual F2 lines in the linkage analysis.
SLAF library construction and high throughput sequencing
The SLAF library was constructed following Sun et al. (2013). The pepper reference genome (C. annuum var. CM334 v1.55, http://peppergenome.snu.ac.kr/download.php) (Kim et al. 2014) was used to design pre-restriction enzyme digestion based on the genome size and GC (guanine-cytosine) content information. Hae III restriction enzymes were chosen to digest genomic DNA of the parents and mapping population. After digestion by Hae III, fragments (SLAFs) ranging from 314 to 444 bp (with indexes and adaptors) were recovered and purified using a Gel Extraction Kit (50T, Qiagen, Suzhou, China). Gel-purified products were then diluted for pair-end sequencing using an Illumina HiSeq 2500 system (Illumina, Inc; San Diego, CA, USA) at Biomarker Technologies Corporation in Beijing (http://www.biomarker.com.cn/). Real-time monitoring was performed for each cycle during sequencing, the ratio of high quality reads with quality scores greater than Q30 (means a quality score of 30, indicating a 1% chance of an error, and thus 99% confidence) in the raw reads and guanine-cytosine (GC) content were calculated for quality control (Zhang et al. 2013).
SLAF-seq data analysis and genotyping
Analysis of SLAF-seq data was described as Sun et al. (2013), as following. Raw reads were sorted to each progeny according to duplex barcode sequences. After the barcodes and the terminal 5-bp positions were trimmed, high-quality reads from the same samples were mapped onto the reference genome sequence using the BWA software (Li and Durbin 2010). All SLAF pair-end reads with clear index information were clustered together, based on sequence similarity which was detected using one-to-one alignment by BLAT (−tileSize = 10 -stepSize = 5). Sequences located at the same position with over 95% identity were grouped into one SLAF locus. Alleles between the parents were defined in each SLAF by the minor allele frequency (MAF) evaluation. True genotypes had markedly higher MAF values than genotypes containing sequence errors.
SLAFs filtration and genotype definition were performed according to the method described by Sun et al. (2013), and all SLAFs had been filtered and quality assessed many times. SLAFs containing more than four tags were filtered out as repetitive SLAFs. Because pepper is diploid species, one locus can only contain at most four SLAF tags. Only SLAFs with two to four alleles were identified as polymorphic and considered potential markers. All polymorphism SLAFs loci were genotyped with consistency in the parental and offspring SNP loci. The SLAFs with >3 SNPs were filtered out. It is considered to be a high frequency variation region of sequencing, if SLAFs have more than 3 SNPs. SLAF markers with average sequence depths of less than 10-fold in parents were discarded. The marker code of the polymorphic SLAFs was analyzed according to the population type CP (cross pollinators), which consist of eight segregation types (ab × cd, ef × eg, hk × hk, lm × ll, nn × np, aa × bb, ab × cc, and cc × ab), as previously described by Zhang et al. (2013). Since the F2 mapping population used here was derived from two homozygous lines, only the SLAF markers showing aa × bb segregation pattern were used for map construction.
Linkage map construction
A chi square test was used to calculate the segregation ratios of markers. Markers showing significant (P < 0.05) segregation distortion were initially excluded from the map construction. A region on the map with more than three adjacent loci that showed significant (P < 0.05) segregation distortion was defined as a segregation distortion region. SLAFs markers were allocated into 12 linkage groups (LGs) based on their locations on the reference genome. The linkage grouping uses the single-linkage clustering algorithm to cluster the markers into linkage groups, using a pair-wise modified independence LOD (MLOD) score as distance metric (Liu et al. 2014). Markers with the MLOD score < 5 were filtered to further confirm marker robustness. HighMap was used to construct and correct genetic map for each linkage (Liu et al. 2014). Briefly, recombination frequencies and LOD scores were calculated by two-point analysis. Then, a combination of enhanced Gibbs sampling, spatial sampling and simulated annealing algorithms was used to perform an iterative process of marker ordering. The error correction strategy of SMOOTH was conducted according to parental contribution of genotypes, and the k-nearest neighbor algorithm was applied to impute missing genotypes (Liu et al. 2014). Map distances were estimated using the Kosambi mapping function (Kosambi 1943). The genetic map was evaluated according to the haplotype maps, percentage of missing SLAFs, and heat maps of each linkage group.
QTL analysis
QTL analysis and mapping were initially carried out by interval mapping (IM) to identify genomic regions responsible for resistance to CMV. Subsequently, multiple QTL mapping (MQM) was conducted using the MapQTL software version 6.0 (Ooijen 2004). The genome-wide LOD threshold at the 5% significance level was determined by 1000 permutation tests for QTL significance associated with resistance to CMV. The proportion of phenotypic variation explained by each QTL was estimated using R2 (%) value.
Results
Analysis of SLAF-seq data and SLAF markers
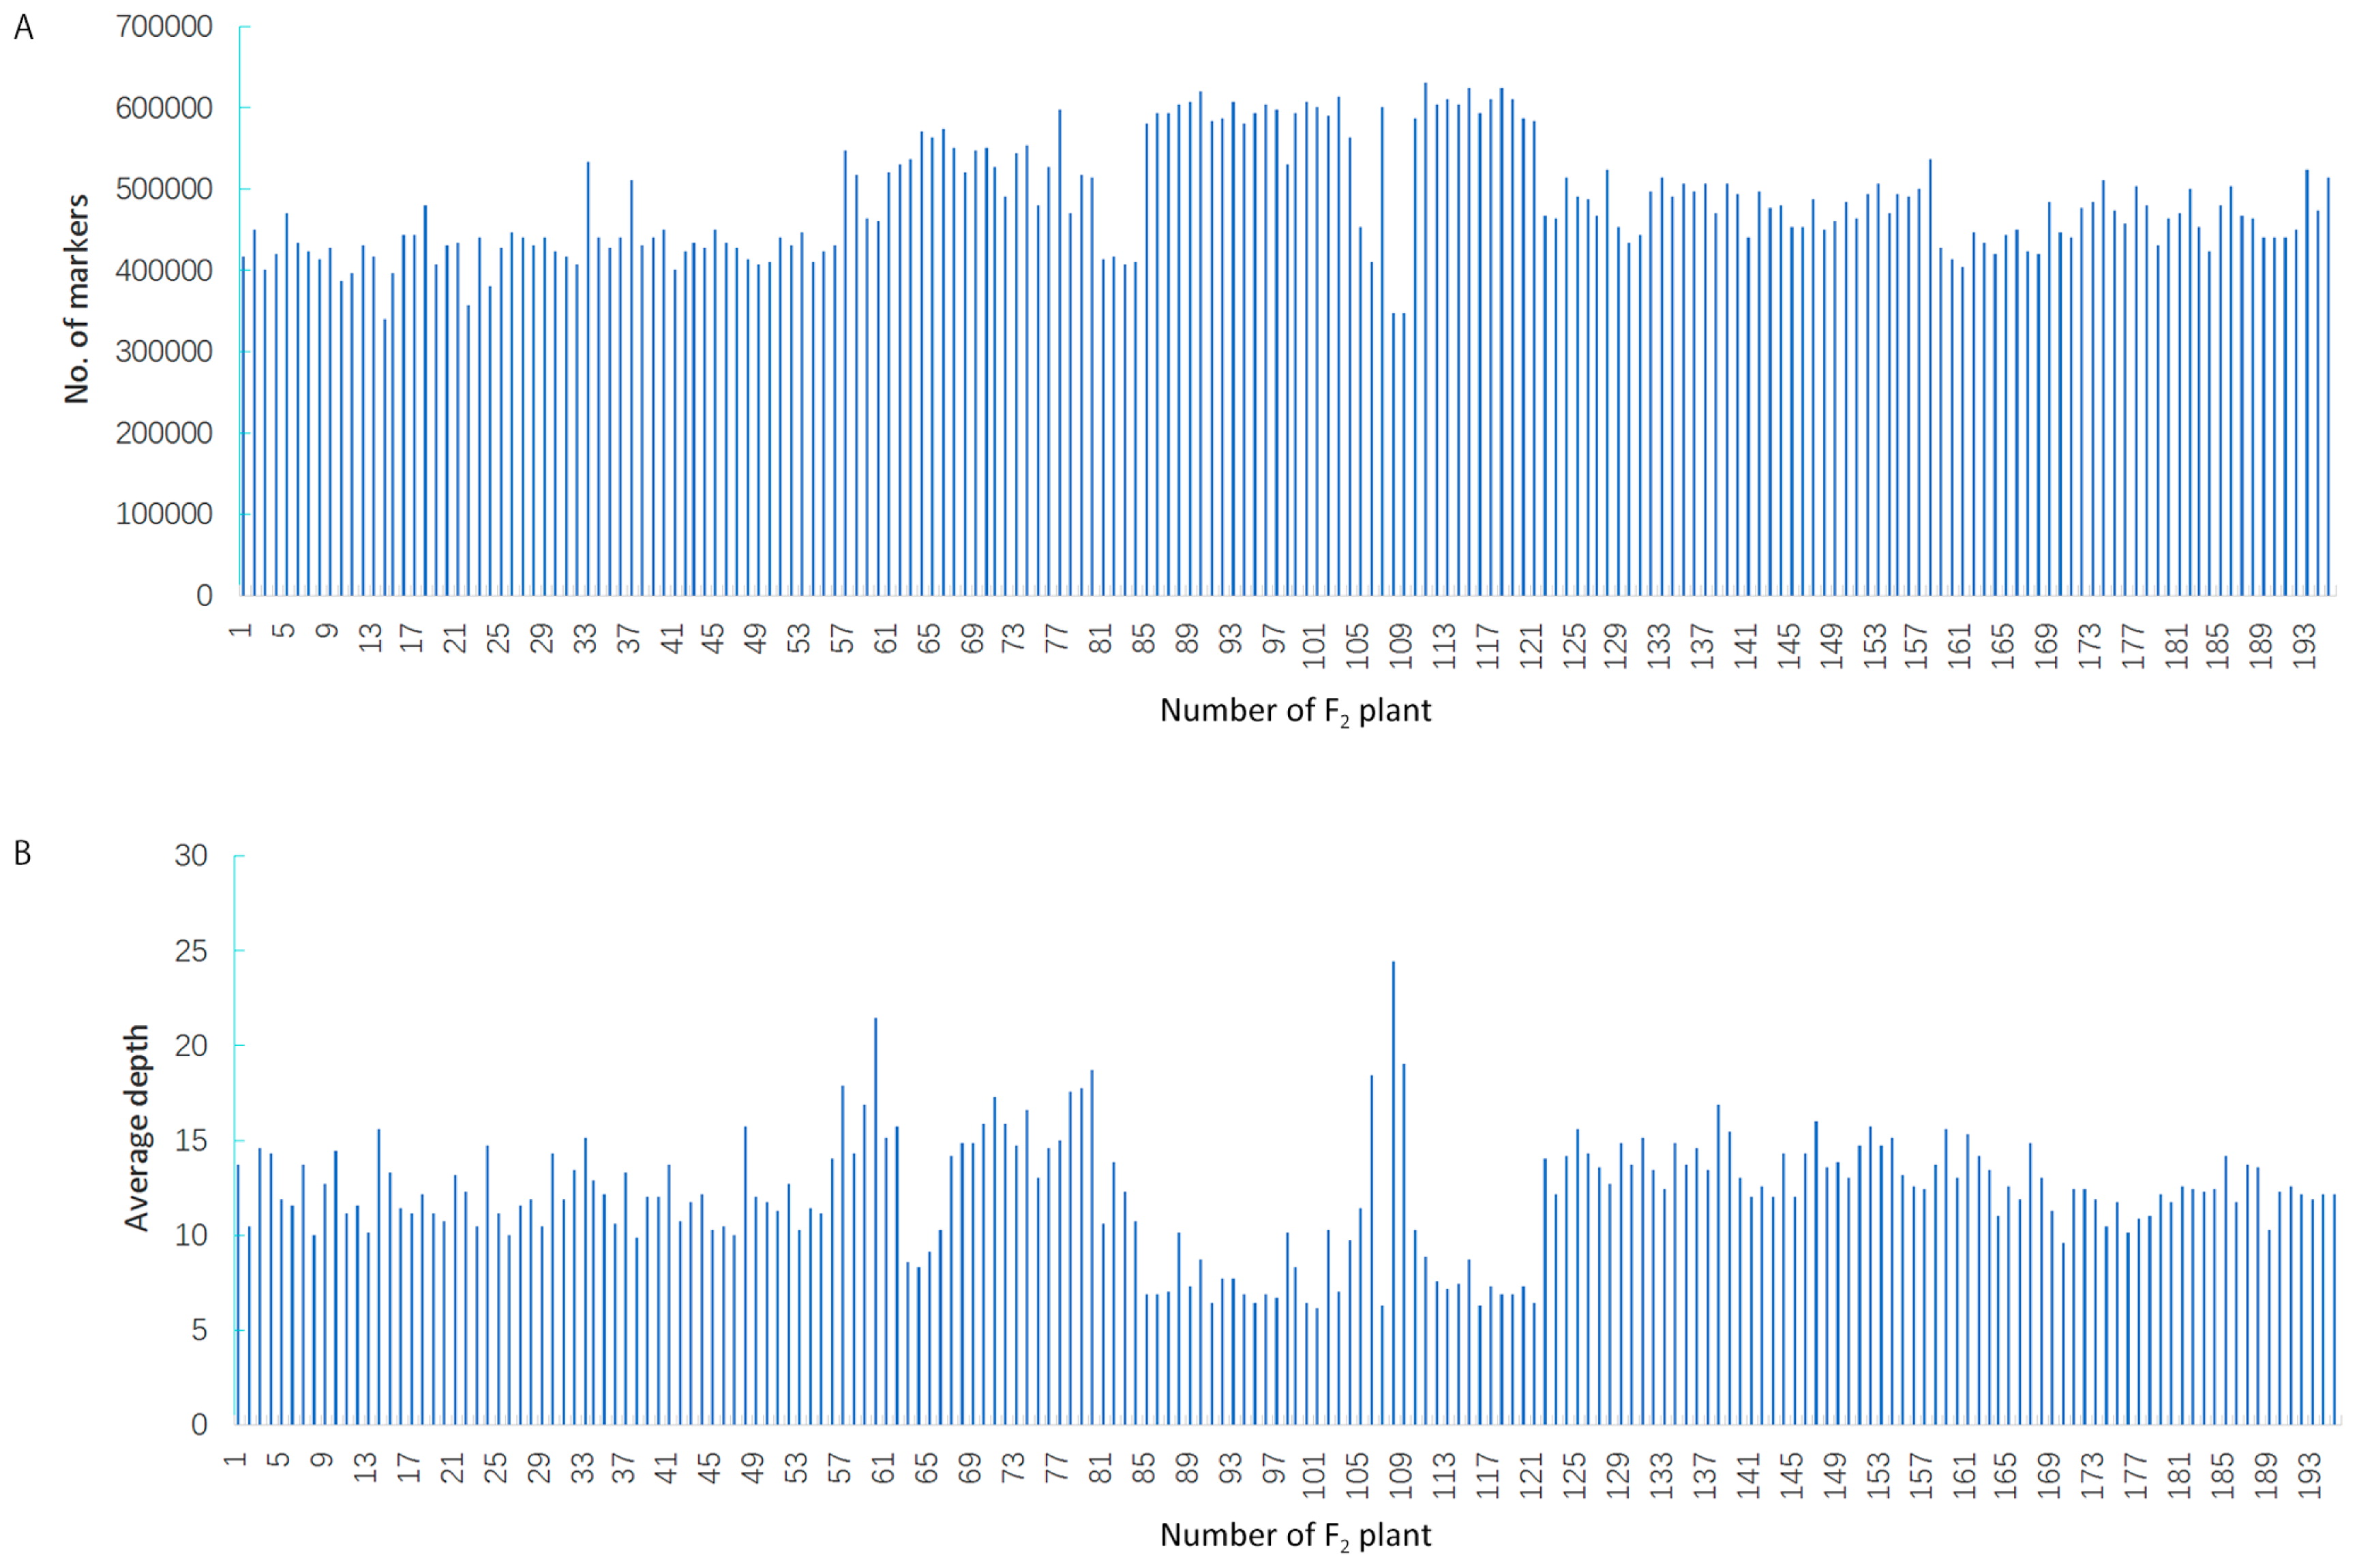
A total of 163 Gb of raw data was generated from SLAF library construction and high-throughput sequencing, including 1,596,590,065 pair-end reads that were 200 bp. The GC content was 39.13%, and Q30 ratio was 93.75%. In the paternal inbred line (BJ0747), the number of reads and SLAFs were 32,731,310 and 680,165 respectively, and the average coverage for each SLAF was 30.55-fold. Similarly, 29,213,950 reads were generated for 691,089 SLAFs from the maternal line (XJ0630), with an average coverage of 32.47 for each SLAF (Table 1). For the F2 population, 400,013 to 630,875 SLAFs were produced from 5,174,133 to 12,857,051 reads, and the coverage averaged from 6.18 to 24.39 (Fig. 1). On average, 7,869,973 reads and 483,735 SLAFs with an average coverage of 11.98-fold were obtained for each progeny (Table 1). After filtering out low-quality reads and low-depth SLAFs, a total of 885,499 high-quality SLAFs were obtained. Of the SLAFs, 210,077 were polymorphic, and the polymorphism rate of the SLAFs was 23.84% (Table 2, Fig. 2). SLAFs with polymorphisms were genotyped separately for parents and population individuals, and different alphabet letters were assigned to determine segregation patterns. A total of 143,872 polymorphic SLAFs were classified into eight segregation pattern (ab × cd, ef × eg, hk × hk, lm × ll, nn × np, aa × bb, ab × cc, and cc × ab) following the genotype-encoding rule (Fig. 3). Since the two parents (BJ0747 and XJ0630) were homozygous, they were assigned the genotypes aa and bb, and the 134,229 SLAFs with aa × bb segregation patterns were selected for constructing the linkage map (Fig. 3). SLAFs were filtered to remove parental sequence depth less than 10-fold, completeness less than 99%, and significant segregation distortion (P < 0.05), in the end 14,601 SLAF markers were selected to construct a linkage map for the F2 population.
Table 1
Summary of SLAF depths
| Sample |
Total reads |
SLAF numbers |
Total depth |
Average depth |
| BJ0747 |
32,731,310 |
680,165 |
20,778,972 |
30.55 |
| XJ0630 |
29,213,950 |
691,089 |
22,437,765 |
32.47 |
| Offspring |
7,869,973 |
483,735 |
5,797,198 |
11.98 |
Table 2
Discovery of SLAF markers
| Type |
Polymorphic SLAF |
Non-polymorphic SLAF |
Total SLAF |
| Number |
210,077 |
674,422 |
885,499 |
| Percentage (%) |
23.84 |
76.16 |
100 |
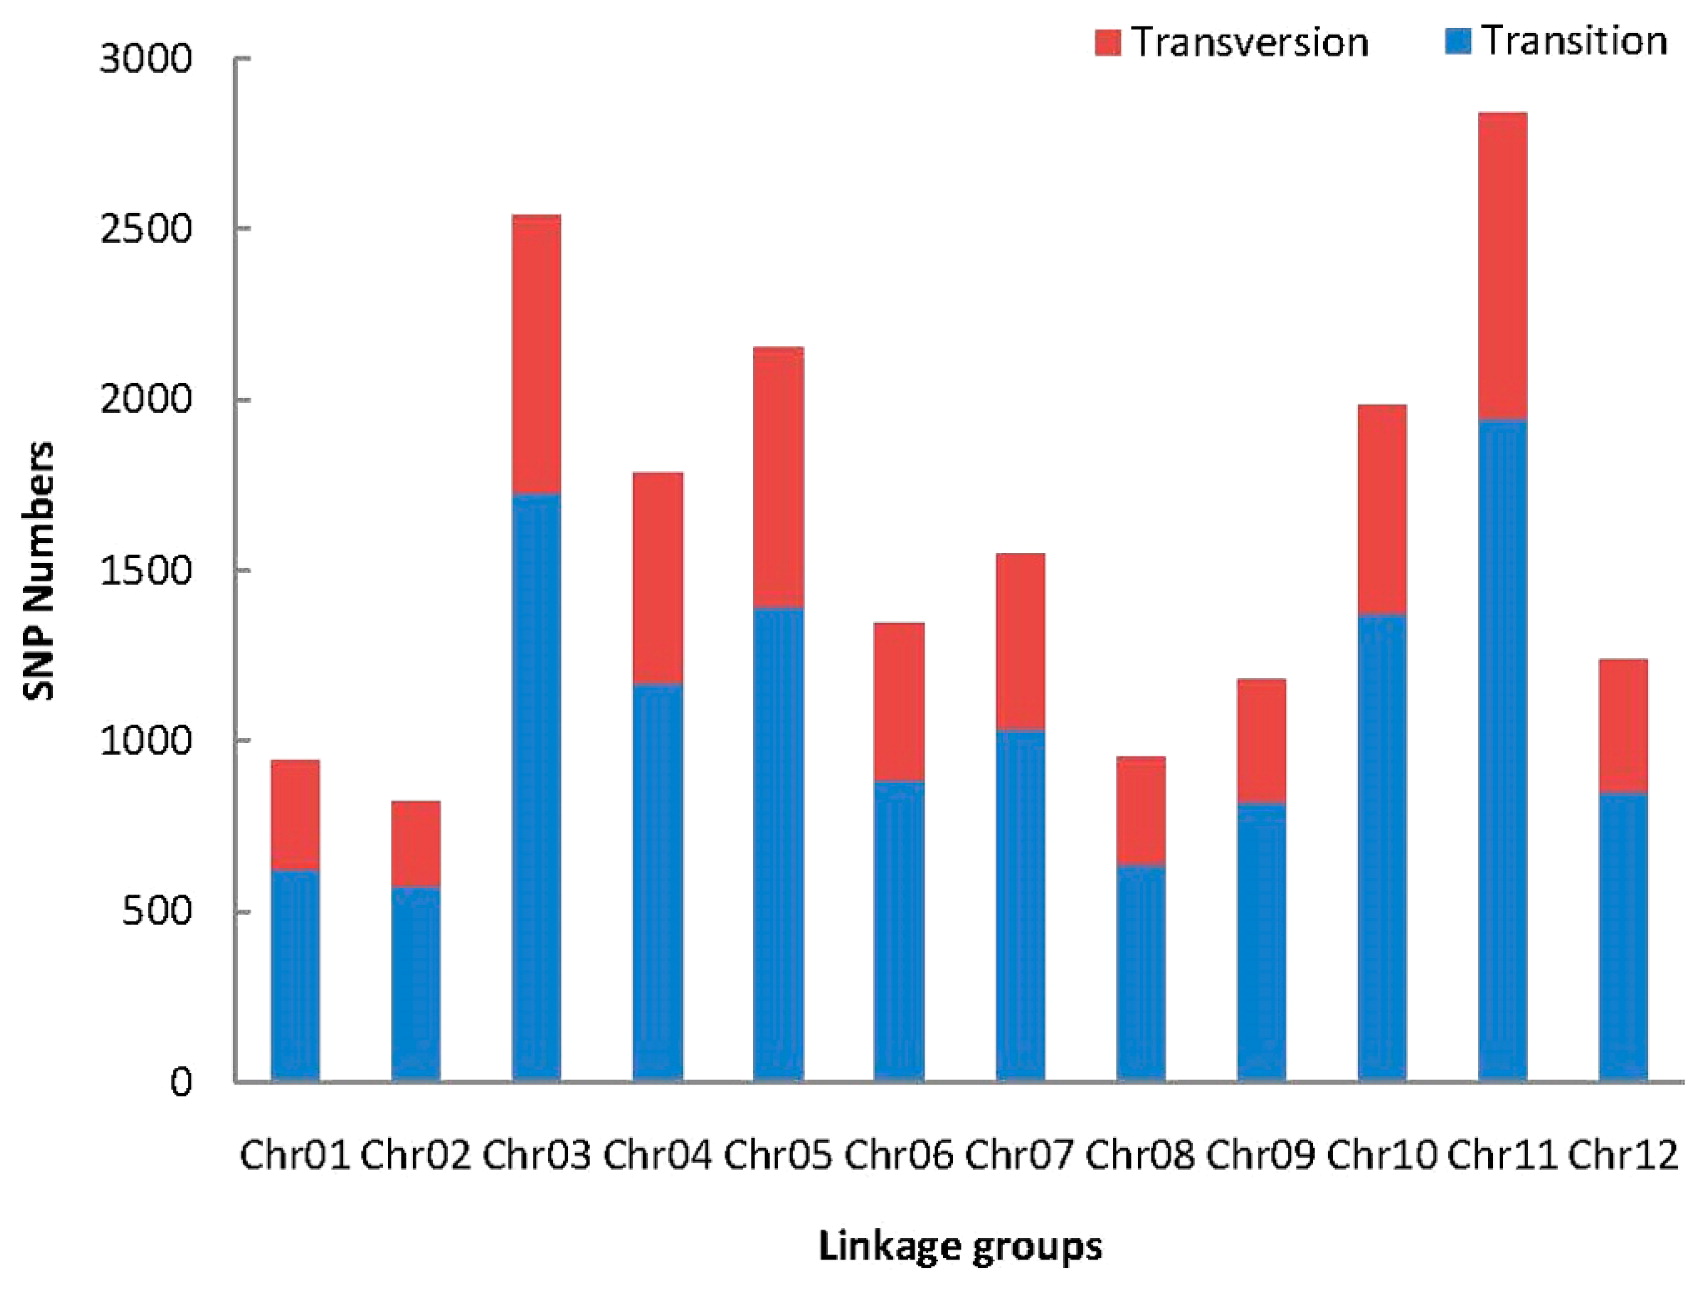
The 14,601 SLAF markers for the linkage map were mapped onto the pepper reference genome and using MLOD scores compared to other markers (score > 5), which showed that markers were distributed across 12 chromosomes. We obtained a total of 12,727 markers (Supplemental Table 1) were used to construct the genetic linkage maps based on the MLOD method. The average integrity of the mapping markers was 99.91%, representing a high map quality. Following the linkage analysis, the average depth of the markers was 99.38-fold in the female parent, 108.71-fold in the male parent, and 28.95-fold in the offspring. A total of 19,343 SNP loci were detected among 12,727 SLAF markers. Most of the SNPs were transition-type SNPs (67.48% of the total SNPs), the other SNPs were transversion-type SNPs (Fig. 4). The number of SNPs in different linkage groups ranged from 574 to 1,947 on the map.
We obtained a genetic map that totaled to 1,785.46 cM in 12 linkage groups with a mean marker distance of 0.16 cM between adjacent markers. The linkage groups were numbered according to the chromosome numbers. The genetic distance of the 12 chromosomes ranged from 119.78 cM (Chr08) to 186.90 cM (Chr03), with mean marker intervals between 0.10 cM and 0.23 cM. Overall, Chr11 was the most saturated, containing 1,627 markers and covering a length of 156.91 cM with only 0.1 cM average inter-marker distance. In contrast, Chr02 contained the largest average intervals, where distances between adjacent markers were 0.23 cM. The maximum gap was 6.29 cM on Chr02, between Marker4327730 and Marker3962343. Detailed information of the genetic map is presented in Table 3 and Fig. 5.
Table 3
Characteristics descriptions of constructed genetic map
| Chr. ID |
Total marker |
Total distance (cM) |
Average distance (cM) |
Gap < 5 cM |
Max gap (cM) |
| Chr01 |
1,136 |
182.60 |
0.16 |
99.82% |
8.45 |
| Chr02 |
547 |
123.78 |
0.23 |
99.82% |
6.29 |
| Chr03 |
1,665 |
186.90 |
0.11 |
99.70% |
14.06 |
| Chr04 |
1,287 |
137.06 |
0.11 |
99.92% |
8.97 |
| Chr05 |
1,455 |
155.18 |
0.11 |
99.93% |
7.23 |
| Chr06 |
924 |
149.57 |
0.16 |
99.46% |
9.80 |
| Chr07 |
1,063 |
141.52 |
0.13 |
99.91% |
5.41 |
| Chr08 |
581 |
119.78 |
0.21 |
99.66% |
12.85 |
| Chr09 |
636 |
138.50 |
0.22 |
99.21% |
7.65 |
| Chr10 |
1,081 |
151.04 |
0.14 |
99.63% |
9.50 |
| Chr11 |
1,627 |
156.91 |
0.10 |
99.57% |
9.85 |
| Chr12 |
725 |
142.62 |
0.20 |
100.00% |
4.58 |
| Total |
122,727 |
1,785.46 |
0.16 |
99.72% |
8.72 |
First, a haplotype map of the 12,727 markers was generated to detect population of double exchange and the genotyping errors, as well as displaying recombination events using results from the 195 offspring and parental lines (Supplemental Fig. 1). Most of the recombination blocks were clearly defined, and we did not detect instances of double recombination or deletions in any linkage group.
We next used a heat map analysis to evaluate frequency of recombination between markers from each linkage group (Supplemental Fig. 2). The analysis suggested that most linkage groups did not experience frequent recombination.
All the mapped SLAF markers were anchored to the pepper reference genome (CM 334, Annuum v1.55) to evaluate the collinearity between the genetic map and reference genome. We observed high collinearity between the markers and corresponding chromosomes, and the genetic and physical positions followed an identical order (Fig. 6). The map showed coefficients of colinearity ranging between 0.82–0.99 (P < 0.05) for the pepper reference genome comparison. Most parts of these curves represent a falling trend, suggesting that their genetic and physical positions follow an identical order. The consecutive curves generated from the 12 linkage groups indicate two facts: the genome was sufficiently covered with SLAF markers, and SLAF markers were placed accurately within each linkage group.
QTL mapping of pepper CMV resistance
We next detected the genomic regions responsible for CMV resistance using interval mapping (IM), and confirmed QTL by multiple QTL mapping (MQM) procedure. Totally three QTLs underlying CMV resistance were found. The largest effect was displayed by qcmv11.2 on chromosome 11, and this QTL explained 19.2% of the observed phenotypic variance (Table 4). qcmv11.2 spanned an interval between 114.258 cM and 117.236 cM, where seven SLAF markers were identified. The closest marker linked with qcmv11.2 was Marker5409028. The second QTL was referred to as qcmv11.1, which was also located on chromosome 11, and accounted for 10.2% of the trait variation. QTL qcmv11.1 was flanked by Marker5510971 and Marker5227451, and fourteen SLAF markers covered this region. The third QTL was named qcmv12.1, and it had a comparatively smaller observed phenotypic variance of 7.3% (Table 4).
Table 4
Genetic mapping and QTL analysis of CMV resistance trait in F
2:3 families
| QTL |
Chr. |
Marker interval |
Closest marker |
Position |
LOD |
Additive effect |
R2 |
| qcmv11.1 |
11 |
Marker5510971-Marker5227451 |
Marker6201026 |
58.477–60.528 |
3.42 |
0.47 |
10.2 |
| qcmv11.2 |
11 |
Marker6262083-Marker5712016 |
Marker5409028 |
114.258–117.236 |
4.30 |
0.19 |
19.2 |
| qcmv12.1 |
12 |
Marker17546312-Marker17412818 |
Marker17652010 |
21.442–22.468 |
3.58 |
0.23 |
7.3 |
Discussion
High-density genetic linkage maps are critical for identifying QTLs that can be used for further map-based gene cloning. Prince et al. (1993) first constructed a linkage map of pepper using 192 markers covering 720.3 cM in 19 linkage groups. Subsequently, numbers of Capsicum genetic maps have been constructed for interspecific or intraspecific populations, and genotyped with various traditional gel-based marker systems (Barchi et al. 2007, Lee et al. 2009, Lefebvre et al. 1995, Mimura et al. 2012, Prince et al. 1993, Wu et al. 2009, Yi et al. 2006). However, the markers are always inefficient, expensive, and time-consuming for high-density linkage maps, which need thousands of markers (Cai et al. 2015, Kakioka et al. 2013). Application of recently developed NGS-based technologies can be used to efficiently develop high-density markers to construct genetic maps. Qin et al. (2014) first published a high-density genetic map in an F2 population (Bei A3×B702), containing 7,657 SNPs markers, as the scaffold of ‘Zunla-1’ draft genome using the Illumina’s Infinium SNP-Assay. Furthermore, several high dense genetic maps for Capsicum were produced using re-sequencing or GeneChip technologies (Han et al. 2016, Hill et al. 2015, Hulse-Kemp et al. 2016, Li et al. 2015). Here, we used the SLAF-seq approach to identify a set of SLAF markers in pepper. We constructed a SLAF library of pepper and generated 163 Gb of raw data, containing 1,596,590,065 pair-end reads. Subsequently, 885,499 SLAFs were developed through high-throughput sequencing, and 14,601 polymorphic SLAF markers were identified to qualify for genetic linkage map construction. SLAF-seq is an efficient method of large-scale molecular markers discovery and genotyping. However, due to some unavoidable erroneous and missing values were contained in SLAF sequencing data, molecular markers developed in this approach must be stringently filtered to avoid false positive markers (Sun et al. 2013). In the present study, the quality score were firstly used to exclude suspicious genotyping results. In addition, reference genome mapping was used to prevent false positive results and to exclude the sequence error rate. Moreover, genotype analysis was preformed to filter out missing genotypes and Mendelian errors results. Only the segregation type aa × bb represented that the two alleles of one marker are different in both parents. The stringent filtration improved the accuracy of following association studies. Therefore, 201,077 polymorphic SLAFs were discovered initially in the sequence dataset, but only 14,601 SLAFs considered as effective markers.
Here, we obtained a linkage map, spanning 1,785.46 cM, containing 12,727 SLAF markers, where the average genetic distance between adjacent markers was only 0.16 cM. The resolution of the genetic map was improved obviously, contrasting with the previous study (Yao et al. 2013). Similar to these recent published maps (Han et al. 2016, Hill et al. 2015, Hulse-Kemp et al. 2016, Li et al. 2015, Qin et al. 2014, Zhang et al. 2016b), the short intervals between markers in the map were helpful for QTLs detection and fine-mapping. Furthermore, our map could be used to improve the quality of reference genomes by elucidating the genetic order of unordered regions and anchoring unassigned scaffolds to linkage groups. It was very important to evaluate the quality of the genetic map, and we validated the correlation of the genetic and physical positions, which suggested that the quality of the genetic map in this study is high. Despite high correlation was observed, there were still no collinearity in some narrow regions of which were located in Chr08 and Chr11. These no collinearity may be due to the lack of marker polymorphism and a shortage of markers detection in some chromosomal regions in the parental lines. Therefore, our genetic map can serve as the basis for subsequent QTL mapping of CMV-resistance traits.
CMV causes severe systemic mosaic symptoms and drastic reduction in marketable yield of pepper (Chaim et al. 2001, Palukaitis et al. 1992, Yao et al. 2013). In this study, we used an F2 population derived from a cross between BJ0747 and XJ0630, in order to construct a high-density genetic map and conduct QTL mapping of CMV-resistance. The same population was used to identify QTLs for CMV resistance previously (Yao et al. 2013), where a genetic map of 1438.5 cM containing 137 markers onto 17 LGs was constructed. In that previous study, six QTLs for CMV-resistance were identified on 4 LGs (LG4, LG7, LG8 and LG16). However, the distance between the markers was too large to accurately detect chromosomal regions causing CMV resistance. Using our improved genetic map, we refined the QTLs and detected three QTLs related to CMV resistance. Moreover, all the QTLs were mapped to intervals between 2.98 cM and 1.03 cM, which provided the possibility to predict the candidate genes.
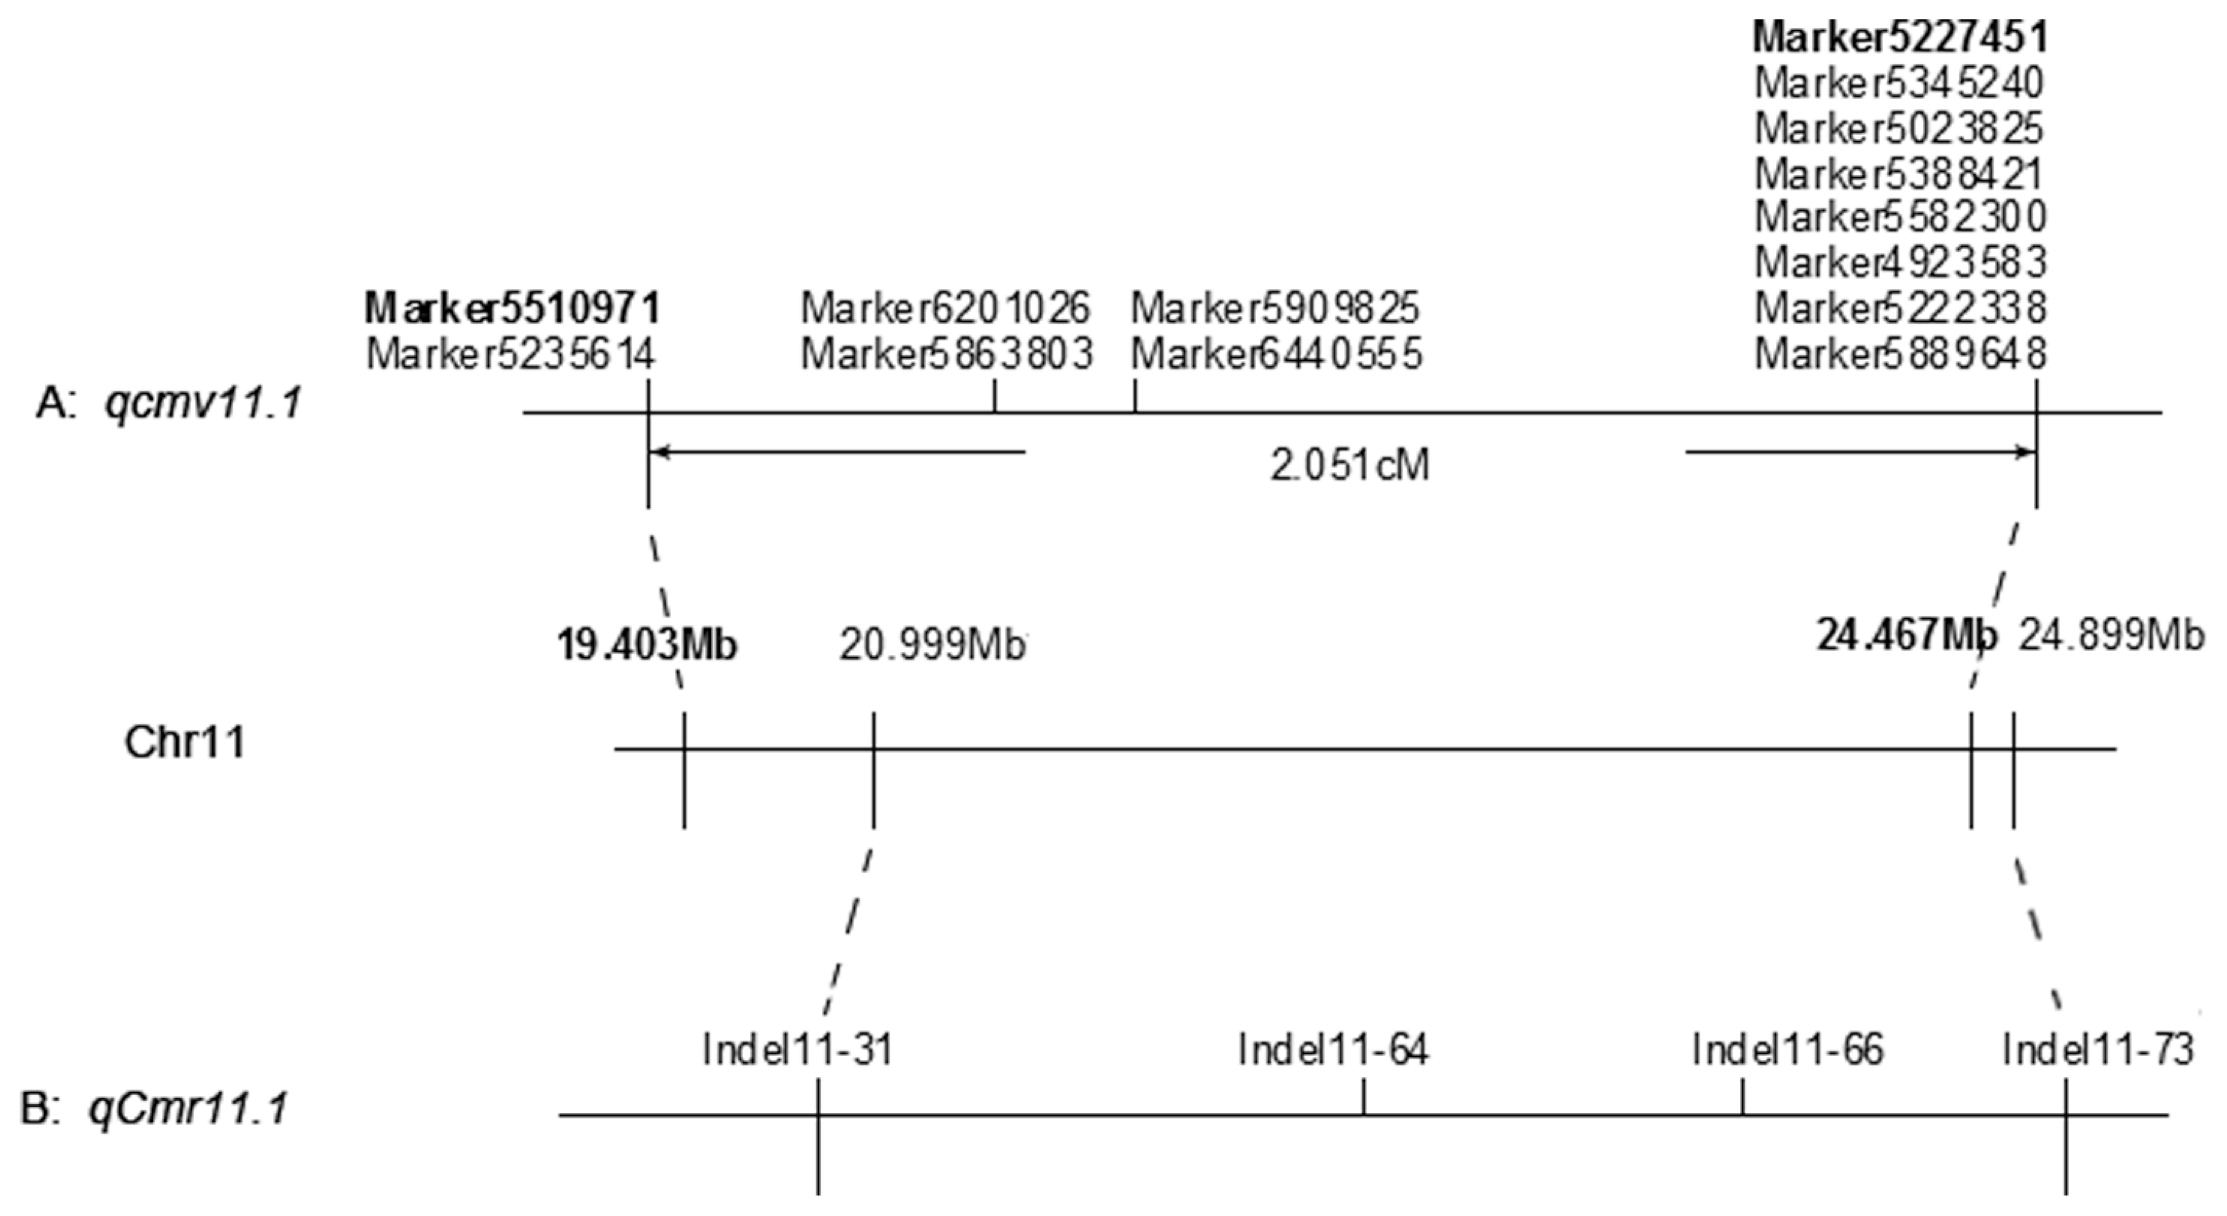
The genetic control of resistance to CMV on pepper is complex, and most studies have found partial resistance mediated by multiple loci located on different chromosomes (Grube et al. 2000, Suzuki et al. 2003, Yao et al. 2013). Given that our major effects QTLs were located on chromosome 11, we sought to compare QTLs on chromosome 11 from previous studies investigating CMV-resistance in Capsicum sp (Caranta et al. 2002, Chaim et al. 2001, Guo et al. 2016, Palukaitis et al. 1992, Yao et al. 2013). We found two QTLs, qcmv11.1 and qcmv11.2, which explained 10.2% and 19.2% of the observed phenotypic variations respectively. These two QTLs on chromosome 11 were compared to the qcmv.hb-8.2 locus previously identified using markers integration (Yao et al. 2013), and the result suggest that qcmv11.1 is located in the sub-region of qcmv.hb-8.2, while qcmv11.2 is a new QTL conferring resistance to CMV. Therefore, qcmv11.1 might be a stable QTL that plays a role in CMV resistance in C. annuum line ‘BJ0747’. qcmv11.1 and qcmv11.2 span about 2.05 cM and 2.98 cM, with the physical positions 19.403–24.467 Mb and 255.854-256.408 Mb on chromosome 11, respectively. Our study refined the results of crossing ‘BJ0747’ × ‘XJ0630’, a population previously used by Yao et al. (2013). Previous QTLs studies of CMV resistance identified the QTL cmv11.1, which was linked to the L locus for resistance to tobacco mosaic virus in ‘Perennial’ and ‘Vania’ (Caranta et al. 2002, Chaim et al. 2001). However, cmv11.1 is located on a different chromosomal region from qcmv11.1 and qcmv11.2 in ‘BJ0747’. In the pepper cultivar ‘Vania’, another minor-effect QTL cmv11.2 was identified, but the physical position could not be determined. We could not confirm whether the newly detected QTL qcmv11.2 may be the same QTL as these previous studies. The most recently reported minor-effect QTL qCmr11.1 from C. frutescens cv. ‘PBC688’ was located on 20,999,184 bp to 24,898,720 bp on chromosome 11. The physical position of qcmv11.1 in ‘BJ0747’ partly overlapped with qCmr11.1 from ‘PBC688’ (Fig. 7), and we are currently investigating this overlap in QTLs. In the previous study, qCmr11.1 was identified for containing four indel markers, flanking Indel-11-31 and Indel-11-73 (Guo et al. 2016). In our study, qcmv11.1 was located between Marker5510971 and Marker5227451, containing 14 SLAF markers. For further mapping of qcmv11.1, we will develop SNPs or InDel markers based on these SLAF markers in the candidate regions. In addition, a secondary population of carrying the qcmv11.1 fragment will be developed for improved mapping of the genes that regulate CMV resistance in ‘BJ0747’. We also identified a novel minor locus qcmv12.1 in BJ0747, which influenced 7.3% of the phenotypic variance. A major-effect QTL named cmv 12.1 was previously identified using AFLP markers E33/M48–132 and E40/M47–262 from the pepper cultivar ‘Vania’ (Caranta et al. 2002), and we will screen our offspring population using the E33/M48 and E40/M47 markers to test whether qcmv12.1 and cmv 12.1 may be the same chromosomal region.
In summary, we generated a high-density genetic map in pepper using SLAF-seq, demonstrating that SLAF-seq is an efficient method for marker discovery and high-density linkage map construction. Using this high-density genetic map, we identified three QTLs linked to CMV-resistance. qcmv11.1 appeared to be a stable QTL associated with CMV-resistant across different experiments in the same population. In addition, our analysis considerably narrowed the QTL intervals of qcmv11.1, which increases the possibility of predicting CMV-resistant candidate genes for further research. Moreover, the markers closely linked to CMV-resistant can be used for MAS in pepper breeding to facilitate the identification of genes underlying CMV-resistance. This study also illustrates the advantages of high-density genetic mapping analysis for improving better quality QTLs underlying complex traits.
Acknowledgments
This study was funded by the National Natural Science Foundation of China (31401868), the National Key Research and Development Program of China (2017YFD0101903) and China Agriculture Research System (CARS-23-G-28). Language help was provided by language services of Mogo Internet Technology Co., Ltd.
Literature Cited
- Baird, N.A., P.D. Etter, T.S. Atwood, M.C. Currey, A.L. Shiver, Z.A. Lewis, E.U. Selker, W.A. Cresko and E.A. Johnson (2008) Rapid SNP discovery and genetic mapping using sequenced RAD markers. PLoS ONE 3: e3376.
- Barchi, L., J. Bonnet, C. Boudet, P. Signoret, I. Nagy, S. Lanteri, A. Palloix and V. Lefebvre (2007) A high-resolution, intraspecific linkage map of pepper (Capsicum annuum L.) and selection of reduced recombinant inbred line subsets for fast mapping. Genome 50: 51–60.
- Cai, C., F.Y. Cheng, J. Wu, Y. Zhong and G. Liu (2015) The first high-density genetic map construction in tree peony (Paeonia Sect. Moutan) using genotyping by specific-locus amplified fragment sequencing. PLoS ONE 10: e0128584.
- Caranta, C., A. Palloix, V. Lefebvre and A.M. Daubèze (1997) QTLs for a component of partial resistance to cucumber mosaic virus in pepper: restriction of virus installation in host-cells. Theor. Appl. Genet. 94: 431–438.
- Caranta, C., S. Pflieger, V. Lefebvre, A.M. Daubèze, A. Thabuis and A. Palloix (2002) QTLs involved in the restriction of cucumber mosaic virus (CMV) long-distance movement in pepper. Theor. Appl. Genet. 104: 586–591.
- Chaim, A.B., R.C. Grube, M. Lapidot, M. Jahn and I. Paran (2001) Identification of quantitative trait loci associated with resistance to cucumber mosaic virus in Capsicum annuum. Theor. Appl. Genet. 102: 1213–1220.
- Grube, R.C., Y.P. Zhang, J.F. Murphy, F. Loaiza-Figueroa, V.K. Lackney, R. Provvidenti and M.K. Jahn (2000) New source of resistance to Cucumber mosaic virus in Capsicum frutescens. Plant Dis. 84: 885–891.
- Guo, G., S. Wang, J. Liu, B. Pan, W. Diao, W. Ge, C. Gao and J.C. Snyder (2016) Rapid identification of QTLs underlying resistance to Cucumber mosaic virus in pepper (Capsicum frutescens). Theor. Appl. Genet. 130: 41–52.
- Han, K., H.J. Jeong, H.B. Yang, S.M. Kang, J.K. Kwon, S. Kim, D. Choi and B.C. Kang (2016) An ultra-high-density bin map facilitates high-throughput QTL mapping of horticultural traits in pepper (Capsicum annuum). DNA Res. 23: 81–91.
- Hill, T., H. Ashrafi, S.R. Chin-wo, K. Stoffel, M.J. Truco, A. Kozik, R. Michelmore and A. Van Deynze (2015) Ultra-high density, transcript-based genetic maps of pepper define recombination in the genome and synteny among related species. G3 (Bethesda) 5: 2341–2355.
- Hulse-Kemp, A.M., H. Ashrafi, J. Plieske, J. Lemm, K. Stoffel, T. Hill, H. Luerssen, C.L. Pethiyagoda, C.T. Lawley, M.W. Ganal et al. (2016) A HapMap leads to a Capsicum annuum SNP infinium array: a new tool for pepper breeding. Hortic. Res. 3: 16036.
- Jiang, B., W. Liu, D. Xie, Q. Peng, X. He, Y. Lin and Z. Liang (2015) High-density genetic map construction and gene mapping of pericarp color in wax gourd using specific-locus amplified fragment (SLAF) sequencing. BMC Genomics 16: 1035.
- Kakioka, R., T. Kokita, H. Kumada, K. Watanabe and N. Okuda (2013) A RAD-based linkage map and comparative genomics in the gudgeons (genus Gnathopogon, Cyprinidae). BMC Genomics 14: 32.
- Kang, W.H., N.H. Hoang, H.B. Yang, J.K. Kwon, S.H. Jo, J.K. Seo, K.H. Kim, D. Choi and B.C. Kang (2010) Molecular mapping and characterization of a single dominant gene controlling CMV resistance in peppers (Capsicum annuum L.). Theor. Appl. Genet. 120: 1587–1596.
- Kim, S., M. Park, S. Yeom, Y. Kim, J. Lee, H. Lee, E. Seo, J. Choi, K. Cheong, K. Kim et al. (2014) Genome sequence of the hot pepper provides insights into the evolution of pungency in Capsicum species. Nat. Genet. 46: 270–278.
- Kosambi, D.D. (1943) The estimation of map distances from recombination values. Ann. Eugen. 12: 172–175.
- Lee, H.R., I.H. Bae, S.W. Park, H.J. Kim, W.K. Min, J.H. Han, K.T. Kim and B.D. Kim (2009) Construction of an integrated pepper map using RFLP, SSR, CAPS, AFLP, WRKY, rRAMP, and BAC end sequences. Mol. Cells 27: 21–37.
- Lefebvre, V., A. Palloix, C. Caranta and E. Pochard (1995) Construction of an intraspecific integrated linkage map of pepper using molecular markers and doubled-haploid progenies. Genome 38: 112–121.
- Li, B., L. Tian, J. Zhang, L. Huang, F. Han, S. Yan, L. Wang, H. Zheng and J. Sun (2014) Construction of a high-density genetic map based on large-scale markers developed by specific length amplified fragment sequencing (SLAF-seq) and its application to QTL analysis for isoflavone content in Glycine max. BMC Genomics 15: 1086.
- Li, H. and R. Durbin (2010) Fast and accurate long-read alignment with Burrows–Wheeler transform. Bioinformatics 26: 598–595.
- Li, W., J. Cheng, Z. Wu, C. Qin, S. Tan, X. Tang, J. Cui, L. Zhang and K. Hu (2015) An InDel-based linkage map of hot pepper (Capsicum annuum). Mol. Breed. 35: 32.
- Liu, D., C. Ma, W. Hong, L. Huang, M. Liu, H. Liu, H. Zeng, D. Deng, H. Xin, J. Song et al. (2014) Construction and analysis of high-density linkage map using high-throughput sequencing data. PLoS ONE 9: e98855.
- Mimura, Y., T. Inoue, Y. Minamiyama and N. Kubo (2012) An SSR-based genetic map of pepper (Capsicum annuum L.) serves as an anchor for the alignment of major pepper maps. Breed. Sci. 62: 93–98.
- Min, H.E., J.H. Han, J.B. Yoon and J. Lee (2016) QTL mapping of resistance to the Cucumber mosaic virus P1 strain in pepper using a genotyping-by-sequencing analysis. Hortic. Environ. Biotechnol. 57: 589–597.
- Murray, M.G. and W.F. Thompson (1980) Rapid isolation of high molecular weight plant DNA. Nucleic Acids Res. 8: 4321–4325.
- Ooijen, J. (2004) MapQTL® 5 Software for the mapping of quantitative trait loci in experimental populations. Kyazma BV., Wageningen, The Netherlands.
- Palukaitis, P., M.J. Roossinck, R.G. Dietzgen and R.I. Francki (1992) Cucumber mosaic virus. Adv. Virus Res. 41: 281–348.
- Poland, J.A., P.J. Brown, M.E. Sorrells and J.L. Jannink (2012) Development of high-density genetic maps for barley and wheat using a novel two-enzyme genotyping-by-sequencing approach. PLoS ONE 7: e32253.
- Prince, J., E. Pochard and S. Tanksley (1993) Construction of a molecular linkage map of pepper and a comparison of synteny with tomato. Genome 36: 404–417.
- Qi, Z., L. Huang, R. Zhu, D. Xin, C. Liu, X. Han, H. Jiang, W. Hong, G. Hu, H. Zheng et al. (2014) A high-density genetic map for soybean based on specific length amplified fragment sequencing. PLoS ONE 9: e104871.
- Qin, C., C. Yu, Y. Shen, X. Fang, L. Chen, J. Min, J. Cheng, S. Zhao, M. Xu, Y. Luo et al. (2014) Whole-genome sequencing of cultivated and wild peppers provides insights into Capsicum domestication and specialization. Proc. Natl. Acad. Sci. USA 111: 5135–5140.
- Sun, X., D. Liu, X. Zhang, W. Li, H. Liu, W. Hong, C. Jiang, N. Guan, C. Ma, H. Zeng et al. (2013) SLAF-seq: an efficient method of large-scale de novo SNP discovery and genotyping using high-throughput sequencing. PLoS ONE 8: e58700.
- Suzuki, K., T. Kuroda, Y. Miura and J. Murai (2003) Screening and field trials of virus resistant sources in Capsicum spp. Plant Dis. 87: 779–783.
- Truong, H.T., A.M. Ramos, F. Yalcin, M.D. Ruiter, H.J.A. van der Poel, K.H.J. Huvenaars, R.C.J. Hogers, L.J.G. van Enckevort, A. Janssen, N.J. van Orsouw et al. (2012) Sequence-based genotyping for marker discovery and co-dominant scoring in germplasm and populations. PLoS ONE 7: e37565.
- Wei, Q., Y. Wang, X. Qin, Y. Zhang, Z. Zhang, J. Wang, J. Li, Q. Lou and J. Chen (2014) An SNP-based saturated genetic map and QTL analysis of fruit-related traits in cucumber using specific-length amplified fragment (SLAF) sequencing. BMC Genomics 15: 1158.
- Wu, F., N.T. Eannetta, Y. Xu, R. Durrett, M. Mazourek, M.M. Jahn and S.D. Tanksley (2009) A COSII genetic map of the pepper genome provides a detailed picture of synteny with tomato and new insights into recent chromosome evolution in the genus Capsicum. Theor. Appl. Genet. 118: 1279–1293.
- Xu, X., R. Xu, B. Zhu, T. Yu, W. Qu, L. Lu, Q. Xu, X. Qi and X. Chen (2014) A high-density genetic map of cucumber derived from specific length amplified fragment sequencing (SLAF-seq). Front Plant Sci. 5: 768.
- Yao, M., N. Li, F. Wang and Z. Ye (2013) Genetic analysis and identification of QTLs for resistance to cucumber mosaic virus in chili pepper (Capsicum annuum L.). Euphytica 193: 135–145.
- Yi, G., J.M. Lee, S. Lee, D. Choi and B.D. Kim (2006) Exploitation of pepper EST-SSRs and an SSR-based linkage map. Theor. Appl. Genet. 114: 113–130.
- Zhang, D., H. Li, J. Wang, H. Zhang, Z. Hu, S. Chu, H. Lv and D. Yu (2016a) High-density genetic mapping identifies new major loci for tolerance to low-phosphorus stress in soybean. Front Plant Sci. 7: 372.
- Zhang, X., H. Sun, Y. Xu, B. Chen, S. Yu, S. Geng and Q. Wang (2016b) Development of a large number of SSR and InDel markers and construction of a high-density genetic map based on a RIL population of pepper (Capsicum annuum L.). Mol. Breed. 36: 92.
- Zhang, Y., L. Wang, H. Xin, D. Li, C. Ma, X. Ding, W. Hong and X. Zhang (2013) Construction of a high-density genetic map for sesame based on large scale marker development by specific length amplified fragment (SLAF) sequencing. BMC Plant Biol. 13: 141.