Abstract
Root system architecture (RSA) plays an important role in the acquisition of mineral nutrients. Nevertheless, RSA has seldom been selected as an important agricultural trait in conventional breeding programs. Little is known about the response of RSA and phosphorus use efficiency (PUE) in regards to phosphorus (P) availability between parental inbred lines and their F1. In this study, 6 maize inbred lines and their 15 F1 generated by a diallel mating system, were used to analyze the genetic associations between RSA and PUE. Heterosis for PUE-related traits were comparatively greater under high P condition and reduced significantly under low P condition. Relative mid-parent heterosis for root traits were expressed more under the low P condition. Low P supply had a significant effect on heterosis, GCA and SCA of RSA- and PUE- related traits. The hybrid C3 (7922 × 8703-2), which had the highest PUE, showed an average yield with a lower P uptake under the both P conditions. Results from this study suggested breeding for a relatively high grain yield with reducing aboveground P demand and grain P concentration should be sufficient to reduce P fertilizer input and improve P efficiency.
Introduction
Phosphorus (P) is an essential and irreplaceable macronutrient for plant growth and yield productivity (Manschadi et al. 2014, Marschner 1995, Shen et al. 2011). Consequently, crop production relies on a continuous input of P fertilizers. However, phosphorus fertilizers are produced from nonrenewable rock-P sources which will be depleted in 50 to 400 years (Cordell et al. 2009, Dawson and Hilton 2011). In contest to other macronutrients, P is less available in soils due to the easy bound with soil organic matter or chemicals (Al, Fe, etc.). Concentration of available P is often very low (about 2 μM) and seldom exceeds 10 μM even in well-fertile soils.
Maize (Zea mays L.) is a vital and widely cultivated cereal crop necessary for global food security, as its importance is seen in the economic uses ranging from direct human consumption to processing into other food materials, animal feeds, and industrial products (Ishola 2016). However, more than 30% of maize productivity in the world is affected by lack of P in the soil (Vance et al. 2003). Therefore, in order to avert a future P deficiency crisis, we need to significantly reduce P losses. Developing P efficient maize genotypes that can increase yield with low P supply should be a key breeding target to sustainable use of P resources and agricultural production (Lynch 2007, Manschadi et al. 2013).
Phosphorus use efficiency (PUE) is commonly defined as the crop yield per unit of P supply from soil and added fertilizer. PUE can be considered as the product of two subcomponents: (i) Phosphorus uptake efficiency (PupE; total P in the above-ground plant tissue at maturity per unit of P supply), and (ii) Phosphorus utilization efficiency (PutE; crop grain yield per unit of P taken up) (Barraclough et al. 2010, Manschadi et al. 2014, Moll et al. 1982, Wang et al. 2010a). Improving PUE in plants can be achieved by employed three strategies: (i) root foraging, (ii) soil P mining to increase P uptake, and (iii) enhancing internal PutE to produce more biomass and yield per unit of P uptake (Lynch 2011, Manschadi et al. 2014, Richardson et al. 2011). However, PupE could be more important than PutE in wheat and soybean studies under P stress (Manske et al. 2001, Zhao et al. 2004). Hence, enhancing PupE appears to be an effective method for increasing the PUE and reducing the critical soil-P requirements of crop varieties (Lynch 2007, Manschadi et al. 2014, Ozturk et al. 2005).
It is widely recognized that root morphological and physiological traits play a crucial role in P acquisition in crop species (de Dorlodot et al. 2007, Den Herder et al. 2010). Due to the immobility of P in soil, topsoil generally have greater P availability than the subsoil. Therefore, a root system architecture (RSA) that increases topsoil foraging is important for P acquisition. In maize, bean and soybean, shallow root growth angles of axial roots enhance topsoil foraging and thereby phosphorus acquisition (Lynch 2011). Recombinant inbred line (RIL) population in common bean with three basal root whorls accumulated 60% greater dry matter than related RIL population with two whorls in the field research under low P level (Miguel 2011). Increasing lateral root branching density (Postma et al. 2014), root hair growth (Haling et al. 2013), and root to shoot ratio (Hermans et al. 2006) and enhancing lateral root over primary root growth (Wang et al. 2013, Williamson et al. 2001) leads to higher P uptake. By selecting RSA traits via a conventional breeding program, several soybean varieties that show substantial yield gains in low P soils have been officially certified and released to farmers in southern China (Wang et al. 2010b). In addition, through molecular breeding, the PHOSPHORUS STARVATION-TOLERANCE 1 (OsPSTOL1) gene in rice, was found to enhance root length and surface area at the seedling stage. Lines overexpressing OsPSTOL1 showed an increase of P uptake and approximately a 30% increase in grain yield under low P conditions (Gamuyao et al. 2012).
When breeding for improved genotypes, breeders are primarily concerned with traits selection for increased grain yield and are aware if a trait from either parent can be reflected in their progeny (Chun et al. 2005). Bolanos and Edmeades (1993) found that the use of secondary traits that are correlated with yield will help to increase selection efficiency. RSA-related traits in the different developmental stages showed significant correlation with grain yield (Cai et al. 2012). Tuberosa et al. (2002) also reported significant positive correlations between root traits and grain yield under water stress conditions. In the production of maize hybrid cultivars, it is important to evaluate an inbred lines combining ability (Ishola 2016). Chun et al. (2005) reported that heterosis of root traits was significant at high and low nitrogen (N) levels and was attributed to both general combining ability (GCA) and specific combining ability (SCA). Betrán et al. (2003) also found a significant positive correlation between the hybrid and mid-parent grain yield under different N conditions. However, little was known about the heterosis of RSA- and PUE-related traits in relation to P supply. A better understanding of the heterosis of root characteristics would provide a more targeted approach to improving P efficiency and grain yield within a breeding program.
In this study, 6 maize inbred lines and their 15 F1 created by a diallel mating system were used to: (1) evaluate RSA-and PUE-related traits of inbred lines and their F1 under low P stress; (2) determine the GCA and SCA from the F1 of 6 maize inbred lines; and (3) investigate heterosis of RSA traits and yield under low and high P levels.
Materials and Methods
Plant materials
Using 6 maize inbred lines, 7922, YuanYin1, Chen94-11, 8703-2, Zao27 and 428, a complete diallel mating was designed to produce 15 F1. A complete list of the maize lines examined in this study is shown in Supplemental Fig. 1. In a previous study, three P efficient maize lines (Zao27, 428, and YuanYin1) and three P inefficient lines (7922, Chen94-11 and 8703-2) were selected based on the phenotypic evaluation of a set of 100 inbred lines under two contrasted P conditions by two years (Liu 2003).
Plant growth conditions
All the tested lines were grown in a long-term P fertilized field located in the Changping District, Beijing, China (40°02′ N, 116°10′ E). The experimental design was a split plot with 3 replications. The variable between plots was two levels of P fertilizer, high P (135 P2O5 kg/ha) and low P (no P supplied) since 1986. P fertilizer was applied before sowing. N fertilizer was applied at 270 kg N/ha each year in all the plots, with 40% applied at sowing, and remaining 60% at stem jointing stage. The sub-plots consisted of five 5 m long rows with 50 cm inter-row spacing. Each row contained 13 plants. And the distance between plants within a row was 33 cm. Six inbred lines and their 15 F1 were overseeded with hand planters on May 5th 2002. Plots were thinned at the seedling stage to a final stand of 60,000 plants/ha. Herbicide and irrigation were applied as necessary.
At the 6-leaf stage, a soil volume of 33 cm in width × 50 cm in length × 60 cm in depth surrounding a plant was excavated for 3 plants per sub-plot. All visible roots were picked out by hand. The roots were washed free of soil using a 0.4 mm mesh. The number of seminal roots (SRN) and crown roots (CRN) were counted. The roots were then floated in a transparent plastic tray with water to be scanned by a scanner (EPSON V700, China). Using the software, WinRHIZO (Pro 2004b, Canada), the total root length (TRL) of the scanned images was calculated. Primary root within 15 cm was scanned by scanner. The total lateral root length (TLRL) was calculated based on the scanned images using the same software. Lateral root number (LRN) was counted as the number of lateral roots within 5 cm from the first emerged lateral root on the primary root. Shoots and roots were dried at 65°C for moisture removal, and shoot dry weight (SDW), root dry weight (RDW), and root to shoot ratio (RS) were evaluated. Shoot samples were then analyzed for P concentrations according to the molybdate-blue colorimetric method (Murphy and Riley 1962). The P content of shoot was calculated by multiplying the shoot weight by the P concentration (Table 1).
Table 1
Summary of the investigated traits in this study and the measurements
| Trait |
Abbreviation |
Unit |
Trait measurement |
| RSA-related traits in the seedling stage |
| The number of seminal roots |
SRN |
number |
Counted manually |
| The number of crown roots |
CRN |
number |
Counted manually |
| Total root length |
TRL |
cm |
Root was scanned by scanner and TRL was determined by WinRHIZO |
| Total lateral root length |
TLRL |
cm |
Primary root within 15 cm was scanned by scanner and TLRL was determined by WinRHIZO |
| Lateral root number |
LRN |
number |
Count number of lateral root within 5 cm from the first emerged lateral root in the primary root |
| Shoot dry weight |
SDW |
g/plant |
Dried and weighted using a balance (1/1000 g) |
| Root dry weight |
RDW |
g/plant |
Dried and weighted using a balance (1/1000 g) |
| Root to shoot ratio |
RS |
g/g |
Root dry weight/shoot dry weight |
| P acquisition per plant |
– |
mg/plant |
Total amount of shoot P content per plant |
| PUE-related traits in the mature stage |
| Grain yield |
GY |
kg/ha |
– |
| Total P uptake |
Pup |
kg/ha |
Total amount of P content in plants per hectare |
| P use efficiency |
PUE |
kg/kg |
Grain yield/total P available in soil |
| Harvest index |
HI |
kg/kg |
Grain yield/(grain yield + shoot biomass) |
At maturity, two middle rows with 26 plants were harvested for determination of grain yield. Stover tissues were harvested, and weighed after oven-drying at 65°C. The grain yield and shoot biomass were calculated according to the harvest area. The grain and shoot samples were then analyzed for P concentrations. The P content of the grain and shoot was calculated by multiplying their weights by their P concentration, respectively. Total P content of the plants was then calculated as the sum of both the grain and shoot. Harvest index (HI) and P use efficiency (PUE) were calculated as described in Table 1.
Statistical analysis
Data was analyzed using PROC GLM in SAS (SAS Institute Inc., 1989). The general combining ability (GCA) and specific combining ability (SCA) of each trait were computed from the mean square of the treatments based on Griffing’s (1956) diallel method I model I where the genotype was considered as a fixed effect and replication was considered as a random effect as shown below:
|
Y
i
j
k
=
μ
+
g
i
+
g
j
+
s
ij
+
r
ij
+
b
k
+
e
ijk |
Where μ is the overall mean, gi is the general combining ability effect of the ith parent, gj is the general combining ability of the jth parent. Sij is the specific combining ability effect (interaction effect) of the ith and jth parents, rij is the reciprocal effect, replication, bk is the effect of kth replications and eijk is the error.
The relative mid-parent heterosis (MPH%) was calculated as follows: MPH% = (hybrid phenotypic performance – mid-parent phenotypic performance)/mid-parent phenotypic performance × 100%. Pearson correlation coefficient was calculated using SPSS Statistics 17.0 (SPSS, Inc., Chicago, IL, USA).
Results
Evaluation of RSA- and PUE-related traits performance
The investigated RSA-related traits, included: root number (SRN, CRN and LRN), root length (TRL and TLRL), shoot (SDW) and root (RDW) biomass, root to shoot ratio (RS), and P acquisition per plant at the seedling stage. PUE-related traits consisted of grain yield (GY), total P uptake (Pup), P use efficiency (PUE), and harvest index (HI) at the mature stage (Table 1). Significant (p < 0.01) differences were observed in the performance of the F1 and the parental inbred lines for all the traits except for LRN, where significant (p < 0.05) differences were also found (Table 2). In the parental inbred lines, the P treatment effects were significant for RSA-related traits, such as CRN, TRL, TLRL, SDW, RDW and P acquisition per plant. PUE-related traits, such as GY, Pup and HI also yielded significant P treatment effects. For the F1, P treatment had a significant effect on all traits except for SRN.
Table 2
Variance analysis of genotypic differences of RSA- and PUE-related traits of 6 maize inbred lines and their 15 F
1 at low and high P levels
| Source |
df |
RSA-related traits in the seedling stage |
PUE-related traits in the mature stage |
| SRN |
CRN |
TRL |
TLRL |
LRN |
SDW |
RDW |
RS |
P acquisition per plant |
GY |
Pup |
PUE |
HI |
| Inbred lines |
| Block |
2 |
0.1336 |
10.2* |
3608 |
369** |
43.9 |
0.1216 |
0.0023 |
0.0013 |
0.0667 |
58407 |
1.3 |
1613 |
0.0035 |
| P levels (P) |
1 |
0.0711 |
35.6** |
376434** |
6097** |
29.2 |
9.7** |
0.1495** |
0.0011 |
192.7** |
7025150** |
335.9** |
3251 |
0.1736** |
| Inbred (I) |
5 |
6.2** |
48.7** |
179008** |
2182** |
393.4* |
1.3** |
0.0369** |
0.0024* |
33.1** |
4978150** |
73.4** |
33614** |
0.2182** |
| I × P |
5 |
0.7584 |
4.4 |
182716** |
2632** |
39.8 |
1.5** |
0.0197** |
0.0058** |
25.5** |
462254* |
10.1* |
8558** |
0.0607** |
| Error |
22 |
0.6594 |
2.8 |
4453 |
81 |
40.4 |
0.1311 |
0.0014 |
0.0007 |
1.04 |
142557 |
3.7 |
846 |
0.1359 |
| F1 |
| Block |
2 |
0.2653 |
3.8 |
54158* |
138 |
8.2 |
2.0* |
0.0146 |
0.0002 |
31.4* |
250644 |
0.3 |
1135 |
0.0002 |
| P levels (P) |
1 |
0.0284 |
257.0** |
4229898** |
11657** |
145.4* |
274.6** |
3.0581** |
0.0021* |
5214.7** |
158308494** |
3580.9** |
141868** |
0.2801** |
| Crosses (C) |
14 |
2.0952** |
21.2** |
171475** |
2377** |
80.8** |
1.3** |
0.0245** |
0.0008* |
23.8** |
1819854** |
40.3** |
8136** |
0.0303** |
| C × P |
14 |
0.359 |
2.6 |
113839** |
1428** |
33.8 |
0.8* |
0.0185** |
0.0004 |
16.1* |
649361.5 |
28.8** |
2154** |
0.0047 |
| Error |
58 |
0.5573 |
2.4 |
11920 |
331 |
23.1 |
0.3582 |
0.0051 |
0.0004 |
7.2 |
424992 |
4.4 |
798 |
0.0028 |
Values are the mean squares from ANOVA. F1 were derived from 6 inbred lines by diallel mating.
*, ** indicate significance at 0.05 and 0.01 probability levels, respectively.
For the RSA-related traits at the seedling stage, low P greatly reduced the SDW in all the parental inbred lines and their F1. RDW and P acquisition per plant showed a similar response to low P related to SDW (Fig. 1, Supplemental Table 1). Generally, TRL was decreased under low P condition. However, for some inbred lines and their F1, the TRL did not change, or even increased in some cases, e.g. parental line P3, and cross line C2. For the trait TLRL, except for parental inbred line, P1, which showed a slight increase in low P stress, all other parental lines showed a decrease. The TLRL increased for 7 F1 in the low P level. For root number traits, SRN was not affected by P treatment, and there was no difference between high and low P treatment. The mean CRN observed was 3, which was reduced under the low P stress in the parental inbred lines and the F1. The LRN trait, under the low P level, increased in some inbred lines and the F1, e.g. P1, P3 and P4 in the inbred lines, and C2, C6, C7, C10 and C11 for the F1 (Fig. 1, Supplemental Table 1).
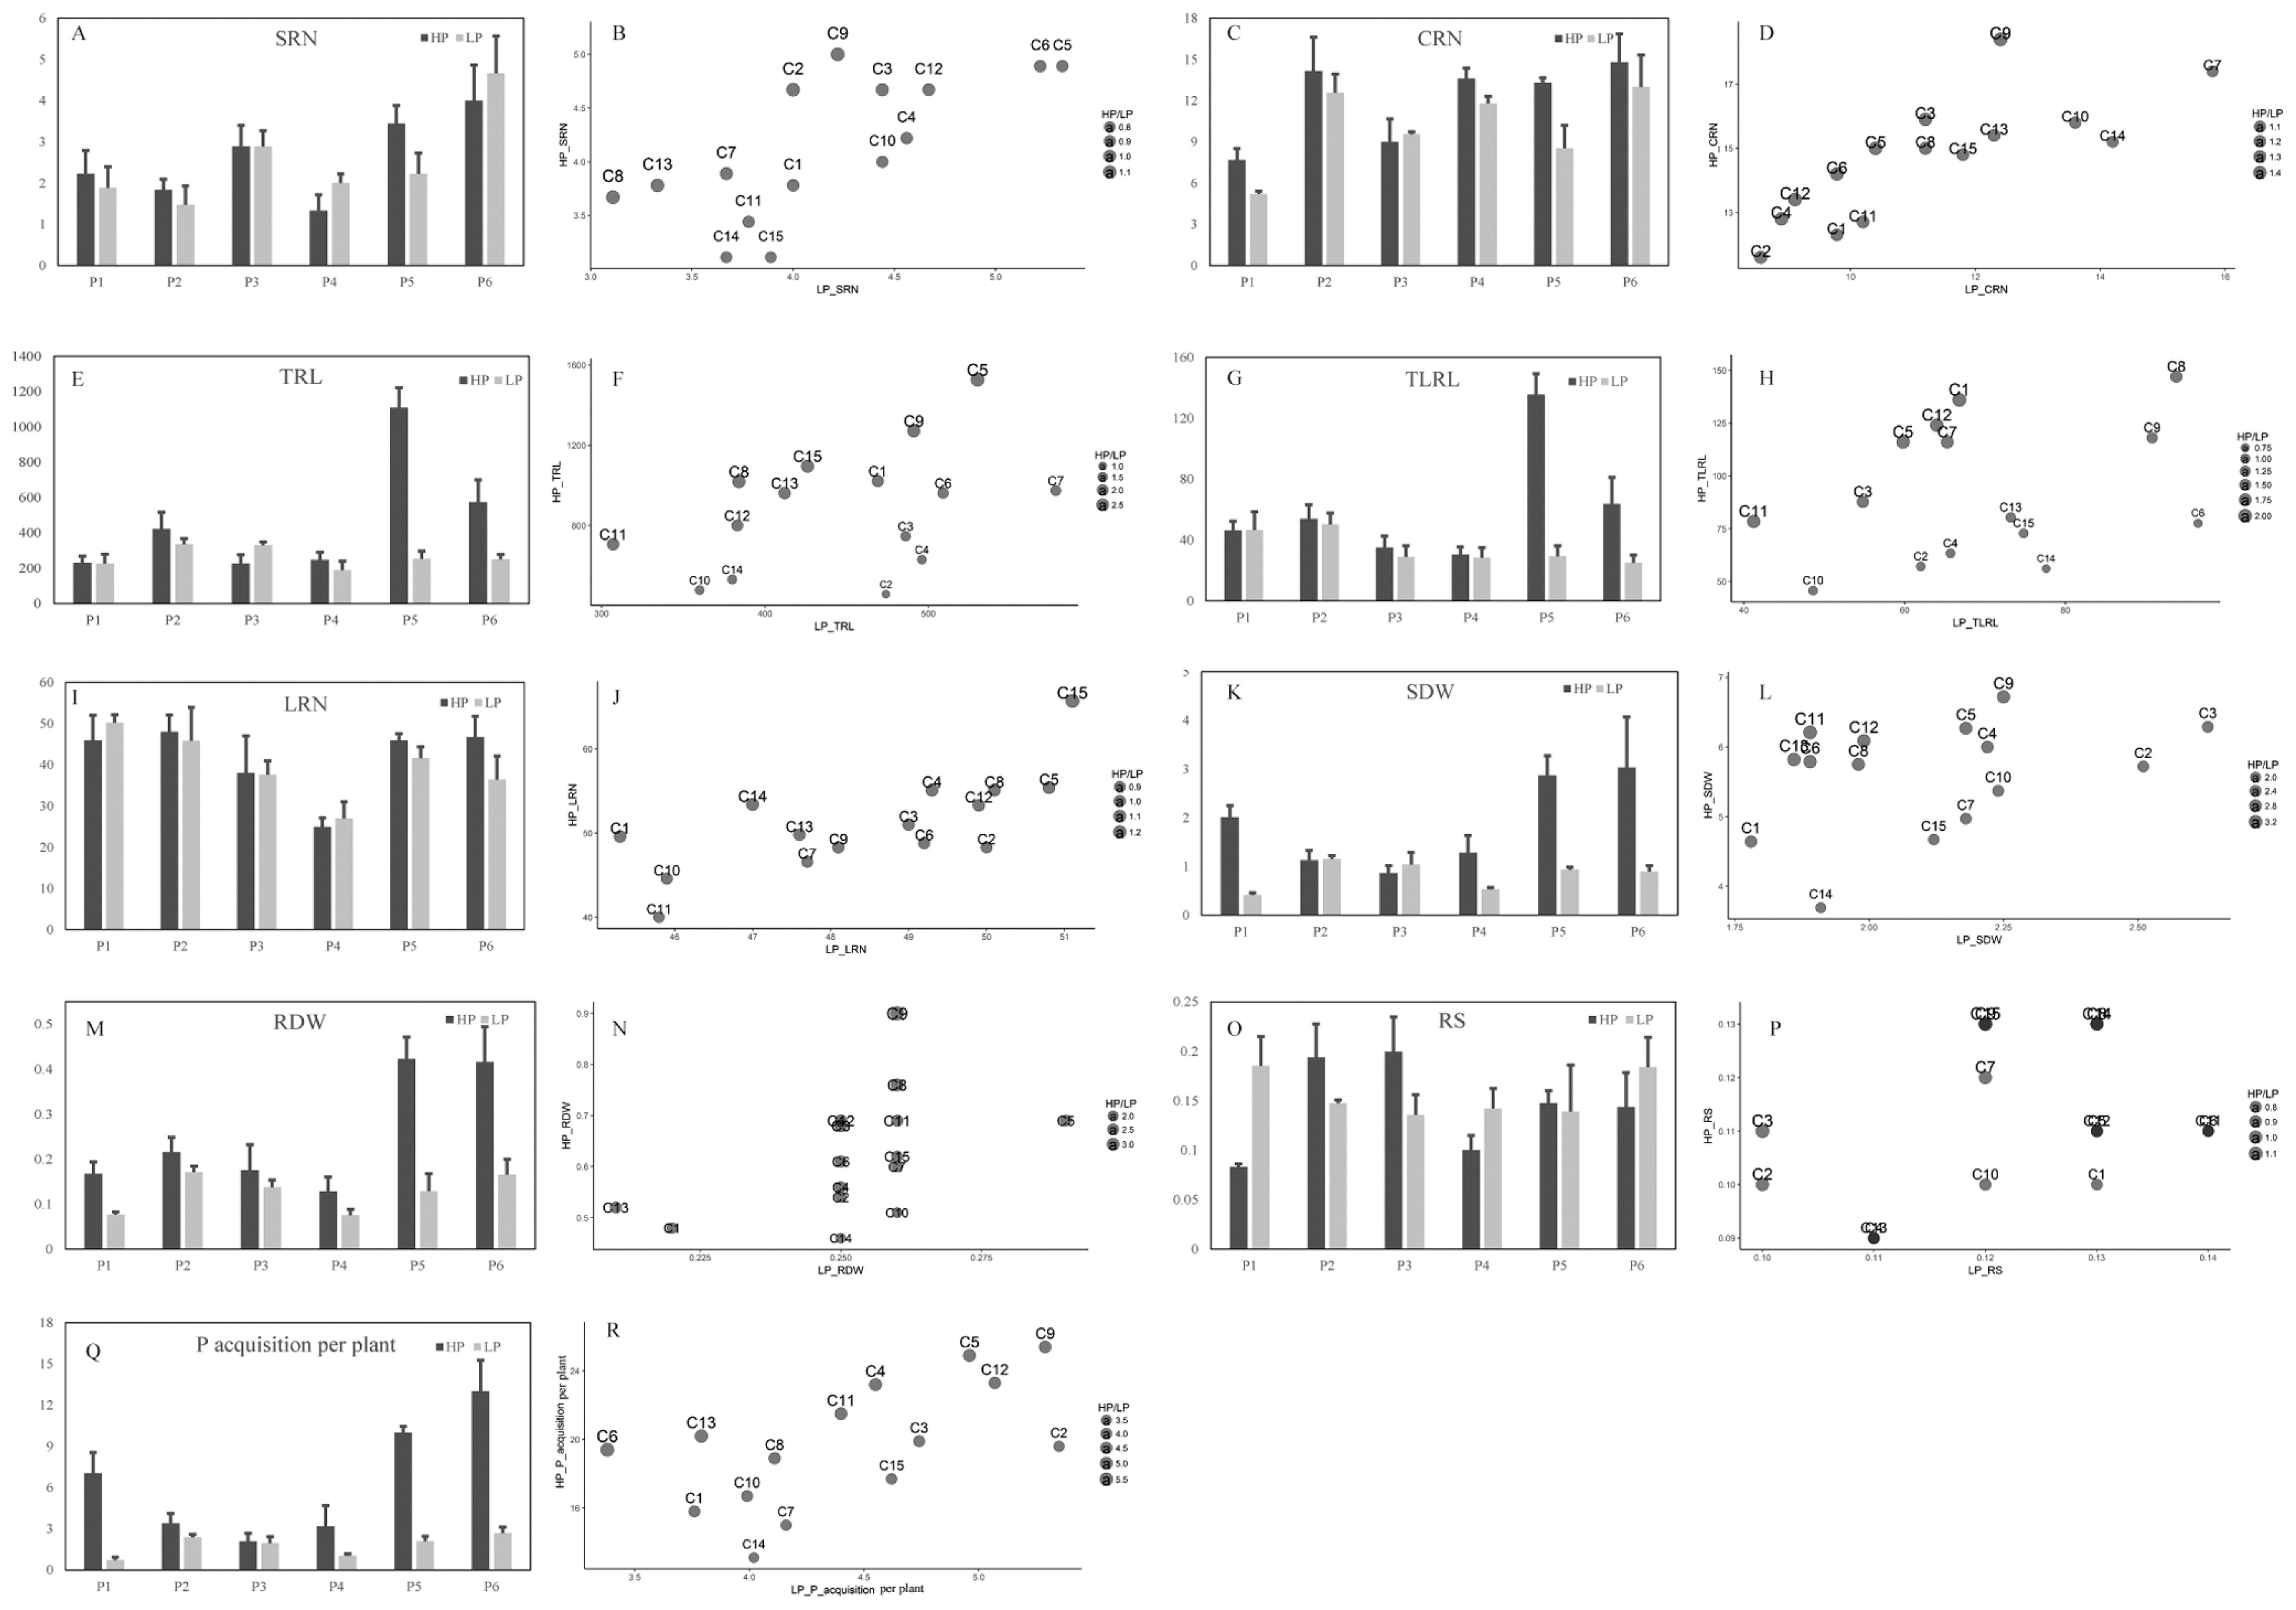
For the PUE-related traits at the mature stage, low P greatly reduced the GY of all the parental inbred lines and their F1 (Fig. 2, Supplemental Table 2). The mean GY observed was 1629 kg/ha for parental inbred lines and 3940 kg/ha for the F1 in low P level, and 3433 kg/ha for parental inbred lines and 6592 kg/ha for the F1 in high P level, respectively. Pup and HI displayed the same response to low P as that of GY. For the trait PUE, parental inbred lines P2, P5 and P6 showed a decrease at the low P level, all F1 (C1–C15) showed an increase at the low P level (Fig. 2, Supplemental Table 2).
Heterosis of RSA- and PUE-related traits under low P and high P levels
Mid-parent heterosis explains the performance of a hybrid relative to the mid-performance of the parental lines. In this study, the effect of mid-parent heterosis was significant for all the investigated traits except for CRN (Table 3). In addition, large variations were observed among the crosses between low and high P treatments. The mid-parent heterosis estimates ranged from approximately –20.3% to 446% under low P stress, and –7.73% to 2308% under high P level, respectively. Compared with high P condition, the effect of mid-parent heterosis for the RSA-related traits except for RS were more apparent at the low P level. However, for the PUE-related traits, high P level showed a greater effect of mid-parent heterosis compared with low P stress (Table 3). Under both P conditions, significant correlations between parental lines and their hybrid progenies were found for PUE. The root traits CRN, and the SDW also showed significant correlations in the low P stress (Table 4).
Table 3
Relative mid-parent heterosis for RSA-related traits and PUE-related traits of 15 maize F
1 under low and high P conditions
| Traits |
Relative mid-parent heterosis (%) |
Significance between LP and HP |
| LP |
HP |
| Mean |
Max |
Min |
LSD0.05 |
Mean |
Max |
Min |
LSD0.05 |
| RSA-related traits in the seedling stage |
| SRN |
80.2 |
158 |
12.1 |
104 |
−7.73 |
17.3 |
−36.4 |
27.2 |
* |
| CRN |
13.8 |
32.3 |
−17.1 |
33.9 |
9.26 |
44.5 |
−18.1 |
28 |
NS |
| TRL |
72.8 |
134 |
−50.5 |
55.5 |
5.34 |
81.5 |
−50.5 |
31.1 |
* |
| TLRL |
104 |
192 |
40.2 |
65 |
9.33 |
96.8 |
−49.9 |
45.5 |
* |
| LRN |
24.3 |
50.6 |
−5.4 |
30.4 |
−0.27 |
26.9 |
−24.8 |
19.2 |
* |
| SDW |
174 |
454 |
75.2 |
98.7 |
−1.89 |
19.8 |
−36.5 |
30.9 |
* |
| RDW |
112 |
230 |
56 |
93.9 |
5.97 |
61.1 |
−22.1 |
34.5 |
* |
| RS |
−20.3 |
2.79 |
−41.1 |
30.9 |
9.49 |
33.5 |
−13.1 |
30.9 |
* |
| P acquisition per plant |
167 |
448 |
58.3 |
113 |
−1.22 |
41.3 |
−35.5 |
39.4 |
* |
| PUE-related traits in the mature stage |
| GY |
446 |
975 |
115 |
346 |
2308 |
21318 |
136 |
4599 |
* |
| Pup |
143 |
237 |
55.8 |
84.4 |
174 |
386 |
60.3 |
88.5 |
* |
| PUE |
108 |
214 |
8.99 |
46.7 |
726 |
7934 |
46.8 |
2211 |
* |
| HI |
77.8 |
211 |
11.3 |
39.3 |
337 |
3395 |
30.1 |
903 |
* |
* indicates significance at 0.05 probability levels; NS: not significant
Table 4
Apparent correlation of biomass and root morphological traits between the mid-parent and hybrid performance
| Traits |
LP |
HP |
| RSA-related traits in the seedling stage |
| SRN |
0.288 |
−0.301 |
| CRN |
0.692** |
−0.393 |
| TRL |
−0.044 |
0.014 |
| TLRL |
0.26 |
−0.186 |
| LRN |
0.272 |
−0.09 |
| SDW |
−0.516* |
−0.079 |
| RDW |
0.219 |
0.134 |
| RS |
−0.15 |
−0.067 |
| P acquisition per plant |
0.049 |
−0.264 |
| PUE-related traits in the mature stage |
| GY |
0.161 |
0.151 |
| Pup |
0.567* |
0.647** |
| PUE |
−0.01 |
0.235 |
| HI |
0.437 |
0.253 |
*, ** indicate significance at 0.05 and 0.01 probability levels, respectively.
Variance analysis indicated that the parental inbred lines and their F1 were significantly different in both P treatments (Table 2), and so the combining ability of these traits was analyzed further. Analysis of variance for combining ability revealed GCA and SCA had significant contributions (p < 0.05, 0.01) for most traits under low and high P levels (Table 5). For the RSA-related traits, the variance of GCA was significant for CRN, TRL, TLRL, and P acquisition per plant in the low P level, and the variance of GCA for all traits except for SDW was significant in the high P level. The variance of SCA was significant for TLRL in low P level, and significant for all traits except for CRN in high P level. For the PUE-related traits, the variance of GCA was significant for all traits except for GY in the low P level. The variance of SCA showed a similar pattern except that SCA was not significant for GY in the high P level.
Table 5
Variance analysis of general combining ability (GCA) and specific combining ability (SCA) of RSA- and PUE-related traits of 15 maize F
1 under low and high P levels
|
RSA-related traits |
PUE-related traits |
| df |
SRN |
CRN |
TRL |
TLRL |
LRN |
SDW |
RDW |
RS |
P acquisition per plant |
GY |
Pup |
PUE |
HI |
| LP |
| GCA |
6 |
0.57 |
10.6** |
8630** |
407** |
3.02 |
0.06 |
2.64E-04 |
1.85E-04 |
0.47* |
163366 |
3.29** |
3449** |
1.10E-02** |
| SCA |
14 |
0.3 |
0.9 |
3692 |
168* |
3.7 |
0.06 |
3.73E-04 |
1.34E-04 |
0.28 |
287367** |
1.42** |
290 |
2.11E-03 |
| Error |
40 |
0.24 |
0.69 |
2116 |
57 |
8.17 |
0.03 |
5.94E-04 |
1.67E-04 |
0.16 |
82219 |
0.37 |
395 |
1.22E-03 |
| HP |
| GCA |
6 |
0.55** |
7.16** |
144372** |
1522** |
56.2** |
0.31 |
0.014** |
4.49E-04** |
13.4* |
996352** |
39.0** |
2528** |
1.26E-02** |
| SCA |
14 |
0.34* |
1.59 |
59247** |
734** |
22.8* |
0.82** |
0.014** |
9.58E-05 |
12.7* |
348686 |
10.9** |
1725** |
2.94E-03** |
| Error |
40 |
0.13 |
0.91 |
5554 |
153 |
7.64 |
0.2 |
0.003 |
8.90E-05 |
4.47 |
198642 |
2.44 |
146 |
6.99E-04 |
Values are the mean squares from ANOVA. F1 were derived from 6 inbred lines by diallel mating.
*, ** indicate significance at 0.05 and 0.01 probability levels, respectively.
GCA effects for the tested parental inbred lines showed large variations and was influenced by P level (Table 6). Inbred line P1 had positive GCA estimates for TRL, and P acquisition per plant in the low P level, and SRN, TLRL, LRN and P acquisition per plant in the high P level. P2 and P6 had similar GCA estimates at different P treatments as both had consistent positive GCA estimates for root traits indicating that they would be well suited to be combined. P3 and P4 had a negative GCA for most root traits at both P treatments indicating that they would be possibly poorly combined. P5 had negative GCA estimates for SRN, CRN and TLRL with others traits being influenced by positive GCA estimate under high P level. For PUE-related traits, P1 and P5 had a significant positive GCA estimate for GY in high P level indicating the superiority of these two lines in terms of general combining ability. However, P2, P3, P4 and P6 had negative GCA estimates. Pup, PUE and HI had similar GCA estimates, with some parental lines showing a positive GCA and others negative.
Table 6
Effects of general combining ability (GCA) for RSA- and PUE-related traits of 6 maize parents inbred lines under low P and high P levels
| Treatment |
RSA-related traits |
PUE-related traits |
| SRN |
CRN |
TRL |
TLRL |
LRN |
RDW |
RS |
P acquisition per plant |
GY |
Pup |
PUE |
HI |
| LP |
| P1 |
–b |
−1.89* |
56.7* |
−8.94* |
– |
– |
– |
0.32 |
– |
−0.74* |
22.4* |
−0.01 |
| P2 |
– |
0.64 |
50.8* |
17.1* |
– |
– |
– |
−0.34 |
– |
0.33 |
12.1 |
0.01 |
| P3 |
– |
−1.31* |
−48.9* |
−8.17* |
– |
– |
– |
0.03 |
– |
0.54 |
−37.8* |
−0.06* |
| P4 |
– |
2.68* |
−3.3 |
−6.36 |
– |
– |
– |
−0.34 |
– |
−1.40* |
39.5* |
0.10* |
| P5 |
– |
−0.51 |
−50.8* |
0.91 |
– |
– |
– |
−0.15 |
– |
1.09* |
−15 |
−0.01 |
| P6 |
– |
0.39 |
−4.44 |
5.5 |
– |
– |
– |
0.47* |
– |
0.19 |
−21.2* |
−0.01 |
| LSD0.05 a |
– |
1.21 |
66.6 |
10.9 |
– |
– |
– |
0.59 |
– |
0.88 |
28.8 |
0.05 |
| HP |
| P1 |
0.41* |
−1.44* |
−2.6 |
0.36 |
1.1 |
−0.04 |
−0.011* |
1.3 |
569* |
1.46 |
4.47 |
−0.06* |
| P2 |
0.16 |
1.03* |
213* |
33.8* |
−1.67 |
0.06* |
0.009* |
−0.91 |
−345 |
−2.67* |
12.1* |
0.06* |
| P3 |
0.26 |
−1.42* |
−247* |
−18.9* |
−5.00* |
−0.01 |
−0.009* |
0.56 |
−116 |
1.78* |
−22.9* |
−0.04* |
| P4 |
−0.29 |
1.60* |
−176* |
−18.2* |
−2.43 |
−0.08* |
−0.005 |
−3.30* |
−511* |
−5.08* |
40.8* |
0.08* |
| P5 |
−0.59* |
−0.67 |
4.58 |
−4.19 |
2.68* |
0.01 |
0 |
0.81 |
674* |
2.75* |
−6.97 |
−0.03* |
| P6 |
0.06 |
0.90* |
208* |
7.14 |
5.31* |
0.06* |
0.016* |
1.54 |
−271 |
1.75* |
−27.5* |
−0.01 |
| LSD0.05a |
0.52 |
1.38 |
108 |
17.9 |
4 |
0.07 |
0.014 |
3.06 |
645 |
2.26 |
17.5 |
0.04 |
* GCA was significantly different from zero at
p = 0.05.
a For comparison between the GCA of inbred lines at the same P level.
b These traits were not analyzed further.
The performance for SCA estimates in the F1 also varied in magnitude among the RSA- and PUE-related traits, heavily influenced by P levels (Table 7). For TLRL under the low P level, C6 had a significant positive SCA estimate, while C7 and C11 had a significant negative SCA estimates. In high P level, a significant positive SCA effect for SRN was found in C9, with a significant negative SCA effects found in C1 and C14. For TRL, significant positive SCA effects were found in C5 and C13, with significant negative SCA effects found in C2, C4 and C14. The GY performance for SCA estimates showed that all hybrid F1 with positive SCA values had greater yield than the mean except for hybrid F1 C10, C12 and C14 under low P level (Fig. 2, Table 7). For example, the GY of C4 which had a positive SCA effect showed a much higher GY than C15 which had a negative SCA effect under low and high P levels. For Pup, C9 and C13 had significant positive SCA estimates, while C7 and C15 had significant negative SCA estimates under low P level. C9, C11 and C15 had significant (either positive or negative) SCA estimates for Pup, PUE and HI at the high P level.
Table 7
Effects of specific combining ability (SCA) for RSA- and PUE-related traits of 15 maize F
1 under low and high P levels. F
1 (C1–C15) were derived from 6 inbred lines by diallel mating
| Lines |
RSA-related traits |
PUE-related traits |
| LP |
HP |
LP |
HP |
| TLRL |
SRN |
TRL |
TLRL |
LRN |
SDW |
RDW |
P acquisition per plant |
GY |
Pup |
Pup |
PUE |
HI |
| C1 |
−10.3 |
−0.92* |
−68.1 |
9.8 |
−0.88 |
−1.18* |
−0.16* |
−4.21* |
74.7 |
0.88 |
1.93 |
−5.07 |
−0.08* |
| C2 |
10.1 |
−0.12 |
−170* |
−16.1 |
1.23 |
−0.4 |
−0.03 |
−1.94 |
−65.5 |
−0. 50 |
2.28 |
−41.3* |
−0.05* |
| C3 |
1.14 |
0.43 |
45.7 |
13.8 |
1.32 |
0.92* |
0.18* |
2.29 |
−259 |
−0.27 |
−0.86 |
24.5* |
0.03 |
| C4 |
4.74 |
0.29 |
−250* |
−24.6* |
0.31 |
0.06 |
−0.03 |
1.46 |
314 |
0.32 |
−0.49 |
27.3* |
0.05* |
| C5 |
−5.71 |
0.32 |
443* |
17.1 |
−1.98 |
0.58 |
0.04 |
2.39 |
−63.5 |
−0.45 |
−2.86* |
−5.39 |
0.05* |
| C6 |
18.6* |
0.34 |
116 |
−29.1* |
4.44* |
−0.07 |
−0.05 |
0.09 |
59.8 |
−0.4 |
0.84 |
−13.7 |
0.04* |
| C7 |
−14.4* |
−0.08 |
57.7 |
8.63 |
−0.38 |
−0.13 |
0 |
−0.4 |
−754* |
−1.87* |
2.23 |
−50.5* |
0 |
| C8 |
6.84 |
−0.02 |
−77.9 |
25.7* |
3.12 |
0.07 |
0.06 |
−0.6 |
−128 |
−0.38 |
−2 |
12 |
−0.01 |
| C9 |
−0.79 |
0.67* |
−28 |
−15.1 |
−6.31* |
1.29* |
0.16* |
5.12* |
747* |
1.76* |
−3.00* |
57.2* |
0.05* |
| C10 |
−5.84 |
−0.11 |
22.6 |
−8.96 |
0.97 |
−0.06 |
−0.01 |
−0.16 |
123 |
0.6 |
−3.62* |
36.3* |
−0.02 |
| C11 |
−20.6* |
−0.35 |
70.3 |
9.75 |
−8.68* |
0.2 |
0.08 |
0.46 |
−98 |
0.31 |
−3.55* |
35.9* |
0.04* |
| C12 |
−2.32 |
0.24 |
−39 |
44.4* |
2.03 |
0.34 |
0.02 |
1.56 |
19 |
−0.02 |
4.05* |
−17.1 |
−0.02 |
| C13 |
9.62 |
0.53 |
254* |
11 |
−1.46 |
0.58 |
−0.03 |
3.02 |
733* |
1.28* |
3.25* |
−25.4* |
−0.01 |
| C14 |
9.47 |
−0.78* |
−380* |
−24.5* |
−0.45 |
−1.31* |
−0.14* |
−4.74* |
157 |
0.25 |
−0.99 |
15.1 |
0 |
| C15 |
−0.64 |
−0.45 |
4 |
−21.9* |
6.71* |
−0.9 |
−0.08 |
−4.34* |
−821* |
−1.54* |
2.77* |
−49.9* |
−0.07* |
| LSD0.05a |
18.9 |
0.89 |
187 |
31 |
6.94 |
1.12 |
0.13 |
5.3 |
719 |
1.53 |
3.92 |
30.3 |
0.07 |
| LSD0.05b |
15.5 |
0.73 |
153 |
25.3 |
5.66 |
0.92 |
0.11 |
4.33 |
587 |
1.25 |
3.2 |
24.7 |
0.05 |
* SCA was significantly different from zero at
p = 0.05.
a For comparison between the F
1 of which one of parents was same.
b For comparison between the F
1 of which neither of parents was same.
Discussion
Crop production relies on large inputs of P fertilizers. Despite being a finite natural resource, P use is very inefficient. The environmental and financial costs of using P fertilizers are high. Developing crop varieties with enhanced P efficiency will make a key contribution to sustainable use of P resources. Due to the significant role of roots in the acquisition of water and mineral nutrients, plant breeders are paying more attention to roots to increase PUE and crop yield in agriculture. Previous research to enhance PUE and grain yield by genetic improvements of RSA have been reported (Chin et al. 2011, Gamuyao et al. 2012, Gu et al. 2016). However, RSA has seldom been selected as the important agricultural trait in conventional breeding programs. In this study, 6 maize inbred lines and their 15 F1 created by a diallel mating system were used to analyze the genetic associations between RSA and PUE. These findings can provide a successful case to apply to genetically improving PUE in maize.
Response of RSA-related traits to low P stress
Low P stress significantly affected all RSA-related traits in the seedling stage, except for SRN in the case of both the parental inbred lines and their F1 (Fig. 1, Supplemental Table 1). In this study, all genotypes showed a decrease of SDW and RDW at low P level, and most genotypes had higher root to shoot ratios. A similar study was reported by Liu et al. (2004), in which low P availability increased root to shoot ratio, lateral root length, and acid phosphatase activity in roots and on the root surface. Similar to P, low N stress increased the root to shoot ratio as an adaptive response for a plant to conserve the ability to acquire more N from the soil (Chun et al. 2005).
Through a simulated three-dimensional development of maize root architecture varying across six phosphorus levels, Postma et al. (2014) found that reduced leaf area expansion and increased root to shoot ratio improve the P status of the maize plant under low P stress. Simultaneously, the improved P status increases the relative allocation of carbohydrates to the shoot, reducing the availability of carbohydrates for root growth. The post-embryonic shoot-borne roots play an important role in maize for the later growth and development stages (Hochholdinger and Tuberosa 2009). The result in our work showed the CRN was reduced under low P conditions for all the genotypes. This may reduce root metabolic costs by reducing competition for P within and among plants. Lateral roots have a strong influence on root system architecture (Lynch 1995) and are responsible for the majority of water and nutrient uptake of the maize plant (McCully and Canny 1988). To overcome P-starvation, plants RSA have evolved many adaptive strategies, some of which involve dramatic changes in lateral root growth, such as increases in lateral root number, length and lateral root branch density (Lynch 2011, Postma et al. 2014). In our experiment, some genotypes exhibit increases in TLRL and LRN when grown under low P conditions, others displayed little or no response (Fig. 1, Supplemental Table 1). Similar results were observed by Chin et al. (2010) and Shimizu et al. (2004) in rice root system studies.
Yield and PUE performance under low P conditions
Large variation in grain yield commonly exists among the maize genotypes under different P treatments (Fig. 2, Supplemental Table 2). The P stress level chosen for this study resulted in yield loss ranging from 35.6%–99.2% with an average of 57.3% for the parental inbred lines, and 25.7%–49.0% with an average of 40.2% for the F1. Liu et al. (2003) and Plenet et al. (2000) also reported the similar result that maize grain yield was significantly decreased under low P stress. In this study, among six inbred lines P1 and P3 were extremely sensitive to low P stress. Their reduction of GY under low P was mainly resulted from the significant decreases of kernel size and grain number per kernel. In addition, P stress leads to an increased anthesis-silking interval, which often negatively affect the pollination and kernel development.
Under low P conditions, the highest yielding F1 were C9 and C13. They displayed a relatively higher CRN, TRL, TLRL and PUE in the low P level. The hybrids performed higher GY under stress conditions, showing that it is possible to combine stress tolerance and yield potential in maize hybrids (Betrán et al. 2003). This implies that RSA-related trait responsiveness to P stress could be a potential criterion for current commercial breeding programs. A major component of this is likely to be breeding for increased yield, which is a significant component of early root establishment in the field. Increasing total root length and lateral root length, whilst maintaining or decreasing P acquisition of shoot, will lead to increased PUE and then increase the yield. Similar results have been reported with evaluating genotypes for PUE as a potential criterion for breeding higher yielding varieties (Romer and Schenk 1998).
Heterosis, GCA and SCA of RSA- and PUE-related traits as affected by low P stress
Heterosis is the major factor responsible for the better adaptability of hybrids to stress conditions as compared to the parental inbred lines (Chun et al. 2005, Ishola 2016). In this study, heterosis effects for RSA- and PUE-related traits were significant between low and high P conditions (Table 3). Relative mid-parent heterosis for root traits were expressed more under the P stress condition compared with the high P condition. It is indicated that the root size of the F1 was improved by utilizing heterosis at low P level (Fig. 1). Chun et al. (2005) also observed that low N significantly increased the heterosis of total and lateral root length. For above-ground, heterosis for PUE-relative traits were comparatively greater under high P conditions and reduced significantly under low P stress. This phenomenon indicates root traits are relatively better adapted to low P stress than PUE-related traits. Significant correlations between the mid-parent and their hybrid progenies were only found in CRN, SDW in the low P stress condition. Pup showed significant correlations between the mid-parent and their F1 at both P treatments (Table 4). Similar weak correlations were observed for different agriculture traits between the parental lines and their F1 (Balko and Russell 1980, Lafitte and Edmeades 1995).
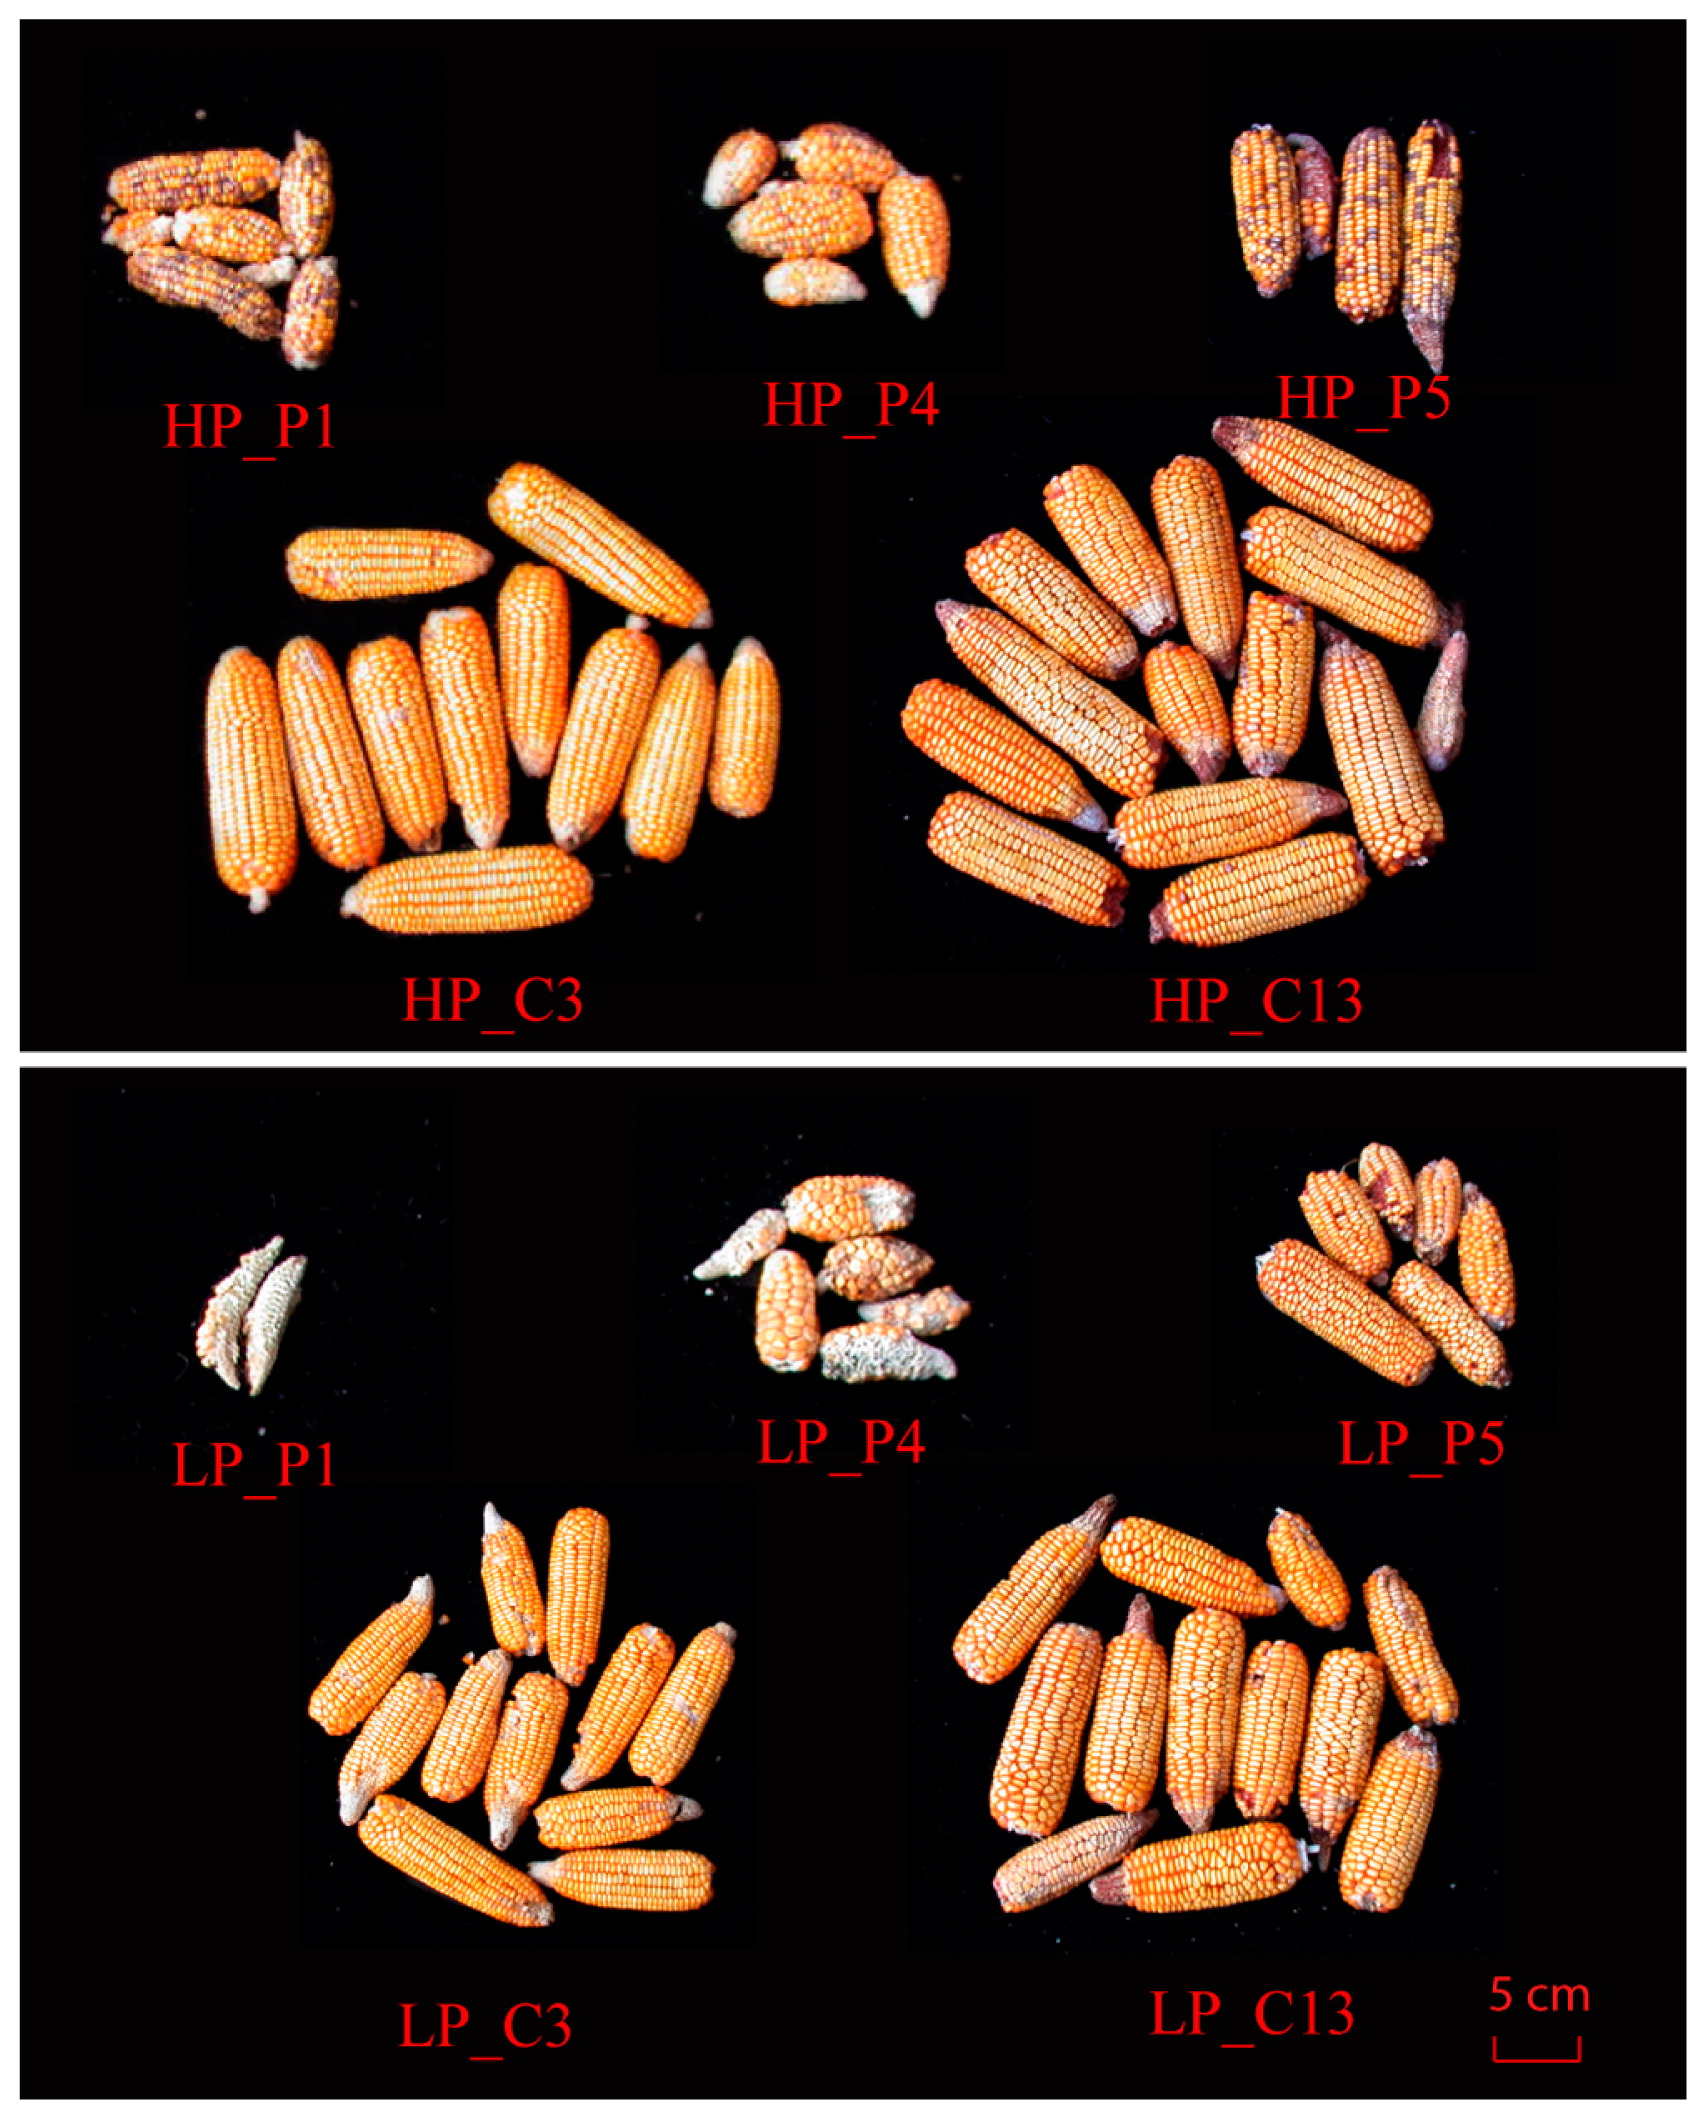
The effect of SCA was significant for most root traits and PUE related traits in low P stress condition. With respect to both P conditions observed in this study, C1, C4 and C13 showed stable yield performance. C3 (P1 × P4) and C13 (P4 × P5) presented quite different responses to low P for grain yield and root traits (TRL and TLRL) despite having one common parent (Figs. 2, 3). C13 showed much higher grain yield than C3 in low P condition because the P5 parental line of C13, was insensitive to low P stress. This may be due to its SCA which enables more prevalent genes in the roots into the F1 during hybridization. The results also showed that C3 had the highest PUE with a lower Pup in the low P stress. This indicates that C3 can achieve an average yield with 19% (data not shown) less P fertilizer input and reduce the grain P concentration by 12.8% (data not shown) in low P condition. In grain crops, phytic acid is the major organic storage form of P, which is non-available for humans and monogastric animals (Raboy 2001). The amount of phytic acid-P stored in the seed is equal to 65% of the global annual P fertilizer input (Lott et al. 2000). Therefore, breeding genotypes with low seed P concentration may offer health and environmental benefits. Liu et al. (2013) identified quantitative trait loci (QTLs) associated with grain phytic acid-P concentration which can be improved without affecting inorganic P concentration and grain nitrogen concentration.
In conclusion, low P supply had a significant effect on heterosis, GCA and SCA of RSA- and PUE-related traits. Maize hybrids respond to low P stress by reducing aboveground P demand and grain P concentration to enhance the PUE and achieve stable grain yield. Thus, breeding for a relatively high yield hybrids with reducing above-ground P demand and grain P concentration should be sufficient to reduce P fertilizer input and improve P efficiency.
Acknowledgments
This work was financially supported by National Key R&D Program of China [2017 YFD0200204]; National Natural Science Foundation of China [31572186, 31421092].
Literature Cited
- Balko, L.G. and W.A. Russell (1980) Effects of rates of nitrogen fertilizer on maize inbred lines and hybrid progeny. II. Correlations among agronomic traits. Maydica 25: 81–94.
- Barraclough, P.B., J.R. Howarth, J. Jones, R. Lopez-Bellido, S. Parmar, C.E. Shepherd and M.J. Hawkesford (2010) Nitrogen efficiency of wheat: Genotypic and environmental variation and prospects for improvement. Eur. J. Agron. 33: 1–11.
- Betrán, F.J., D. Beck, M. Bänziger and G.O. Edmeades (2003) Genetic analysis of inbred and hybrid grain yield under stress and nonstress environments in tropical maize. Crop Sci. 43: 807–817.
- Bolanos, J. and G.O. Edmeades (1993) Eight cycles of selection for drought tolerance in lowland tropical maize. 1. Responses in grain-yield, biomass, and radiation utilization. Field Crops Res. 31: 233–252.
- Cai, H.G., F.J. Chen, G.H. Mi, F.S. Zhang, H.P. Maurer, W.X. Liu, J.C. Reif and L.X. Yuan (2012) Mapping QTLs for root system architecture of maize (Zea mays L.) in the field at different developmental stages. Theor. Appl. Genet. 125: 1313–1324.
- Chin, J.H., X.C. Lu, S.M. Haefele, R. Gamuyao, A. Ismail, M. Wissuwa and S. Heuer (2010) Development and application of gene-based markers for the major rice QTL phosphorus uptake 1. Theor. Appl. Genet. 120: 1073–1086.
- Chin, J.H., R. Gamuyao, C. Dalid, M. Bustamam, J. Prasetiyono, S. Moeljopawiro, M. Wissuwa and S. Heuer (2011) Developing rice with high yield under phosphorus deficiency: Pup1 sequence to application. Plant Physiol. 156: 1202–1216.
- Chun, L., G.H. Mi, J.S. Li, F.J. Chen and F.S. Zhang (2005) Genetic analysis of maize root characteristics in response to low nitrogen stress. Plant Soil 276: 369–382.
- Cordell, D., J.O. Drangert and S. White (2009) The story of phosphorus: Global food security and food for thought. Global Environ. Change (A Hum. Policy Dimens.) 19: 292–305.
- Dawson, C.J. and J. Hilton (2011) Fertiliser availability in a resource-limited world: Production and recycling of nitrogen and phosphorus. Food Policy 36: S14–S22.
- De Dorlodot, S., B. Forster, L. Pages, A. Price, R. Tuberosa and X. Draye (2007) Root system architecture: Opportunities and constraints for genetic improvement of crops. Trends Plant Sci. 12: 474–481.
- Den Herder, G., G. Van Isterdael, T. Beeckman and I. De Smet (2010) The roots of a new green revolution. Trends Plant Sci. 15: 600–607.
- Gamuyao, R., J.H. Chin, J. Pariasca-Tanaka, P. Pesaresi, S. Catausan, C. Dalid, I. Slamet-Loedin, E.M. Tecson-Mendoza, M. Wissuwa and S. Heuer (2012) The protein kinase Pstol1 from traditional rice confers tolerance of phosphorus deficiency. Nature 488: 535–539.
- Griffing, B. (1956) Concept of general and specific combining ability relation to diallel crossing systems. Aust. J. Biol. Sci. 9: 463–493.
- Gu, R.L., F.J. Chen, L.Z. Long, H.G. Cai, Z.G. Liu, J.B. Yang, L.F. Wang, H.Y. Li, J.H. Li, W.X. Liu et al. (2016) Enhancing phosphorus uptake efficiency through QTL-based selection for root system architecture in maize. J. Genet. Genomics 43: 663–672.
- Haling, R.E., L.K. Brown, A.G. Bengough, I.M. Young, P.D. Hallett, P.J. White and T.S. George (2013) Root hairs improve root penetration, root–soil contact, and phosphorus acquisition in soils of different strength. J. Exp. Bot. 64: 3711–3721.
- Hermans, C., J.P. Hammond, P.J. White and N. Verbruggen (2006) How do plants respond to nutrient shortage by biomass allocation? Trends Plant Sci. 11: 610–617.
- Hochholdinger, F. and R. Tuberosa (2009) Genetic and genomic dissection of maize root development and architecture. Curr. Opin. Plant Biol. 12: 172–177.
- Ishola, A.I. (2016) Diallel analysis of extra early maize (Zea mays L.) inbred lines for drought and low nitrogen tolerance. Master Degree Thesis, Kwame Nkrumah University, Kumasi.
- Lafitte, H.R. and G.O. Edmeades (1995) Association between traits in tropical maize inbred lines and their hybrids under high and low soil-nitrogen. Maydica 40: 259–267.
- Liu, J.C., Y.Q. Huang, W.Q. Ma, J.F. Zhou, F.R. Bian, F.J. Chen and G.H. Mi (2013) Identification of quantitative trait loci for phytic acid concentration in maize grain under two nitrogen conditions. J. Integr. Agric. 12: 765–772.
- Liu, X.S. (2003) Physiological and genetic analysis of genotypic variation of phosphorus use efficiency in maize (Zea mays L.). Master Degree Thesis, China Agricultural University, Beijing.
- Liu, X.S., F.J. Chen, L. Chun, J.L. Song and G.H. Mi (2003) Genotypic difference of maize inbred lines intolerance to phosphorus deficiency. J. Maize Sci. 11: 22–27.
- Liu, Y., G.H. Mi, F.J. Chen, J.H. Zhang and F.S. Zhang (2004) Rhizosphere effect and root growth of two maize (Zea mays L.) genotypes with contrasting p efficiency at low p availability. Plant Sci. 167: 217–223.
- Lott, J.N.A., I. Ockenden, V. Raboy and G.D. Batten (2000) Phytic acid and phosphorus in crop seeds and fruits: A global estimate. Seed Sci. Res. 10: 11–13.
- Lynch, J.P. (1995) Root architecture and plant productivity. Plant Physiol. 109: 7–13.
- Lynch, J.P. (2007) Roots of the second green revolution. Aust. J. Bot. 55: 493–512.
- Lynch, J.P. (2011) Root phenes for enhanced soil exploration and phosphorus acquisition: Tools for future crops. Plant Physiol. 156: 1041–1049.
- Manschadi, A.M., G.G.B. Manske and P.L.G. Vlek (2013) Root Architecture and Resource Acquisition—Wheat as a Model Plant. In: Eschel, A. and T. Beeckman (eds.) Plant Roots: The Hidden Half, fourth edn. CRC Press, Taylor & Francis Group, USA, pp. 22.1–22.18.
- Manschadi, A.M., H.P. Kaul, J. Vollmann, J. Eitzinger and W. Wenzel (2014) Developing phosphorus-efficient crop varieties-an interdisciplinary research framework. Field Crops Res. 162: 87–98.
- Manske, G.G.B., J.I. Ortiz-Monasterio, M. Van Ginkel, R.M. Gonzalez, R.A. Fischer, S. Rajaram and P.L.G. Vlek (2001) Importance of P uptake efficiency versus p utilization for wheat yield in acid and calcareous soils in Mexico. Eur. J. Agron. 14: 261–274.
- Marschner, H. (1995) Mineral nutrition in Plant, second ed. Academic Press, San Diego, CA.
- Mccully, M.E. and M.J. Canny (1988) Pathways and processes of water and nutrient movement in roots. Plant Soil 111: 159–170.
- Miguel, M. (2011) Functional role and synergistic effect of root traits for phosphorus acquisition efficiency and their genetic basis in common bean (Phaseolus vulgaris L.). Philosophy Doctor Thesis. The Pennsylvania State University, University Park, PA.
- Moll, R.H., E.J. Kamprath and W.A. Jackson (1982) Analysis and interpretation of factors which contribute to efficiency of nitrogen-utilization. Agron. J. 74: 562–564.
- Murphy, J. and J.P. Riley (1962) A modified single solution method for the determination of phosphate in natural-waters. Anal. Chim. Acta 27: 31–36.
- Ozturk, L., S. Eker, B. Torun and I. Cakmak (2005) Variation in phosphorus efficiency among 73 bread and durum wheat genotypes grown in a phosphorus-deficient calcareous soil. Plant Soil 269: 69–80.
- Plenet, D., A. Mollier and S. Pellerin (2000) Growth analysis of maize field crops under phosphorus deficiency. II. Radiation-use efficiency, biomass accumulation and yield components. Plant Soil 224: 259–272.
- Postma, J.A., A. Dathe and J.P. Lynch (2014) The optimal lateral root branching density for maize depends on nitrogen and phosphorus availability. Plant Physiol. 166: 590–602.
- Raboy, V. (2001) Seeds for a better future: ‘Low phytate’, grains help to overcome malnutrition and reduce pollution. Trends Plant Sci. 6: 458–462.
- Richardson, A.E., J.P. Lynch, P.R. Ryan, E. Delhaize, F.A. Smith, S.E. Smith, P.R. Harvey, M.H. Ryan, E.J. Veneklaas, H. Lambers et al. (2011) Plant and microbial strategies to improve the phosphorus efficiency of agriculture. Plant Soil 349: 121–156.
- Romer, W. and H. Schenk (1998) Influence of genotype on phosphate uptake and utilization efficiencies in spring barley. Eur. J. Agron. 8: 215–224.
- Shen, J.B., L.X. Yuan, J.L. Zhang, H.G. Li, Z.H. Bai, X.P. Chen, W.F. Zhang and F.S. Zhang (2011) Phosphorus dynamics: From soil to plant. Plant Physiol. 156: 997–1005.
- Shimizu, A., S. Yanagihara, S. Kawasaki and H. Ikehashi (2004) Phosphorus deficiency-induced root elongation and its QTL in rice (Oryza sativa L.). Theor. Appl. Genet. 109: 1361–1368.
- Tuberosa, R., M.C. Sanguineti, P. Landi, M. Michela Giuliani, S. Salvi and S. Conti (2002) Identification of QTLs for root characteristics in maize grown in hydroponics and analysis of their overlap with QTLs for grain yield in the field at two water regimes. Plant Mol. Biol. 48: 697–712.
- Vance, C.P., C. Uhde-Stone and D.L. Allan (2003) Phosphorus acquisition and use: Critical adaptations by plants for securing a nonrenewable resource. New Phytol. 157: 423–447.
- Wang, J., J.H. Sun, J. Miao, J.K. Guo, Z.L. Shi, M.Q. He, Y. Chen, X.Q. Zhao, B. Li, F.P. Han et al. (2013) A phosphate starvation response regulator Ta-PHR1 is involved in phosphate signaling and increases grain yield in wheat. Ann. Bot. 111: 1139–1153.
- Wang, X., J. Shen and H. Liao (2010a) Acquisition or utilization, which is more critical for enhancing phosphorus efficiency in modern crops? Plant Sci. 179: 302–306.
- Wang, X., X. Yan and H. Liao (2010b) Genetic improvement for phosphorus efficiency in soybean: A radical approach. Ann. Bot. 106: 215–222.
- Williamson, L.C., S. Ribrioux, A.H. Fitter and H.M.O. Leyser (2001) Phosphate availability regulates root system architecture in Arabidopsis. Plant Physiol. 126: 875–882.
- Zhao, J., J.B. Fu, H. Liao, Y. He, H. Nian, Y.M. Hu, L.J. Qiu, Y.S. Dong and X.L. Yan (2004) Characterization of root architecture in an applied core collection for phosphorus efficiency of soybean germplasm. Chin. Sci. Bull. 49: 1611–1620.

