Abstract
The genome-wide characterization of single nucleotide polymorphism (SNP) between cultivars or between inbred lines contributes to the creation of genetic markers that are important for plant breeding. Functional markers derived from polymorphisms within genes that affect phenotypic variation are especially valuable in plant breeding. Here, we report on the genome re-sequencing and analysis of the two parental inbred lines of the commercial F1 hybrid Chinese cabbage cultivar “W77”. Through the genome-wide identification and classification of the SNPs and indels present in each parental line, we identified about 1,500 putative non-functional genes in each parent. We designed cleaved amplified polymorphic sequence (CAPS) markers using specific mutations found at Eco RI restriction sites in the parental lines and confirmed their Mendelian segregation by constructing a linkage map using 96 F2 plants derived from the F1 hybrid cultivar, “W77”. Our results and data will be a useful genomic resource for future studies of gene function and metagenomic studies in Chinese cabbage.
Introduction
The Brassicaceae is a moderately-sized taxonomic family, with 338 genera and 3,709 plant species (Warwick et al. 2006) and comprises a set of scientifically and agriculturally important crop cultivars. B. rapa shows morphological variation (morphotypes), and comprises commercially important vegetable crops consumed worldwide. They include leafy vegetables such as Chinese cabbage (var. pekinensis), pak choi (var. chinensis), and komatsuna (var. perviridis), root vegetables such as turnip (var. rapa), and oilseed (var. oleifera). The draft genome sequence of Chinese cabbage (Chiifu-401-42) has been released, and 199 accessions of B. rapa representing various morphotypes have been resequenced (Cheng et al. 2016a, Wang et al. 2011). Chinese cabbage forms a head with large pale-green colored leaves and wide white midribs and is an important vegetable in Asia. Most commercial cultivars of Chinese cabbage are F1 hybrids that show heterosis or hybrid vigor, which refers to the superior performance of hybrid progeny relative to their parents (Fujimoto et al. 2012, Saeki et al. 2016, Schnable and Springer 2013). The production of F1 hybrid seeds is based on the utilization of self-incompatibility or cytoplasmic male sterility (Fujimoto and Nishio 2007, Yamagishi and Bhat 2014).
There are various types of DNA markers such as cleaved amplified polymorphic sequences (CAPS), simple sequence repeats (SSRs), and single nucleotide polymorphisms (SNPs) used for the analysis and identification of varietal difference in agricultural cultivars. The advent of high-throughput sequencing technology has enabled the identification of SNPs, which are wide spread in plant genomes (Metzker 2010, Rafalski 2002), and various high throughput genotyping systems such as SNP arrays have been developed (Ganal et al. 2012). In B. rapa, SNPs detected by RNA-sequencing (RNA-seq) in coding regions have been used for developing gene-based markers (Paritosh et al. 2013). Cheng et al. (2016b) reported comparative variome analysis in a B. rapa collection, and identified millions of high quality SNPs. The application of SNP markers has been used to identify seed coat color, hairiness, leaf morphology, and flowering time in B. rapa (Li et al. 2009, Rahman et al. 2007, Zhang et al. 2009).
The knowledge of functional loss of genes caused by SNPs and the distribution of high impact SNPs in comparison to the B. rapa reference genome sequence is desirable for trait analyses and breeding programs. To promote the application of molecular breeding and the examination of agricultural traits in B. rapa, we characterized SNPs, genome structure, and composition between parental lines of the F1 hybrid cultivar of Chinese cabbage, “W77”, especially in protein coding genes, by re-sequencing the genomes of the parental lines. Alignment to the reference genome identified the parent-specific SNPs, indels, and other polymorphisms. We then identified the parental line specific mutations in Eco RI sites by genome-wide comparative analysis, and developed CAPS markers were for genetic analysis such as quantitative trait locus (QTL) analysis. This approach provides a relatively simple and easy method for the genotyping and analysis of cultivars, and the information obtained in this study will be useful for the application of molecular breeding in B. rapa, and the examination of agricultural traits such as heterosis.
Materials and Methods
Plant materials
The parental inbred lines, S11 (female) and R09 (male), of a commercial F1 hybrid cultivar of Chinese cabbage, “W77” (Watanabe Seed Co., Ltd., Japan) were used. F2 populations produced by bud pollination of “W77” were used for construction of a genetic linkage map.
Whole genome sequencing
Genomic DNAs from 14 days 1st and 2nd leaves in S11 and R09 were isolated using DNeasy Plant Mini Kit (Qiagen). Sequence libraries for paired-end short reads were constructed using an Illumina TruSeq DNA LT Sample Prep Kit (Illumina). The library was sequenced on the HiSeq high output 150PE (read length; 150 bp, paired-end sequencing). The data have been deposited with links to BioProject accession number PRJNA385249 in the NCBI BioProject database (https://www.ncbi.nlm.nih.gov/bioproject/).
Identification of SNPs and indels
Reads were first quality controlled using fastqc (version 0.11.5) with low quality reads being discarded and adapter removal done using bcl2fastq2 Conversion Software (version v2.16.0). Only reads where 80 percent of the bases had a PHRED quality score of 20 or higher (−q 20 −p 80) were retained for alignment. The read pairs were then individually aligned to the B. rapa reference genome (version 1.5; http://brassicadb.org/brad/) using bwa aln (version 0.7.15). The individual paired-end read alignment information was then combined using bwa sampe (Li and Durbin 2009). The combined alignment in Binary Alignment/Map (BAM) format was then sorted and indexed using samtools (version 1.4 using htslib v1.4). The identification of SNPs and indels was carried out using the samtools mpileup command with the following options, −q 20 (minimum mapping quality score of 20), −Q 30 (minimum base quality score of 30). The resulting binary variant call formatted (BCF) file was then analyzed using bcftools (version 1.4 using htslib v1.4) to call SNPs and indels with the following options, −p 0.9 (variant appears in at least 10% of total reads for a given position), −v (only output variants), −c (use consensus calling algorithm). Because both S11 and R09 are homozygous inbred lines, positions that were called as being heterozygous with respect to the reference were filtered out. The remaining homozygous variants were analyzed with bcftools stats to obtain the total number of SNPs and indels present in the S11 and R09 lines, and the BCF files annotated using snpEff (version 4.3i) (http://snpeff.sourceforge.net/) to identify the putative effects on protein translation and high-impact mutations. Further analysis of the annotated BCF files and the identification and analysis of Eco RI sites containing mutations was then performed using custom python scripts and/or bash shell scripts. The scripts are available at http://www.github.com/danshea/SNP_analysis.
To validate the SNPs detected by above methods, we performed direct sequencing of PCR products. PCR was performed using the following conditions; 1 cycle of 94°C for 3 min, 35 cycles of 94°C for 30 s, 55°C for 30 s, and 72°C for 1 min, and final extension at 72°C for 3 min. For sequence analysis, the amplified PCR fragments were treated by illustra ExoProStar (GE Healthcare Life Sciences) and were sequenced using ABI Prism 3130 (Applied Biosystems). Primer sequences used in this study are shown in Supplemental Table 1.
Gene ontology analysis
Analysis for enrichment of gene functional ontology terms was completed using the gene ontology (GO) tool agriGO (Du et al. 2010). Statistical tests for enrichment of functional terms used the hypergeometric test and false discovery rate (FDR) correction for multiple testing to a level of 5% FDR.
Construction of genetic linkage map
The linkage map was constructed by JoinMap 4.1 software (Van Ooijen 2006) using individual genotyping data of 96 F2 plants derived from the commercial F1 hybrid cultivar “W77”. Sixty-seven CAPS markers developed in this study and 20 CAPS markers previously developed, and markers in S locus glycoprotein (SLG) (primer sets; PS5/PS15 and PS3/PS21), Clubroot resistance 1a (Crr1a) (mCrr1a-F/R), and MULTICOPY SUPRESSOR OF IRA1a (MSH1a) were used for the genotyping of the F2 plants (Kawamura et al. 2016a, 2016b).
For genotyping, PCR was performed using the following conditions; 1 cycle of 94°C for 3 min, 35 cycles of 94°C for 30 s, 55°C for 30 s, and 72°C for 1 min, and final extension at 72 °C for 3 min. Using CAPS markers developed in this study, amplified DNA digested by Eco RI restriction enzyme were electrophoresed on 1.5% agarose gel. Using CAPS markers previously developed (Kawamura et al. 2016b), amplified DNA digested by Hha I, Mbo I, or Msp I restriction enzymes were electrophoresed on 13% polyacrylamide gel. The gel was stained with Gelstar solution (0.1 μl/10 ml; Takara Biomedical, Japan). Primer sequences used in this study are shown in Supplemental Table 1.
Results
Identification of SNPs between parental lines
We performed whole genome re-sequencing in S11 and R09 using the Illumina HiSeq high output 150PE. Approximately 68.7 M and 73.2 M reads were obtained in S11 and R09, respectively. In total, 41.9 M reads in S11 (61.1%) and 46.4 M reads in R09 (63.4%) were mapped to the B. rapa reference genome with 20.5 M reads in S11 (29.8%) and 22.7 M reads in R09 (31.0%) uniquely mapped to the B. rapa reference genome. These mapping rates are consistent with the total assembly size of 238.8 Mb for the B. rapa reference genome, Chiifu-401-42 (Wang et al. 2011) in comparison to the total estimated size of 485 Mb for the B. rapa genome (Cheng et al. 2014), as the reference covers approximately 49.2% of the total genome. Total reads mapped with a mean read depth greater than 24× and with more than 91% whole genome coverage (Supplemental Table 2). Individual coverage for chromosome 1 to 10 resulted in coverage depth greater than 19× with 87% or greater coverage per chromosome in both S11 and R09 (Supplemental Table 3). A total of 0.93 M and 0.92 M SNPs were found in S11 and R09, respectively, and 0.43 M SNPs (47%) were shared between these two lines (Supplemental Table 4). The most frequently occurring substitutions were transitions, A/G (28%) and T/C (28%), in both S11 and R09, with transition/transversion (Ts/Tv) ratios of 1.28 and 1.27 in S11 and R09, respectively (Supplemental Table 5).
The total number of shared SNPs per chromosome was similar between chromosomes in S11 and R09, while the chromosomal distribution of SNPs differed between S11 and R09 with respect to the reference genome (Fig. 1A, Supplemental Table 4). We validated the SNPs by Sanger sequencing of PCR products in 13 and 12 genes in S11 and R09, respectively, and all SNPs (13 genes/106 SNPs in S11, 12 genes/100 SNPs in R09) detected by whole genome re-sequencing were confirmed by individual Sanger sequencing (Supplemental Tables 6, 7). Although our methods could only identify the short indels ranging from –46 bp (deletion) to 52 bp (insertion) (Supplemental Fig. 1), we identified 0.13 M indels in S11 and R09 (Supplemental Table 8).
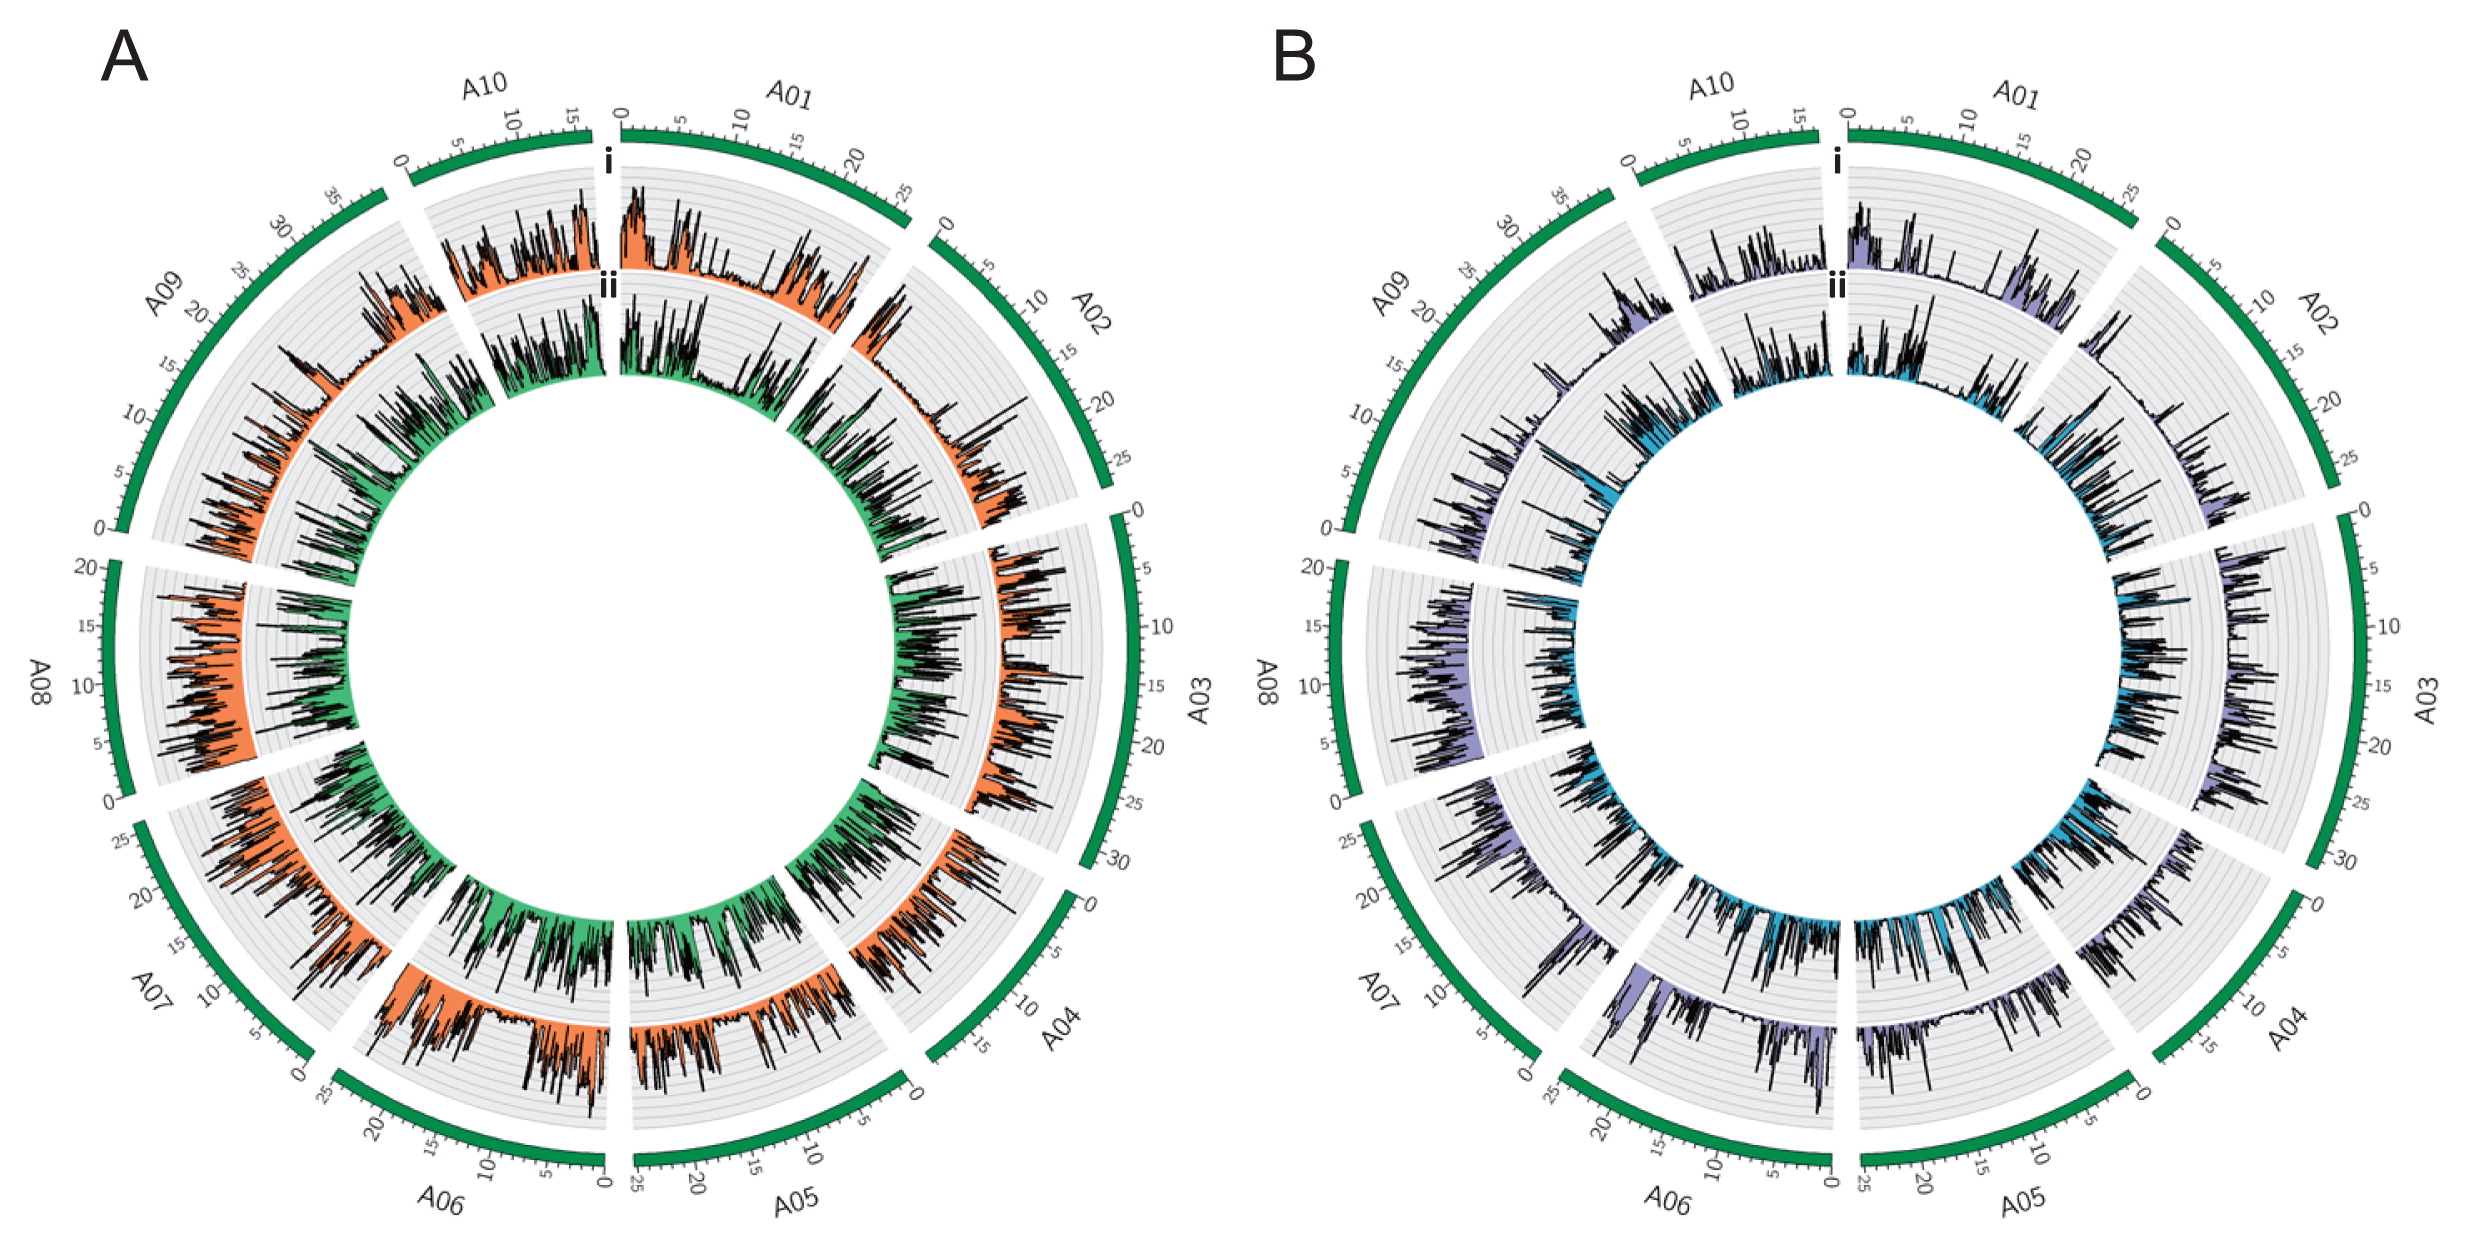
Next, we identified the ‘parent-unique SNPs’ by finding SNPs occurring in one parent, but not in the other, with overlapping SNPs in S11 and R09 omitted. In total, 0.50 M and 0.48 M SNPs were S11- and R09-unique SNPs, respectively (Supplemental Table 9). The most frequently occurring substitutions were transitions, A/G (29%) and T/C (29% in S11 and 28% in R09), in both S11- and R09-unique (Supplemental Table 5). The total number of SNPs per chromosome was similar between chromosomes in S11- and R09-unique (Supplemental Table 9), while the chromosomal distribution of SNPs differed between S11- and R09-unique (Fig. 1B). We also identified 0.075 M and 0.076 M S11- and R09-unique indels, respectively (Supplemental Table 8).
Screening of the SNPs resulting in different protein function between parental lines
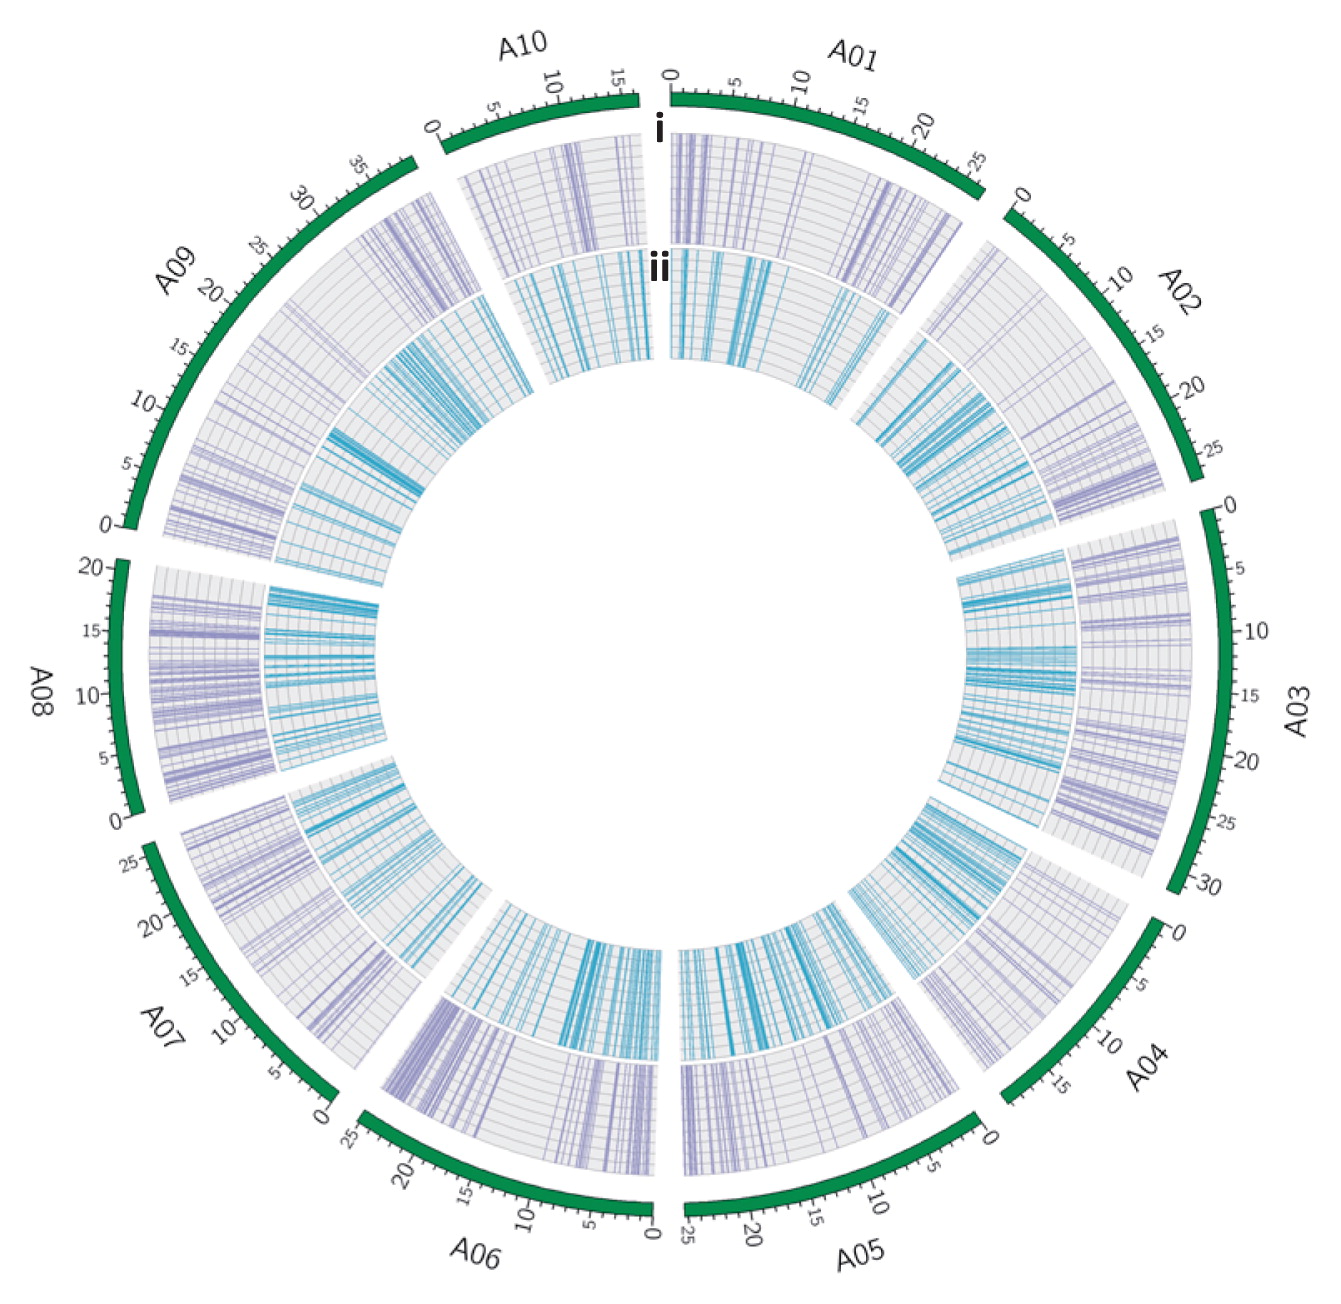
To identify the SNPs, which have a potential to affect protein function, we categorized the S11- and R09-unique SNPs and indels occurring in genic regions into eight groups (six groups in exons and two groups in introns) (Table 1). The 27,177 and 27,228 of 41,020 genes had one or more S11- or R09-unique SNPs/indels, respectively. Among SNPs in coding sequence (CDS), moderate-impact SNPs are non-synonymous mutations without changing the reading frame of the amino acid sequence. We identified 37,899 and 38,614 S11- and R09-unique SNPs resulting in non-synonymous mutations, respectively, corresponding to 8,558 and 8,473 genes in S11 and R09, respectively. To assess high impact variants, variant call files were annotated with snpEff and were classified as SNPs or indels causing frameshifts, nonsense mutations, or other mutations that could possibility result in the loss of gene function. A total of 1,949 and 1,999 S11- and R09-unique SNPs/indels were categorized into high impact variants, and the number of genes containing high impact variations was 1,492 and 1,561 in S11 and R09, respectively. Of these, 118 genes containing high impact variations overlapped between S11 and R09, due to the different position of SNPs/indels between S11 and R09 causing a loss of gene function in the same genes. There is a possibility that these genes have become pseudogenes. Thus 1,374 and 1,443 genes were S11- and R09-specific and non-functional, respectively. Genes having S11- and R09-specific mutations were distributed throughout the chromosomes with high density (Fig. 2).
Table 1
Classification of total SNPs and unique SNPs in exon and intron regions for S11 and R09 parental lines
|
CDS |
Intron |
|
Non synonymous |
Synonymous |
Nonsense |
Stop Lost |
Frame Shift (indels) |
Nonframeshift (indels) |
Splice junction |
Others |
| Between S11 and reference genome |
76,368 |
123,184 |
934 |
512 |
1,528 |
3,599 |
16,872(3,152) |
162,279(25,590) |
| Between R09 and reference genome |
77,093 |
128,297 |
982 |
527 |
1,525 |
3,732 |
17,537 (3,439) |
166,010 (26,252) |
| Unique in S11 |
37,899 |
63,464 |
473 |
226 |
876 |
2,116 |
9,135 (1,843) |
90,290 (15,344) |
| Unique in R09 |
38,614 |
68,582 |
520 |
240 |
873 |
2,249 |
9,798 (2,128) |
94,018 (15,996) |
( ) indicates number of indels.

Using genes having S11- and R09-unique SNPs/indels causing high impact variants, we performed a Gene Ontology (GO) analysis. In S11, 3, 24, and 34 categories were overrepresented (p < 1.0E-10) in GO cellular component (CC), GO molecular function (MF), and GO biological process (BP), respectively (Supplemental Table 10). In R09, 7, 31, and 56 categories were overrepresented (p < 1.0E-10) in CC, MF, and BP, respectively (Supplemental Table 11). GO categories of ‘Integral to membrane’ and ‘Membrane part’ in CC, ‘Binding’, ‘Protein binding’, and ‘Nucleotide binding’ in MF, and ‘Metabolic process’, ‘Oxidation reduction’, and ‘Protein modification process’ in MF were overrepresented in both S11 and R09 (Supplemental Tables 10, 11). Most categories were overrepresented in both S11 and R09 (Supplemental Tables 10, 11).
Developing CAPS markers for making a linkage map
To convert the SNP marker to another type of DNA marker, which does not require expensive equipment such as SNP array, we develop CAPS markers, which allow us to distinguish parental genotypes with co-dominance using agarose gel electrophoresis, providing an easy and low-cost method of genotyping. We selected Eco RI sites (54,390 sites in reference genome) for analysis because it is a low-cost restriction enzyme. We then identified the S11 or R09-unique mutations in Eco RI sites. The 703 and 762 positions had mutations at Eco RI sites in S11 and R09, respectively. These sites were distributed throughout the genome (Fig. 3), and in sufficient number for making DNA markers to be utilized in QTL analysis.
We developed CAPS markers (HBI series) at four to nine positions in each chromosome in order to verify the parent-unique mutation in Eco RI and segregation of CAPS markers based on these SNPs. Sixty-seven CAPS markers with 23 previously developed CAPS markers (Kawamura et al. 2016b) were tested on 96 F2 populations derived from “W77”. Using genotyping information of these markers, linkage maps covering about 730 cM were constructed (Supplemental Fig. 2). The order of DNA markers in each chromosome was consistent with their positions in the reference genome except for the positions of HBI058 and HBI059. Comparative analysis of the physical map and the genetic map showed wide genome coverage, with markers spanning each chromosome (Supplemental Fig. 3). This demonstrated that we captured the S11 or R09-unique mutations in Eco RI sites precisely.
Discussion
We determined the complete genome sequence of the parental lines (S11 and R09) of the commercial F1 hybrid cultivar, “W77”, to identify the genes showing functional differences between them. About 70 M reads were obtained and 30% of these reads were uniquely mapped to the B. rapa reference genome. This mapping rate is explained by the facts that the proportion of the B. rapa reference genome assigned to physical chromosomes constitutes approximately 50% of the total estimated genome size for B. rapa (Wang et al. 2011), and multiple mapped reads were excluded. The mean read depth was greater than 24× with more than 91% coverage, suggesting that our data depth is sufficient for SNP detection.
The most frequently occurring substitutions were transitions, and transition/transversion (Ts/Tv) ratios were 1.28 and 1.27 in S11 and R09, respectively. Previous studies have reported a range of Ts/Tv ratios, 1.09 for B. rapa ssp. pekinensis cv. Chiifu (Park et al. 2010) to 1.45 for B. rapa chromosome data derived from B. napus re-sequencing data (Bus et al. 2012). The bias of transitions to transversions is due in part to the common mutation of 5-methylcytosine to thymine through deamination, however it appears that this bias may be taxon dependent (Keller et al. 2007). This idea is consistent with the reported Ts/Tv ratios found in other plants such as eggplant, with a Ts/Tv of 1.65 (Barchi et al. 2011) and maize, where the Ts/Tv was reported to be 1.5 (Morton et al. 2006). On the other hand, the range of values reported for the B. rapa genome suggests that the Ts/Tv ratio also exhibits some intra-species variation. The chromosomal distribution of SNPs differed between S11 and R09 with respect to the reference genome. This result agrees with previous re-sequencing analyses performed on 199 B. rapa accessions, which showed that SNP distribution was evenly distributed across chromosomes (Cheng et al. 2016a).
We developed a pipeline to identify the S11- or R09-unique SNPs and genes with non-synonymous substitutions between the parental lines. Additionally, we found genes whose function is lost in one parent and performed GO analysis using these one-parent-specific non-functional genes. Most categories that were overrepresented in S11- and R09-specific non-functional genes were similar, suggesting that SNPs at these loci exhibit no bias with respect to gene function. Furthermore, the lack of a significant effect may be attributed, in part, to the triplicated structure of the B. rapa genome as most genes have multiple paralogs, having undergone a whole-genome triplication event approximately 9–15 million years ago (MYA) (Cheng et al. 2014). A previous genome-wide comparative study of B. rapa has shown that both polyploidy and chromosomal diploidization concomitantly act to stabilize the B. rapa genome, reducing an individual gene’s selective pressure, consequently resulting in the differential loss of duplicated genes (Mun et al. 2009).
We detected about 1,500 positions having mutations at Eco RI sites between parental lines and they were distributed throughout the genome. We developed 67 CAPS markers and confirmed their segregation by constructing linkage maps; the order of most DNA markers was consistent with that of the positions indicated by the reference genome. If more DNA markers are needed for making a higher density of the linkage map, we can develop new markers for approximately 1,500 Eco RI loci distributed throughout the genome. Furthermore, we can make more CAPS markers using SNPs occurring at the sites of other restriction enzymes (Supplemental Fig. 4).
The low impact and neutral SNPs found within functional genes may be applied for creating SNPs markers in genes. Because there is a high possibility that SNPs resulting in the loss of protein function may affect the traits of plants, as opposed to neutral SNPs, developing gene-targeted markers using SNPs categorized into high impact variants are more likely to be functional markers, and therefore more effective for genetic analysis than random SNP markers (Andersen and Lübberstedt 2003). The fidelity of the previously unreported genome-wide variations with respect to the reference, for these two B. rapa inbred lines, further highlights the variation present between inbred lines and provides an additional data set to researchers for meta-genomic comparisons. Furthermore, our classification of the SNPs by their putative impact on gene function can assist future functional gene studies.
Acknowledgements
We thank Dr. Elizabeth S. Dennis for helpful comments and manuscript editing. We also thank Mr. Shuhei Konno, Ms. Tomoko Kusumi, Dr. Tomoko Matsubara, Ms. Shoko Nose, Ms. Aiko Umemura, Dr. Takahiro Kawanabe, Mr. Hirofumi Abe, Dr. Natsumi Saeki, Mr. Naoki Fukushima, Ms. Sonoko Ishikura, and Mr. Hiroya Tomita for their technical assistance. This work was supported by a Grant-in-Aid Young Scientists (A) (15H05614) (JSPS) and PRESTO (JPMJPR12B8) (JST) to R. Fujimoto.
Literature Cited
- Andersen, J.R. and T. Lübberstedt (2003) Functional markers in plants. Trends Plant Sci. 8: 554–560.
- Barchi, L., S. Lanteri, E. Portis, A. Acquadro, G. Valè, L. Toppino and G.L. Rotino (2011) Identification of SNP and SSR markers in eggplant using RAD tag sequencing. BMC Genomics 12: 304.
- Bus, A., J. Hecht, B. Huettel, R. Reinhardt and B. Stich (2012) High-throughput polymorphism detection and genotyping in Brassica napus using next-generation RAD sequencing. BMC Genomics 13: 281.
- Cheng, F., J. Wu and X. Wang (2014) Genome triplication drove the diversification of Brassica plants. Hortic. Res. 1: 14024.
- Cheng, F., R. Sun, X. Hou, H. Zheng, F. Zhang, Y. Zhang, B. Liu, J. Liang, M. Zhuang, Y. Liu et al. (2016a) Subgenome parallel selection is associated with morphotype diversification and convergent crop domestication in Brassica rapa and Brassica oleracea. Nat. Genet. 48: 1218–1224.
- Cheng, F., J. Wu, C. Cai, L. Fu, J. Liang, T. Borm, M. Zhuang, Y. Zhang, F. Zhang, G. Bonnema et al. (2016b) Genome resequencing and comparative variome analysis in a Brassica rapa and Brassica oleracea collection. Sci. Data 3: 160119.
- Du, Z., X. Zhou, Y. Ling, Z. Zhang and Z. Su (2010) agriGO: a GO analysis toolkit for the agricultural community. Nucleic Acids Res. 38: W64–W70.
- Fujimoto, R. and T. Nishio (2007) Self incompatibility. Adv. Bot. Res. 45: 139–154.
- Fujimoto, R., J.M. Taylor, S. Shirasawa, W.J. Peacock and E.S. Dennis (2012) Heterosis of Arabidopsis hybrids between C24 and Col is associated with increased photosynthesis capacity. Proc. Natl. Acad. Sci. USA 109: 7109–7114.
- Ganal, M.W., A. Polley, E.M. Graner, J. Plieske, R. Wieseke, H. Luerssen and G. Durstewitz (2012) Large SNP arrays for genotyping in crop plants. J. Biosci. 37: 821–828.
- Kawamura, K., T. Kawanabe, M. Shimizu, K. Okazaki, M. Kaji, E.S. Dennis, K. Osabe and R. Fujimoto (2016a) Genetic characterization of inbred lines of Chinese cabbage by DNA markers; towards the application of DNA markers to breeding of F1 hybrid cultivars. Data Brief 6: 229–237.
- Kawamura, K., T. Kawanabe, M. Shimizu, A.J. Nagano, N. Saeki, K. Okazaki, M. Kaji, E.S. Dennis, K. Osabe and R. Fujimoto (2016b) Genetic distance of inbred lines of Chinese cabbage and its relationship to heterosis. Plant Gene 5: 1–7.
- Keller, I., D. Bensasson and R.A. Nichols (2007) Transition-transversion bias is not universal: a counter example from grasshopper pseudogenes. PLoS Genet. 3: e22.
- Li, F., H. Kitashiba, K. Inaba and T. Nishio (2009) A Brassica rapa linkage map of EST-based SNP markers for identification of candidate genes controlling flowering time and leaf morphological traits. DNA Res. 16: 311–323.
- Li, H. and R. Durbin (2009) Fast and accurate short read alignment with Burrows-Wheeler transform. Bioinformatics 25: 1754–1760.
- Metzker, M.L. (2010) Sequencing technologies—the next generation. Nat. Rev. Genet. 11: 31–46.
- Morton, B.R., I.V. Bi, M.D. McMullen and B.S. Gaut (2006) Variation in mutation dynamics across the maize genome as a function of regional and flanking base composition. Genetics 172: 569–577.
- Mun, J.H., S.J. Kwon, T.J. Yang, Y.J. Seol, M. Jin, J.A. Kim, M.H. Lim, J.S. Kim, S. Baek, B.S. Choi et al. (2009) Genome-wide comparative analysis of the Brassica rapa gene space reveals genome shrinkage and differential loss of duplicated genes after whole genome triplication. Genome Biol. 10: R111.
- Paritosh, K., S.K. Yadava, V. Gupta, P. Panjabi-Massand, Y.S. Sodhi, A.K. Pradhan and D. Pental (2013) RNA-seq based SNPs in some agronomically important oleiferous lines of Brassica rapa and their use for genome-wide linkage mapping and specific-region fine mapping. BMC Genomics 14: 463.
- Park, S., H.J. Yu, J.H. Mun and S.C. Lee (2010) Genome-wide discovery of DNA polymorphism in Brassica rapa. Mol. Genet. Genomics 283: 135–145.
- Rafalski, A. (2002) Applications of single nucleotide polymorphisms in crop genetics. Curr. Opin. Plant Biol. 5: 94–100.
- Rahman, M., P.B.E. McVetty and G. Li (2007) Development of SRAP, SNP and multiplexed SCAR molecular markers for the major seed coat color gene in Brassica rapa L. Theor. Appl. Genet. 115: 1101–1107.
- Saeki, N., T. Kawanabe, H. Ying, M. Shimizu, M. Kojima, H. Abe, K. Okazaki, M. Kaji, J.M. Taylor, H. Sakakibara et al. (2016) Molecular and cellular characteristics of hybrid vigour in a commercial hybrid of Chinese cabbage. BMC Plant Biol. 16: 45.
- Schnable, P.S. and N.M. Springer (2013) Progress toward understanding heterosis in crop plants. Annu. Rev. Plant Biol. 64: 71–88.
- Van Ooijen, J.W. (2006) JoinMap® 4.0: software for the calculation of genetic linkage maps in experimental populations. Kyazma BV, Wageningen, Netherlands.
- Wang, X., H. Wang, J. Wang, R. Sun, J. Wu, S. Liu, Y. Bai, J.H. Mun, I. Bancroft, F. Cheng et al. (2011) The genome of the mesopolyploid crop species Brassica rapa. Nat. Genet. 43: 1035–1039.
- Warwick, S.I., A. Francis and I.A. Al-Shehbaz (2006) Brassicaceae: species checklist and database on CD-Rom. Plant Syst. Evol. 259: 249–258.
- Yamagishi, H. and S.R. Bhat (2014) Cytoplasmic male sterility in Brassicaceae crops. Breed. Sci. 64: 38–47.
- Zhang, J., Y. Lu, Y. Yuan, X. Zhang, J. Geng, Y. Chen, S. Cloutier, P.B.E. McVetty and G. Li (2009) Map-based cloning and characterization of a gene controlling hairiness and seed coat color traits in Brassica rapa. Plant Mol. Biol. 5: 553–563.
