Research Papers
Identification and validation of QTLs for 100-seed weight using chromosome segment substitution lines in soybean
2018 年 68 巻 4 号 p. 442-448

詳細
2018 年 68 巻 4 号 p. 442-448
The 100-seed weight (100SW) is one of the most important traits that control soybean yield. To identify the quantitative trait loci (QTL) of 100SW, 120 BC3F5 chromosome segment substitution lines (CSSLs) were cultivated over three years. The CSSLs were developed from a cross between the cultivated soybean variety ‘Jackson’ and the wild soybean accession ‘JWS156-1’, followed by continuous backcrossing using ‘Jackson’ variety as a recurrent parent. A total of nine QTLs (qSW8.1, qSW9.1, qSW12.1, qSW13.1, qSW14.1, qSW16.1, qSW17.1, qSW17.2, and qSW20.1) were detected on eight chromosomes. Of these, qSW12.1 (LOD = 6.78–12.31) was detected over the three successive years on chromosome 12 as a novel, stable, and major QTL. To validate the effect of qSW12.1, a residual heterozygous line (RHL), RHL564, which showed heterozygous at the qSW12.1 region, was selected from the BC3F5 population. Of the two homologous genotypes in the progenies produced by self-pollination of RHL564, a higher seed weight was observed in the ‘Jackson’ genotype plants than that in the ‘JWS156-1’ genotype plants. qSW12.1 was delimited in an interval of approximately 1,348 kb between the BARCSOYSSR_12_1282 and BARCSOYSSR_12_1347 markers on chromosome 12.
Soybean [Glycine max (L.) Merr.] is a primary crop for protein and oil production. With its increasing industrial and agricultural usages, soybean production has achieved sustainable growth worldwide (USDA-FAS, http://www.fas.usda.gov/). Grain yield improvement is always a priority in soybean breeding practice. The seed weight, which is generally expressed as 100-seed weight (100SW), is one of the most important yield components in soybean. Several studies have demonstrated a positive association between seed weight/size and seed yield (Burris et al. 1973, Smith and Camper 1975). Seed weight has also been reported to be associated with seed germination and vigor (Edwards and Hartwig 1971). The soybean varieties developed in the tropical and subtropical countries, such as India and Indonesia, tend to have a small seed size compared with varieties from the temperate regions, such as USA, China, and Japan. In addition, seed size is also an important factor for soybean end-use. Although a small seed size is preferred for natto and soy sprouts, a large seed size is preferred for vegetable soybean and tofu. Therefore, depending on end-use or location of growth, different soybean varieties with different seed sizes have been established.
Over the past decades, many studies have focused on genetic studies of seed weight/size in the soybean, particularly using the DNA marker for quantitative trait locus (QTL) analyses. To date, many QTLs of seed weight/size on all the 20 chromosomes have been reported in SoyBase (http://www.soybase.org/). However, owing to the nature of multi-gene effects for controlling seed weight/size, most of the QTLs were minor and not validated. Examples of major seed-weight QTLs include one that is mapped on chromosome 17, qSw17-1 (Kato et al. 2014), and another, swHCC2-1, associated with Satt460 on chromosome 6 (Han et al. 2012). Both QTLs demonstrated major and stable effects and a high level of phenotypic variation in multiple populations and environments.
Compared with other major crops, such as rice (Duan et al. 2015, Hu et al. 2015, Wang et al. 2015), knowledge about the molecular mechanisms of seed weight control in soybean is limited. To date, only two seed weight/size related genes have been isolated from soybean. The ln (narrow leaf) gene has a large effect on the number of seeds per pod and seed size (Jeong et al. 2012), and recently, the PP2C-1 (protein phosphatase type-2C) allele from wild soybean accession ZYD7 was found to contribute to the increase in seed size (Lu et al. 2017). Identification of a major and stable QTL for seed weight is important for facilitating the map-based cloning of seed-weight genes and understanding the molecular mechanisms underlying seed-weight control in soybean.
Most of the previously reported seed-weight QTLs were detected using bi-parental mapping populations, such as recombinant inbred lines. In recent years, QTLs associated with traits of interest have been identified using a more effective molecular breeding study strategy known as advanced backcross QTL (AB-QTL) analysis (Grandillo and Tanksley 2005). Through continuous backcrossing followed by successive self-pollination, different chromosomal segments of the donor parent were introgressed into the genetic background of the recurrent parent to produce chromosome segment substitution lines (CSSLs). In CSSLs, more than 90% of the genome was recovered by the recurrent parent after backcrossing thrice, thus, reducing the genetic background noise and improving the accuracy of gene mapping (Grandillo and Tanksley 2005). Several CSSL mapping populations have been created for soybean and have been used for QTL mapping of agronomy traits (Wang et al. 2013, Xin et al. 2016). For these CSSL populations, wild soybean (G. soja Sieb. & Zucc.), which is believed to be the wild progenitor of the cultivated soybean, was used as donor parent. The wild type has a higher genetic diversity than the cultivated form (Zhou et al. 2015), presenting a potential genetic resource pool for improvement of the cultivated soybean. The seed size of the wild soybean is approximately ten times smaller compared with the cultivated soybean. Thus, wild soybean is a particularly good material for genetic analyses of soybean seed weight. In this study, we used a CSSL population derived from crosses between the cultivated soybean variety ‘Jackson’ and wild soybean accession ‘JWS156-1’ to identify the seed-weight QTLs.
A total of 120 BC3F5 CSSLs were used to detect the 100SW QTL. The CSSL population was developed from a cross between the cultivated soybean variety ‘Jackson’ and the wild soybean accession ‘JWS156-1’. ‘Jackson’ is a soybean variety from the US (PI548657). JWS156-1 was selected from a wild soybean accession B06097, which was provided by the National BioResource Project-LegumeBase (https://www.legumebase.brc.miyazaki-u.ac.jp/top.jsp). The 100SW of ‘Jackson’ was around 22 g and that of ‘JWS156-1’ was about 2.2 g, which is a ten-fold difference. The wild soybean was the donor parent and the ‘Jackson’ cultivar was the recurrent parent. Different chromosomal segments of the wild soybean were introgressed into the genetic background of ‘Jackson’. These lines were developed by backcrossing of {[((‘Jackson’ × ‘JWS156-1’) × ‘Jackson’) × ‘Jackson’] × ‘Jackson’} and five successive generations of self-pollination without any selection (Supplemental Fig. 1).
To validate a novel major QTL (qSW12.1) detected in the current study, a residual heterozygous line (RHL), RHL564, which was heterozygous at the qSW12.1 QTL region, was selected from the BC3F5 population. Progenies produced by self-pollinating heterozygous plants of RHL564 were used to confirm the effect of qSW12.1.
Field trials and phenotypic evaluation of the BC3F5 CSSLsAll plant materials were grown in the experimental farm of the Japan International Research Center for Agricultural Sciences, Tsukuba, Ibaraki, Japan; located at 36.05°N, 140.08°E. The 120 BC3F5 CSSLs were grown in 2014, 2015, and 2016. In 2014, a single BC3F5 plant for each CSSL was evaluated for seed weight. Seeds harvested from the single plant were used for phenotype evaluation in 2015, and the bulked seeds harvested in 2015 for each CSSL were used for phenotype evaluation in 2016. Soybean seeds were sown on June 24, 2014; June 23, 2015; and June 21 2016. Each CSSL or cultivar was planted in a single 6-m long row plot, which contained 30 plants per row, with a row spacing of 60 cm and at a plant separation of 20 cm. All plots were arranged in a completely randomized block design with one (2014, 2015) or two (2016) replicates. Soybeans were harvested on November 14, 2014; November 12, 2015; and November 16 2016. A single BC3F5 plant from each line was harvested in 2014, whereas in 2015 and 2016, BC3F5 plants were harvested in bulk from each row. The individual plants at each end of the row were excluded from harvest in the three years.
After harvesting, soybean plants were air-dried in natural conditions for at least four weeks and then threshed. When the seed desiccation was complete, the 100SW trait was measured for each BC3F5 CSSL expressed as grams per 100 random healthy seeds.
SSR analysisGenomic DNA was extracted from young leaf tissues using a modified CTAB method. A total of 235 SSR soybean markers from all 20 chromosomes (Song et al. 2004, 2010) were used for genotyping the 120 CSSLs. The 235 SSR markers covered 2,073.79 cM with an average distance of 9.5 cM between two neighbor markers. The SSR reaction mix contained 2 μl (10 pmol) of each primer, 10 μl Quick TaqTMHS DyeMix (Toyobo, Osaka, Japan), and 3 μl (10–50 ng) of genomic DNA template in a total volume of 20 μl. The PCR was performed at 94°C for 30 s, followed by 32 cycles of 30 s at 94°C, 30 s at 55°C, 40 s at 72°C, and a final extension at 72°C for 10 min. After amplification, PCR products were separated on an 8% (w/v) denaturing polyacrylamide gel in 1 × TBE running buffer at 250 V for 3.5 h and stained using ethidium bromide. To detect polymorphisms in fragment size of the PCR products, the gel was scanned using the pharos FX Molecular Imager (Bio-Rad Laboratories, Hercules, USA).
QTL analysisQTL analysis was conducted with the IciMapping software (Meng et al. 2015). The Stepwise regression-based likelihood ratio tests of additive QTL (RSTEP-LRT-ADD) method was used to detect 100SW QTL. A threshold of LOD ≥ 3 was set to declare existence of a QTL.
Validation of the allelic effect of qSW12.1To further verify the effect of the qSW12.1 QTL detected in the current study, the residual heterozygous line (RHL), RHL564, was selected from the BC3F5 population. Homozygous plants with the ‘Jackson’ and ‘JWS156-1’ genotypes were selected from the progenies produced through the self-pollination of heterozygous plants of RHL564 using the SSR marker Sat_180 for genotyping. Because these two genotypes had a similar genetic background and differed only in the qSW12.1 region, they can be regarded as near-isogenic lines (NILs). For the homozygous plants with the ‘Jackson’ genotype, we designated the lines as NILs564-C, and the homozygous plants with the ‘JWS156-1’ genotype were designated as NILs564-W. Forty-three NILs564-C plants and 44 NILs564-W plants were evaluated in field condition in 2016. The cultivation conditions were the same as those used for the CSSLs in 2016. A two-tailed student’s t-test was performed to determine the statistical significance between NILs564-C and NILs564-W.
The graphical genotypes of the 120 CSSLs are represented in Supplemental Fig. 2. Of the 235 SSR markers, 224 markers had at least one ‘JWS156-1’ allele in the 120 CSSLs, and 11 markers demonstrated no wild soybean alleles as indicated by the small gaps in the graphical genotypes. The CSSLs were almost recovered by the recurrent parent ‘Jackson’ after backcrossing thrice, and no lines with abnormal growth were observed in the 120 CSSLs. The proportion of the recurrent parent ‘Jackson’ alleles in each CSSL ranged from 80.3% to 99.2% with an average of 92.9 ± 4.0%, which corresponded to the expected value, 93.8%.
The phenotypic variation of the BC3F5 CSSLs in the three yearsThe frequency distribution and statistical analysis of 100SW in the 120 BC3F5 CSSLs over the three years are shown in Fig. 1 and Table 1. The 100SW demonstrated a continuous distribution, and the seed size of most CSSLs was intermediate in comparison with that of the two parents. However, in 2014, 2015, and 2016, one, three, and one CSSLs, respectively, demonstrated a higher 100SW than the cultivated soybean ‘Jackson’. ANOVA analyses revealed significant effects (P < 0.01) of the different CSSLs and the different years. The 120 CSSLs showed a large variation in terms of 100SW, ranging approximately from 10 g to 22 g, with a two-fold difference. Over the three years, the highest average 100SW of all CSSLs was 19.84 g (2015), and the lowest was 16.89 g (2016), whereas the average in 2014 was 17.64 g. These results indicated different growth conditions over the three years. There was a strong positive correlation (P < 0.01) between different years (Fig. 2), suggesting that seed-weight trait has high hereditability in soybean and it is suitable for QTL analysis.

Frequency distribution of 100-seed weight of the 120 BC3F5 chromosome segment substitution lines in the years 2014 (A), 2015 (B), and 2016 (C). Comparison of the seed sizes between the ‘JWS156-1’ line and ‘Jackson’ (D).
| Year | Trait | Parents | BC3F5 CSSLs | |||||||||
|---|---|---|---|---|---|---|---|---|---|---|---|---|
| Jackson | JWS156-1 | SampleSizea | Mean | Varianceb | Stdc | Skewnessd | Kurtosise | Minimum | Maximum | Range | ||
| 2014 | 100SW (g) | 22.67 | 2.31 | 120 | 17.64 | 6.51 | 2.55 | −0.38 | −0.33 | 10.98 | 23.04 | 12.06 |
| 2015 | 100SW (g) | 23.63 | 2.34 | 120 | 19.84 | 5.26 | 2.29 | −0.46 | −0.06 | 12.40 | 24.46 | 12.06 |
| 2016 | 100SW (g) | 21.60 | 2.30 | 120 | 16.89 | 6.67 | 2.58 | −0.47 | −0.32 | 9.81 | 21.88 | 12.08 |

The correlation between the 100-seed weight of BC3F5 chromosome segment substitution lines over different years. ** Indicates significant correlation (P < 0.01).
Based on QTL analysis, four, five, and five SSR markers associated with 100SW were detected in 2014, 2015, and 2016, respectively (Table 2). These markers were distributed on chromosomes 8, 9, 12, 13, 14, 16, 17, and 20. BARCSOYSSR_14_0645 (3.00 < LOD < 6.63) located on chromosome 14 and Sat_180 (6.78 < LOD < 12.31) located on chromosome 12 were detected in all three years. Satt582 (7.16 < LOD < 8.99) located on chromosome 17 was detected in both 2014 and 2015. Satt431 (LOD = 4.52, chromosome 16), Satt490 (LOD = 3.77, chromosome 13), Satt354 (LOD = 3.83, chromosome 20), Sat_129 (LOD = 7.66, chromosome 8), Sat_126 (LOD = 3.46, chromosome 9), and Sat_086 (LOD = 3.33, chromosome 17) were detected in only one year. Overall, a total of nine markers were detected over the three years. Sat_180 had the highest LOD scores in 2015 and 2016 and the second highest LOD score in 2014. In all nine loci, the wild soybean allele contributed to decreasing seed size with effects ranging from −1.96 g to −0.87 g.
| Year | Marker name | QTL | Chr. (LG) | Physical position (bp)a/Genetic position (cM)b | LODc | PVE (%)d | Adde | M (QQ)f | M (qq)g | DHR(%)h |
|---|---|---|---|---|---|---|---|---|---|---|
| 2014 | Sat_180 | qSW12.1 | Gm12 (H) | 38,388,961/104.37 | 6.78 | 15.25 | −1.21 | 12.26 | 14.69 | 19.17 |
| BARCSOYSSR_14_0645 | qSW14.1 | Gm14 (B2) | 13,276,701/– | 3.00 | 6.27 | −1.11 | 12.37 | 14.59 | 8.33 | |
| Satt431 | qSW16.1 | Gm16 (J) | 35,718,476/78.57 | 4.52 | 9.72 | −1.38 | 12.10 | 14.86 | 8.33 | |
| Satt582 | qSW17.1 | Gm17 (D2) | 9,949,907/53.84 | 8.99 | 21.16 | −1.75 | 11.72 | 15.23 | 11.67 | |
| 2015 | Sat_180 | qSW12.1 | Gm12 (H) | 38,388,961/104.37 | 10.07 | 21.06 | −1.28 | 14.01 | 16.56 | 19.17 |
| Satt490 | qSW13.1 | Gm13 (F) | 36,699,447/97.97 | 3.77 | 6.94 | −0.87 | 14.41 | 16.16 | 14.17 | |
| BARCSOYSSR_14_0645 | qSW14.1 | Gm14 (B2) | 13,276,701/– | 5.18 | 9.80 | −1.24 | 14.05 | 16.53 | 8.33 | |
| Satt582 | qSW17.1 | Gm17 (D2) | 9,949,907/53.84 | 7.16 | 14.11 | −1.28 | 14.00 | 16.57 | 11.67 | |
| Satt354 | qSW20.1 | Gm20 (I) | 34,569,381/46.22 | 3.83 | 7.07 | −1.24 | 14.04 | 16.53 | 5.83 | |
| 2016 | Sat_129 | qSW8.1 | Gm8 (A2) | 14,730,465/84.08 | 7.66 | 13.16 | −1.95 | 7.74 | 11.63 | 6.67 |
| Sat_126 | qSW9.1 | Gm9 (K) | 44,406,619/108.19 | 3.46 | 5.46 | −1.43 | 8.25 | 11.12 | 5.00 | |
| Sat_180 | qSW12.1 | Gm12 (H) | 38,388,961/104.37 | 12.31 | 23.25 | −1.64 | 8.04 | 11.32 | 19.17 | |
| BARCSOYSSR_14_0645 | qSW14.1 | Gm14 (B2) | 13,276,701/– | 6.63 | 11.17 | −1.62 | 8.07 | 11.30 | 8.33 | |
| Sat_086 | qSW17.2 | Gm17 (D2) | 39,875,727/118.66 | 3.33 | 5.25 | −1.96 | 7.72 | 11.65 | 2.92 |
Based on their chromosome locations, nine 100SW QTLs, corresponding to the nine SSR markers associated with 100SW, were designated as qSW8.1, qSW9.1, qSW12.1, qSW13.1, qSW14.1, qSW16.1, qSW17.1, qSW17.2, and qSW20.1 (Table 2). For the three major and stable QTLs (qSW12.1, qSW14.1, and qSW17.1) that were detected in the current study, qSW14.1 may correspond to the seed-weight QTL reported by Hoeck et al. (2003) and Li et al. (2007), whereas qSW17.1 may correspond to the QTL (qSw17-1) detected by Kato et al. (2014). In contrast, no seed-weight QTL has been reported for the qSW12.1 region to date, suggesting that this is a novel major QTL in soybean.
Validating the allelic effect and determining the physical position of qSW12.1To further verify the effect of the qSW12.1 QTL, RHL564 was selected from the BC3F5 population. Homozygous plants with the ‘Jackson’ and ‘JWS156-1’ genotypes were selected from the progenies of RHL564 to produce qSW12.1 NILs (NILs564-C and NILs564-W). Field evaluation revealed that NILs564-C had 100SW of 18.64 ± 1.03 g, which was significantly (P < 0.01) higher than that of the NILs564-W plants (17.71 ± 1.25 g) (Fig. 3). This result confirms that the qSW12.1 QTL controls seed weight in soybean.
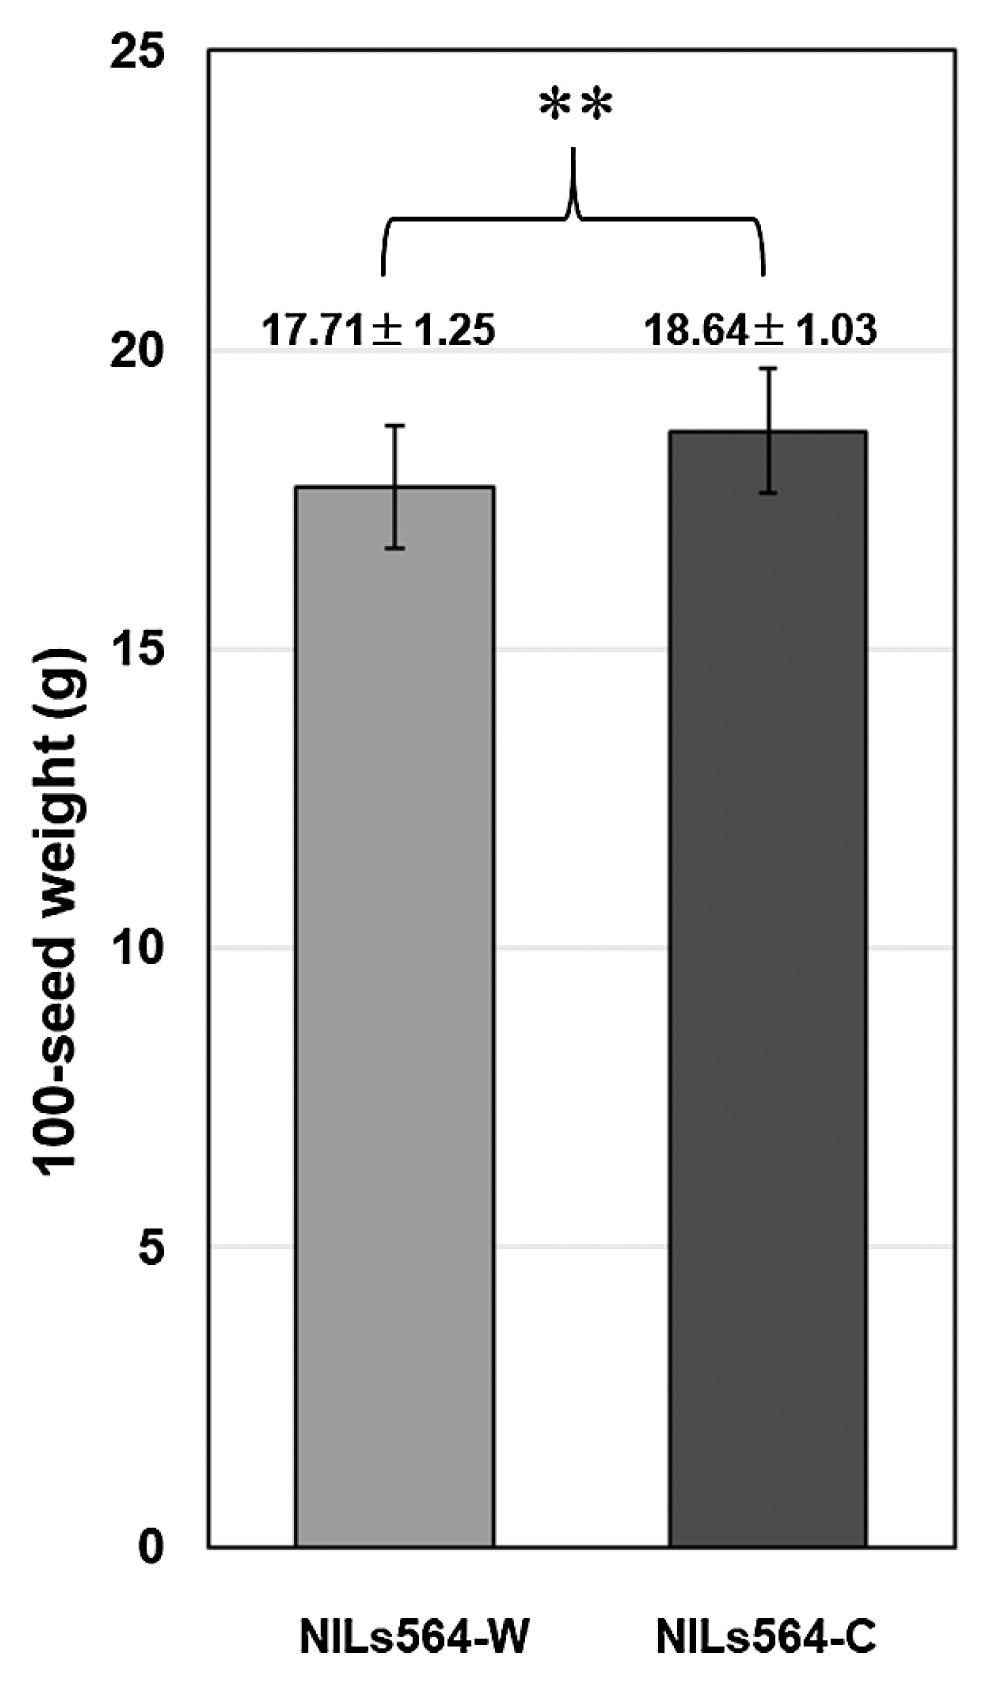
The allele effect of qSW12.1 in near-isogenic lines NILs564-C (‘Jackson’ genotype, n = 43) and NILs564-W (‘JWS156-1’ genotype, n = 44). Data are shown as means ± SD (standard deviation). ** Indicates significant difference between the means (P < 0.01).
Based on the genotyping of NILs564-C and NILs564-W derived from RHL564, we delimited qSW12.1 in a 1,348-kb interval between the BARCSOYSSR_12_1282 and BARCSOYSSR_12_1347 markers (Fig. 4). According to the soybean genome sequence of Glycine max Wm82.a2.v1 at Phytozome 12 (https://phytozome.jgi.doe.gov), there are 129 predicted genes in this region.

The novel seed weight QTL (qSW12.1) was delimited in a 1,348-kb interval between the BARCSOYSSR_12_1282 and BARCSOYSSR_12_1347 markers on chromosome 12. *marker positions are based on SoyBase (https://soybase.org/). The shaded area indicates the different chromosomal region between NILs564-C and NILs564-W.
Wild soybean has been found to have the potential to improve cultivated soybean in terms of seed quality, yield-related traits, and tolerance to biotic and abiotic stress (Concibido et al. 2003, Hu et al. 2013, Kim et al. 2011, Sebolt et al. 2000, Tuyen et al. 2010). In agreement with previous studies (Liu et al. 2007, Wang et al. 2016, Xin et al. 2016), we demonstrated that alleles from wild soybean contribute to a reduction in seed weight in all nine 100SW QTLs. Soybean breeders are not only interested in increasing seed size, but also require an optimized combination for each yield factor such as seed size, the number of seeds per pod, and the number of pods per plant. The QTLs detected in the current study would be useful to control seed size via genomic breeding by design and positional cloning of the relevant genes.
Here we detected three major and stable QTLs (qSW12.1, qSW17.1, and qSW14.1). These QTLs are good candidates for cloning the genes responsible for 100SW because a major QTL can be steadily detected in different environmental conditions. The QTL qSW12.1 was identified in three successive years accounting for 15.25%–23.25% of the total phenotypic variation of 100SW as a novel locus associated with this trait. This QTL might differ from a seed-weight QTL previously detected on chromosome 12 (Han et al. 2012), occurring at an interval between Satt181 (91.12 cM, genetic position based on SoyBase and so forth) and Satt302 (81.04 cM), and where the proximal marker is approximately 10 cM away from qSW12.1.
The qSW14.1 QTL was detected over three successive years accounting for 6.27%–11.17% of the total phenotypic variation of 100SW. Seed-weight QTL was previously detected in the same region by Hoeck et al. (2003) and Li et al. (2007), indicating consistency across different environmental conditions and genetic backgrounds.
Although the qSW17.1 QTL was detected over two years (2014 and 2015) as a major QTL with LOD scores of 8.99 and 7.16, respectively, it was not detected in 2016. As is shown in Table 1, the 120 CSSLs and the two parents demonstrated the lowest 100SW in 2016 among the three years. The special growth conditions in 2016 may have affected the effect of qSW17.1 on seed weight. Other researchers working on different populations have consistently detected QTLs for seed weight in this region (Kato et al. 2014, Liu et al. 2007, Wang et al. 2016, Xin et al. 2016). Recently, Lu et al. (2017) identified a protein phosphatase type-2C allele (PP2C-1) as the causative gene underlying a QTL that contributed a positive effect toward increasing seed weight. This QTL was in the same region of qSW17.1. However, the result in Lu et al. (2017) differs from our study in which the wild soybean contributed a negative effect, decreasing seed weight. It would be very interesting to determine whether these conflicting results are caused by the different genes or different alleles within the same locus of the wild soybean genome.
As for the remaining significant QTLs, six were detected in this study (qSW8.1, qSW9.1, qSW13.1, qSW16.1, qSW17.2, and qSW20.1). Of these, qSW20.1 might correspond to a region associated with seed weight reported by Han et al. (2012) and Liu et al. (2011). However, these six QTLs require further corroboration because they were detected in one year. Although some CSSLs demonstrated higher 100SW than that of the cultivated parent ‘Jackson’, no positive effect allele was detected from the wild soybean, suggesting the presence of undetected small effect QTLs or epistasis.
Although, on average, more than 90% of the genome was recovered by the recurrent parent in the BC3-derived CSSLs, there were several CSSLs with quite low 100SW. For example, CSSLs507 and CSSLs505 had an average of 11.06 ± 1.30 g and 12.74 ± 2.71 g for 100SW over the three years. Genotypic analysis revealed that the CSSLs507 line had the ‘JWS156-1’ genotypes at four 100SW QTLs (qSW8.1, qSW12.1, qSW13.1, and qSW17.1) and the CSSLs505 line had the ‘JWS156-1’ genotypes at three 100SW QTLs (qSW9.1, qSW12.1, and qSW17.1), both including the two major QTLs, qSW12.1 and qSW17.1 (Supplemental Fig. 1). Further genetic analysis for 100SW using a segregation population (BC4) derived from crosses between these CSSLs and ‘Jackson’ could help us to understand the relationships between the 100SW QTLs.
Analysis of the qSW12.1 near-isogenic lines, NILs564-C and NILs564-W, not only confirmed the effect of qSW12.1 but also delimited it in a 1,348-kb interval between the BARCSOYSSR_12_1282 and BARCSOYSSR_12_1347 markers on chromosome 12. There are 129 predicted genes in this region based on the soybean genome sequence of Glycine max Wm82.a2.v1 at Phytozome 12. However, it is still difficult to identify the candidate gene underlying qSW12.1 from the 129 predicted genes.
In the current study, we identified a novel major QTL, qSW12.1, within a 1,348-kb interval region on chromosome 12. This mapping is sufficiently accurate for DNA marker assisted selection in a breeding program. While the region is currently too large for positional cloning of the causal gene underlying the QTL, our ongoing fine-mapping work using a much larger segregation population will enable us to narrow down the qSW12.1 QTL into a smaller chromosome region for identifying the candidate gene causal to the seed-weight trait. Compared to genetic studies of seed weight in other plants, such studies are very limited in the soybean. Cloning genes controlling seed weight will not only contribute to a better understanding of the mechanism of seed development but also provide important implications for breeding strategies of soybean.
We thank Ms. K. Suzuki, Ms. M. Noda, and Ms. T. Kobayashi for their technical assistance. The work was supported in part by the scholarship from the China Scholarship Council to D. Q. Liu.