Abstract
Cryptomeria japonica is a major forestry tree species in Japan. Male sterility of the species is caused by a recessive gene, which shows dysfunction of pollen development and results in no dispersed pollen. Because the pollen of C. japonica induces pollinosis, breeding of pollen-free C. japonica is desired. In this study, single nucleotide polymorphism (SNP) markers located at 1.78 and 0.58 cM to a male sterility locus (MS1) were identified from an analysis of RNA-Seq and RAD-Seq, respectively. SNPs closely linked to MS1 were first scanned by a method similar to MutMap, where a type of index was calculated to measure the strength of the linkage between a marker sequence and MS1. Linkage analysis of selected SNP markers confirmed a higher efficiency of the current method to construct a partial map around MS1. Allele-specific PCR primer pair for the most closely linked SNP with MS1 was developed as a codominant marker, and visualization of the PCR products on an agarose gel enabled rapid screening of male sterile C. japonica. The allele-specific primers developed in this study would be useful for establishing the selection of male sterile C. japonica.
Introduction
Male sterility in sugi (Cryptomeria japonica) was first described by Taira et al. (Taira et al. 1993) in Toyama prefecture, Japan, and increased efforts to identify sterile trees led to the discovery of 23 male sterile sugi individuals from all over Japan (Saito 2010). These sterile trees have one of four sterile alleles of MS1, MS2, MS3, and MS4, which show Mendelian inheritance (Miyajima et al. 2010, Taira et al. 1999, Yoshii and Taira 2007). Because no mature pollen is produced and dispersed from sterile trees, they help decrease pollen allergy, which causes heavy social and economic losses every year in Japan. The breeding of male sterile trees would be accelerated if marker assisted selection (MAS) was possible. To assure the precision of selection, the distance between molecular markers and a candidate gene has to be close enough.
Long-lasting efforts to develop molecular markers in sugi have resulted in a high-density linkage map with 2,560 markers in 11 linkage groups and 1,266.2 cM in length (Moriguchi et al. 2016). The majority of these markers are based on randomly selected SNPs from expressed sequence tags (ESTs) or transcriptome contigs (Ueno et al. 2012) by RNA Sequencing (RNA-Seq). However, randomly designing molecular markers and searching for those linked with target genes are inefficient ways to identify male sterile individuals with MAS (Moriguchi et al. 2017). To overcome such drawback, MMAPPR (Hill et al. 2013) and a series of MutMap methods (Abe et al. 2012, Fekih et al. 2013, Takagi et al. 2013) have been developed using the association between a target phenotype and candidate SNPs over the genome before developing genetic markers.
In MutMap, SNP index is calculated as the “ratio between the number of reads of a mutant SNP and the total number of reads corresponding to the SNP” (Abe et al. 2012) in a bulked DNA sequencing of mutant and wild-type phenotypes. When we consider a simple Mendelian recessive trait in a backcross family, the SNP indices from mutant and wild-type individuals are expected to be approximately 1.0 and 0.5, respectively. The original MutMap method utilizes whole genome sequencing reads from bulked samples and needs a reference genome sequence of a target species. Although an increasing number of genome sequences have been published in recent years, construction of a reference genome sequence for sugi, a species with large genome (11 Gb) (Hizume et al. 2001), and repetitive elements, has been still difficult.
There are several methods of analysis to reduce the complexity of a genome. One of these includes the use of ESTs (Adams et al. 1992) or a transcriptome (Velculescu et al. 1997), whereby only expressed parts of a genome are sampled for downstream analysis. Another method to reduce the genome complexity is a construction of a reduced representation library from genomic DNA, such as AFLP (Vos et al. 1995) and RAD-Seq (Baird et al. 2008) techniques. In these systems, restriction enzymes are used to cut specific recognition sites with four to eight bases, resulting in a collection from a small portion of a genome. These methods of complexity reduction by sampling specific parts of a genome may help genetic analysis for species with a large genome and without a reference genome sequence.
In this study, we applied a method similar to MutMap to develop SNP markers that are closely linked to a male sterility gene using transcriptomic reference as well as genomic pseudo-reference constructed from RAD-Seq for sugi. Then, we screened and identified markers closely linked to one of the male sterile genes (MS1) in the genome, without any reference genome sequences available to date.
Materials and Methods
Plant materials and phenotyping of male sterility
The mapping pedigree (T5 family) consisted of 173 individuals and was derived from a backcross between ‘Toyama-1’ and ‘T1NK4F1’ trees (‘T1NK4F1’ is male fertile, Ms1/ms1) (Moriguchi et al. 2014). ‘T1NK4F1’ was an F1 hybrid between ‘Toyama-1’ (male sterile, ms1/ms1) and ‘Nakakubiki-4’ (male fertile, Ms1/Ms1). Male flowers were induced by gibberellic acid according to the manufacturer (KYOWA HAKKO BIO CO., LTD, Tokyo, Japan) instructions. Pollen production in each individual was visually assessed using a stereomicroscope in the following spring. Induction of male flowers and phenotyping of pollen production were conducted at Niigata Prefectural Forest Research Institute (Murakami, Niigata, Japan).
RNA-Seq from male flower buds
The T5 family at the age of three years was planted in a nursery at the Forestry and Forest Products Research Institute, Tsukuba, Japan, in April 2011. Male flowers were induced by applying gibberellic acid according to the manufacturer’s (KYOWA HAKKO BIO CO., LTD) instructions in July. On the 6th, 11th, 14th, 19th, and 24th of October 2011, male flower buds from sterile and fertile individuals were sampled. Due to the limited availability of male flower buds from each individual, we sampled two to three of them from each individual and mixed together with buds from other individuals. We mixed buds up to 50 individuals in each phenotype category (sterile and fertile). Male flower bud samples were stored at −80°C until RNA extraction. They were then powdered in liquid nitrogen with mortar and pestle, and total RNA was extracted by the method of Le Provost et al. (le Provost et al. 2007). About 10 spoonfuls of the powder were added to 1 mL of CTAB extraction buffer. The extracted RNA was further purified by SV total RNA purification system (Promega, Madison WI). For sequencing, an equal amount of RNA from each sampling date was mixed for each category (sterile and fertile), and the sequencing library was constructed by Hokkaido System Science Co., Ltd. (Sapporo, Japan) and then sequenced on a MiSeq (Illumina, San Diego, CA) in 2 × 250 bp paired ends at the National Agriculture and Food Research Organization, Tsukuba, Japan. Average depth was insufficient in a preliminary read mapping to full length cDNA (FLcDNA) sequences (Futamura et al. 2008) (Supplemental Text 1). Only 9,478 (42.0%) FLcDNA sequences had more than 20× average depth. Therefore, additional sequence was collected for each category (sterile and fertile) with HiSeq2000 (Illumina) in 2 × 101 bp paired-end sequencing by Hokkaido System Science Co., Ltd.
RAD-Seq
DNA was extracted from each individual of the T5 family according to a modified CTAB method (Doyle and Doyle 1987). A total 20 individuals (8 sterile and 12 fertile trees) and the parents (‘Toyama-1’ and ‘T1NK4F1’) were used in the double digest RAD-Seq (ddRAD) experiment (Peterson et al. 2012). Briefly, genomic DNA was double-digested by restriction enzymes, SphI and MluCI. The digested fragments were size-selected using BluePippin agarose gel (Sage Science, Beverly, MA) and ligated with adapters (Fluidigm, South San Francisco, CA). After PCR amplification with adapter-specific primer pairs, an equal amount of DNA from each sample was mixed to construct a RAD library. The quality of the library was checked by sequencing on MiSeq in 2 × 300 bp paired ends and finally sequenced in 2 × 101 bp paired ends on HiSeq2000 by Hokkaido System Science Co., Ltd.
Selection of candidate markers
RNA-Seq reads were cleaned with CLC Genomics Workbench (GW) (Qiagen, Hilden, Germany) 7.0.3 or Trim_Galore program (http://www.bioinformatics.babraham.ac.uk/projects/trim_galore/). The cleaned reads were mapped against 22,539 (36.0 Mb) full-length cDNA (FLcDNA) sequences (Futamura et al. 2008) (Supplemental Text 1) using GW 8.5.1 with more stringent parameters than those of default (length fraction = 0.85 and similarity fraction = 0.9). Read mappings were carried out for each sample and merged into a BAM alignment file for sterile and fertile samples. Candidate SNP sites were detected from the BAM files using VarScan (ver. 2.4.3) (Koboldt et al. 2012) with default parameter settings (min coverage = 8, min reads 2 = 2, min varfreq = 0.2, min avgqual = 15, and P value threshold = 0.01) to generate a VCF (variant call format) file. Read depths (number of reads) for both alleles (X and Y) at any SNP sites were extracted from the VCF file.
SNPs from RNA-Seq were also searched from contigs assembled de novo by Trinity (Grabherr et al. 2011) using the cleaned RNA-Seq reads. The contig sequences were used as references, onto which the reads were mapped, and the SNPs were detected as described above using the same parameter settings.
For RAD-Seq, reads from each individual were combined according to male flower phenotypes (sterile and fertile), which were then processed by dDocent (version 2.17) pipeline (Puritz et al. 2014). In the reference construction in dDocent, we set “CUTOFF” of four reads within a sample, and “CUTOFF2” of two which indicated that at least two samples (sterile and fertile samples in the present case) had that contig sequence. After mapping the reads onto the references, the resulting BAM files were then used to detect SNPs, and the read depth at each SNP site was extracted in the same manner as done for the abovementioned RNA-Seq data.
To select candidate markers linked to MS1, we applied a procedure similar to MutMap. The read depth for each allele at each SNP site was assumed to be proportional to the number of alleles in the genotype. Heterozygous (XY) and homozygous (XX) genotypes were expected to produce reads from X allele in ratios of 50% and 100%, respectively, to total reads mapped at each focal SNP site. The difference (D) in the X allele percentage between heterozygous (fertile) and homozygous (sterile) samples was calculated for each SNP site and averaged over all SNP sites on the same reference sequence (full length cDNA (FLcDNA), RNA-Seq, or RAD-Seq reference). The average value is referred to as Dav hereafter. Only the Dav was calculated for the reference with at least two SNP sites and with a maximum distance among all SNPs of ≥50 bp (Supplemental Fig. 1). The threshold distance among SNPs was determined arbitrarily as 50 bp in the current study. Because C. japonica is allogamous, we expected four possible cases for linkage phase of a two-alleles SNP site and MS1 and the resulting values of Dav in our backcross family (Fig. 1). Theoretically, a maximum of three alleles in a SNP site is possible in backcross family, but these cases are expected to be rare, and we focused on cases for two-alleles SNP sites here. The frequency for three-alleles SNP sites was estimated as 0.66% with four screening panel individuals in our previous re-sequencing study (Uchiyama et al. 2012). In the current procedure described above, we focused on cases where Dav ≈ 0.5 (Fig. 1B, 1D). Simple simulation, where a Mendelian marker is in complete linkage equilibrium with MS1, indicated that the average difference (D¯) was less than 0.1, when the number of backcross samples exceeded 20 (ms1/ms1:Ms1/ms1 = 10:10) (Supplemental Fig. 2, Supplemental Text 2). In the current study, about 50 male sterile and 50 male fertile samples were included in the RNA-Seq experiment, whereas the RAD-Seq had nine sterile and 13 fertile samples including their parents.

The SNPs on some of the reference sequences with higher Dav values were assessed by the EP1 system (Fluidigm) (Wang et al. 2009). We selected SNPs with higher Dav values sequentially, but if there were any adjacent SNPs within 30 bp of target SNP, it was not suitable for SNPType Assay Design (Fluidigm) and discarded. In total, 48, 33, and 48 SNP assays from FLcDNA, RNA-Seq, and RAD-Seq reference sequences were tested. We used T5 family (173 individuals) for linkage mapping. DNA was extracted for these individuals from the needle tissue using a modified CTAB method (Doyle and Doyle 1987) and used for SNPType assay by the Fluidigm EP1 system according to the manufacturer’s instructions. Fluidigm SNP Genotyping Analysis (version 4.1.2) was used for genotype calling under the default setting.
For linkage mapping, SNP genotypes were combined with 27 marker genotypes we had obtained in our previous study (Moriguchi et al. 2016). After removing loci with a large number of missing data points (more than 10 individuals) or extreme segregation distortion (P < 0.001), a partial linkage map for the ninth linkage group (LG9) where the male sterility gene (MS1) exists, was constructed by JoinMap v4.0 (Kyazma, Wageningen, The Netherlands) with the parameter BC (backcross) and two rounds of map calculation according to Moriguchi et al. (2016). Map distance was calculated by the Kosambi mapping function, and the linkage map for LG9 was drawn by MapChart ver. 2.0 (Voorrips 2002).
Allele-specific PCR and agarose gel electrophoresis
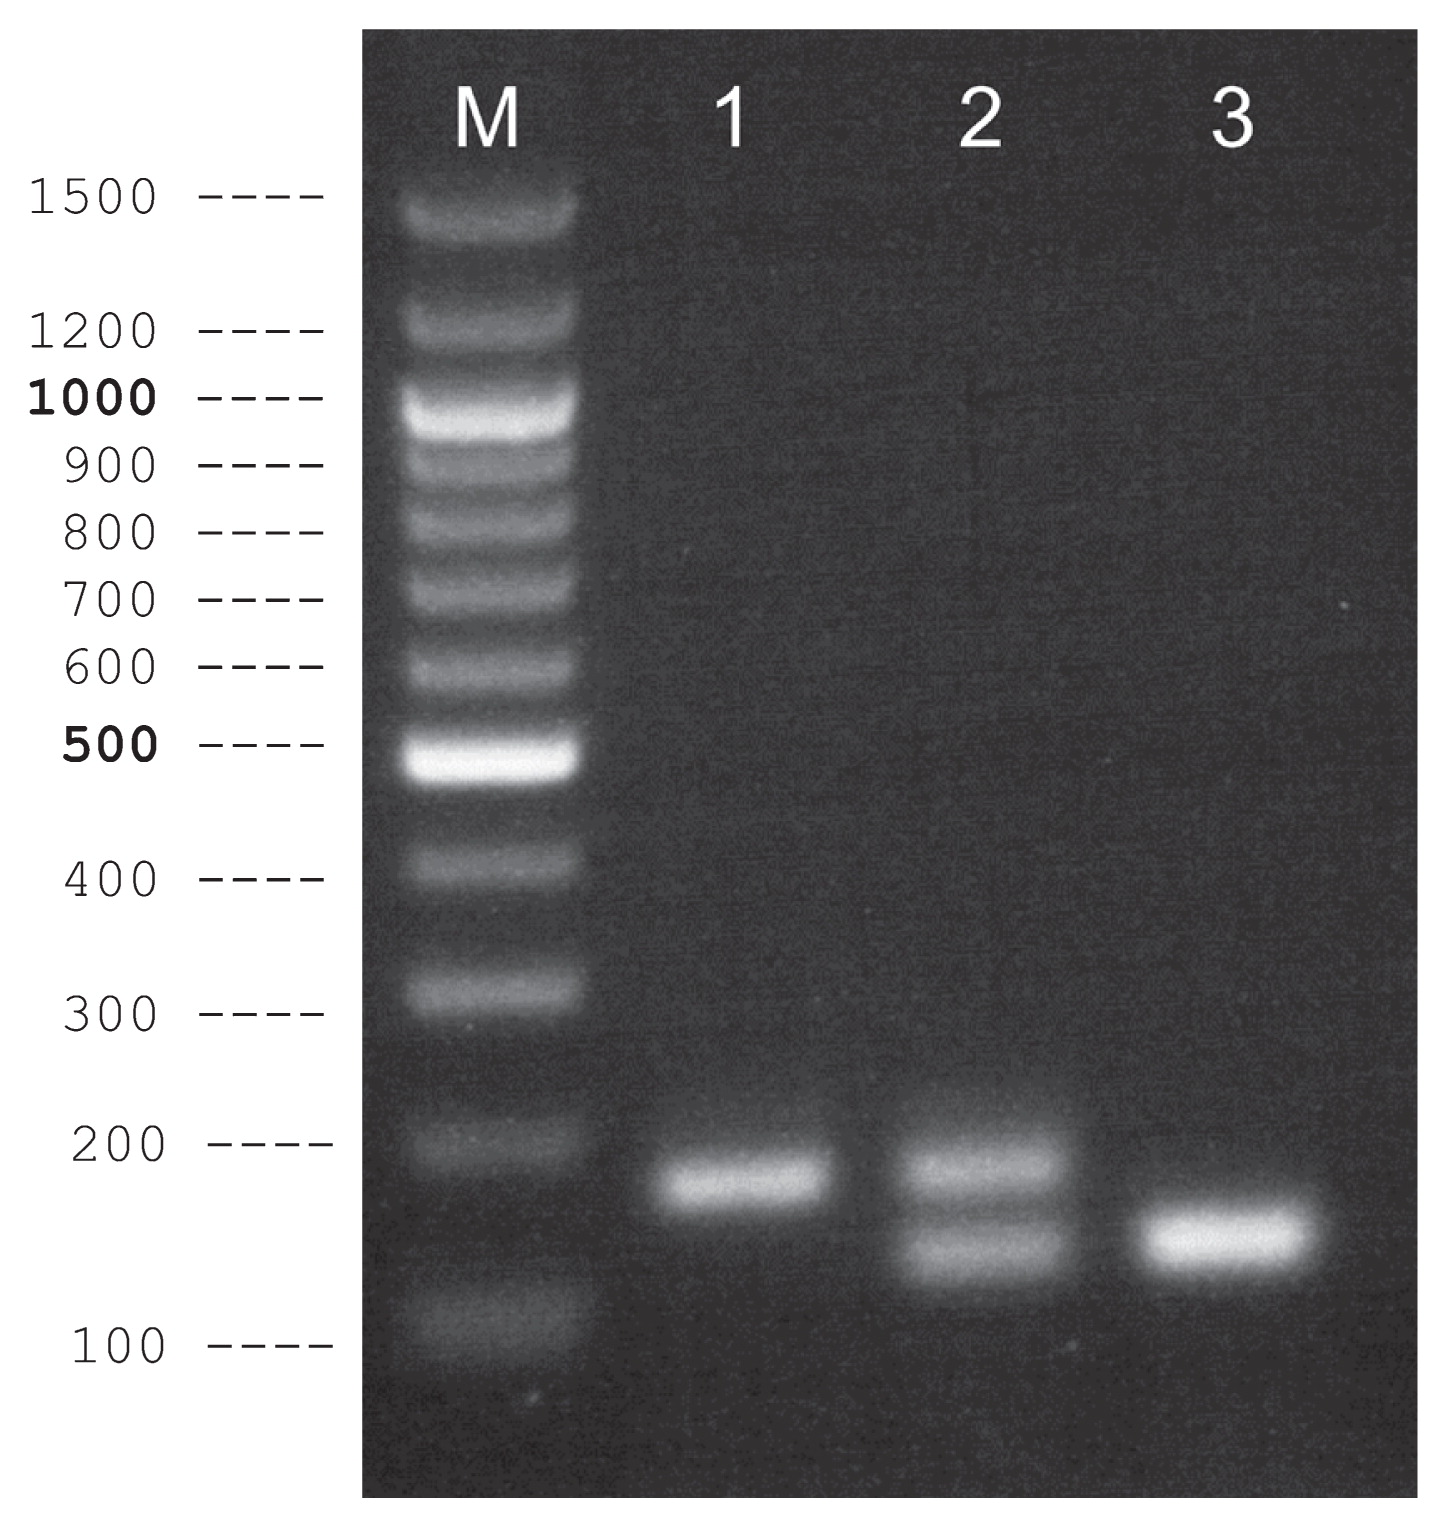
After identification of the most closely linked markers to MS1 on the partial linkage map, we constructed allele-specific PCR (ASP) system or Amplification Refractory Mutation System (ARMS) (Newton et al. 1989) for an easy identification of male sterile trees by agarose gel electrophoresis. The ASP primers were designed using Primer3Plus (Untergasser et al. 2007) based on the method described by Wangkumhang et al. (2007). Template sequence for primer design contained two SNPs, and we designed ASP primers for both of these (Fig. 2). Because two SNPs were located on 3′ and 5′ ends of the sequence, it was not possible to design ARMS primers (Newton et al. 1989), which target both alleles in a SNP with oppositely directed allele-specific primers. The reaction mixture, totaling 10 μL, contained 3 μL of 2 × Multiplex (Qiagen), 0.2 μM of each forward and reverse primers, and 1 μL (5–10 ng) of DNA, which was then amplified in a GeneAmp PCR System 9700 (Applied Biosystems, Foster City, CA) with the following thermal conditions: initial denaturation at 95°C for 15 min, 4 cycles of 95°C for 30 s, 64°C for 90 s with −1°C per cycle and 72°C for 30 s, and 34 cycles of 95°C for 30 s, 60°C for 90 s, and 72°C for 30 s. The PCR products were visualized by 2% agarose gel electrophoresis and ethidium bromide staining.

All the sequence data used in the present study were registered in DDBJ with the accession numbers mentioned in Supplemental Text 1.
Results
Scanning RNA-Seq
In total, 49.6 Gb of transcriptome reads were collected (5.0 Gb from MiSeq and 44.6 Gb from HiSeq). As a preliminary study, MiSeq collected 2.7 Gb from male sterile and 2.3 Gb from male fertile flower bud samples. Due to adapter or low-quality sequences, 40.1% of bases were removed. Initial mapping of these reads onto FLcDNA reference sequences showed that 67.0% of the reads were successfully mapped, with 32.3× average depth. Only 9,478 (42.0%) FLcDNA sequences had more than 20× average depth. We therefore collected additional reads using HiSeq2000, which produced 22.9 and 23.2 Gb sequencing reads from fertile and sterile samples, respectively. After the removal of 1.41 Gb (3.1%) of reads by Trim_Galore program, the remaining 22.1 and 22.5 Gb reads from sterile and fertile samples, respectively, were mapped against FLcDNA reference, resulting in 30.8 Gb (68.2%) of mapped bases with 507.6× average depth. In addition, 21,457 (95.2%) FLcDNA sequences reached more than 20× average depth. We identified 223,726 candidate variant (223,418 SNPs and 13,369 indels) sites in total, which indicated 9.9 variations per reference, and the ratio of transition- and transversion-type SNPs (Ts/Tv) was 1.49. A total 14,072 (62.4%) references had two or more SNPs, and the maximum distance among the SNPs was ≥50 bp, for which Dav was evaluated, ranging from 0.0 to 0.95 with an average of 0.112.
De novo assembly of the cleaned HiSeq reads produced 232,103 contigs with a total length of 177.5 Mbp, onto which cleaned reads from sterile and fertile samples (22.1 and 22.5 Gb, respectively) were separately mapped, resulting in 42.9 Gb (96.1%) of the mapped bases with a 126.7× average depth. In total, 46,303 (19.9%) RNA-Seq contigs had more than 20× average depth. We identified 517,225 candidate variant (517,140 SNPs and 85 indels) sites, indicating 2.2 variations per reference (i.e. 517,225 candidate variants per 232,103 contigs), and the ratio of transition- and transversion-type SNPs (Ts/Tv) was 1.59. A total of 40,573 (17.5%) references had two or more SNPs, and the maximum distance among the SNPs was ≥50 bp, for which Dav was evaluated, ranging from 0.0 to 0.95 with an average of 0.121.
Scanning RAD-Seq
We collected 2.3 and 2.8 Gb of sequences from sterile and fertile trees, respectively. The dDocent pipeline removed 712 Mb (13.8%) of adapter or low-quality bases, producing 16,455 reference contigs (3.3 Mb in length). Most of reference sequences were 212 bp in length with 10 “N”s in the middle, where forward and reverse reads were joined, but 992 of the references were merged contigs from forward and reverse reads. The pipeline then mapped 979.9 Mb (22.0%) of reads onto the reference. In total, 98,887 candidate SNP sites were detected from 9,183 (55.8%) contigs, resulting in an average number of 10.8 SNPs per reference, and the ratio of transition- and transversion-type SNPs (Ts/Tv) was 2.56. A total of 6,638 references had two or more SNPs, and the maximum distance among the SNPs was ≥50 bp, for which Dav was evaluated, ranging from 0.0 to 0.70 with an average of 0.113. The depth for these SNP sites ranged from 5 to 4,013 with 85.9× average depth.
SNP assay and linkage mapping
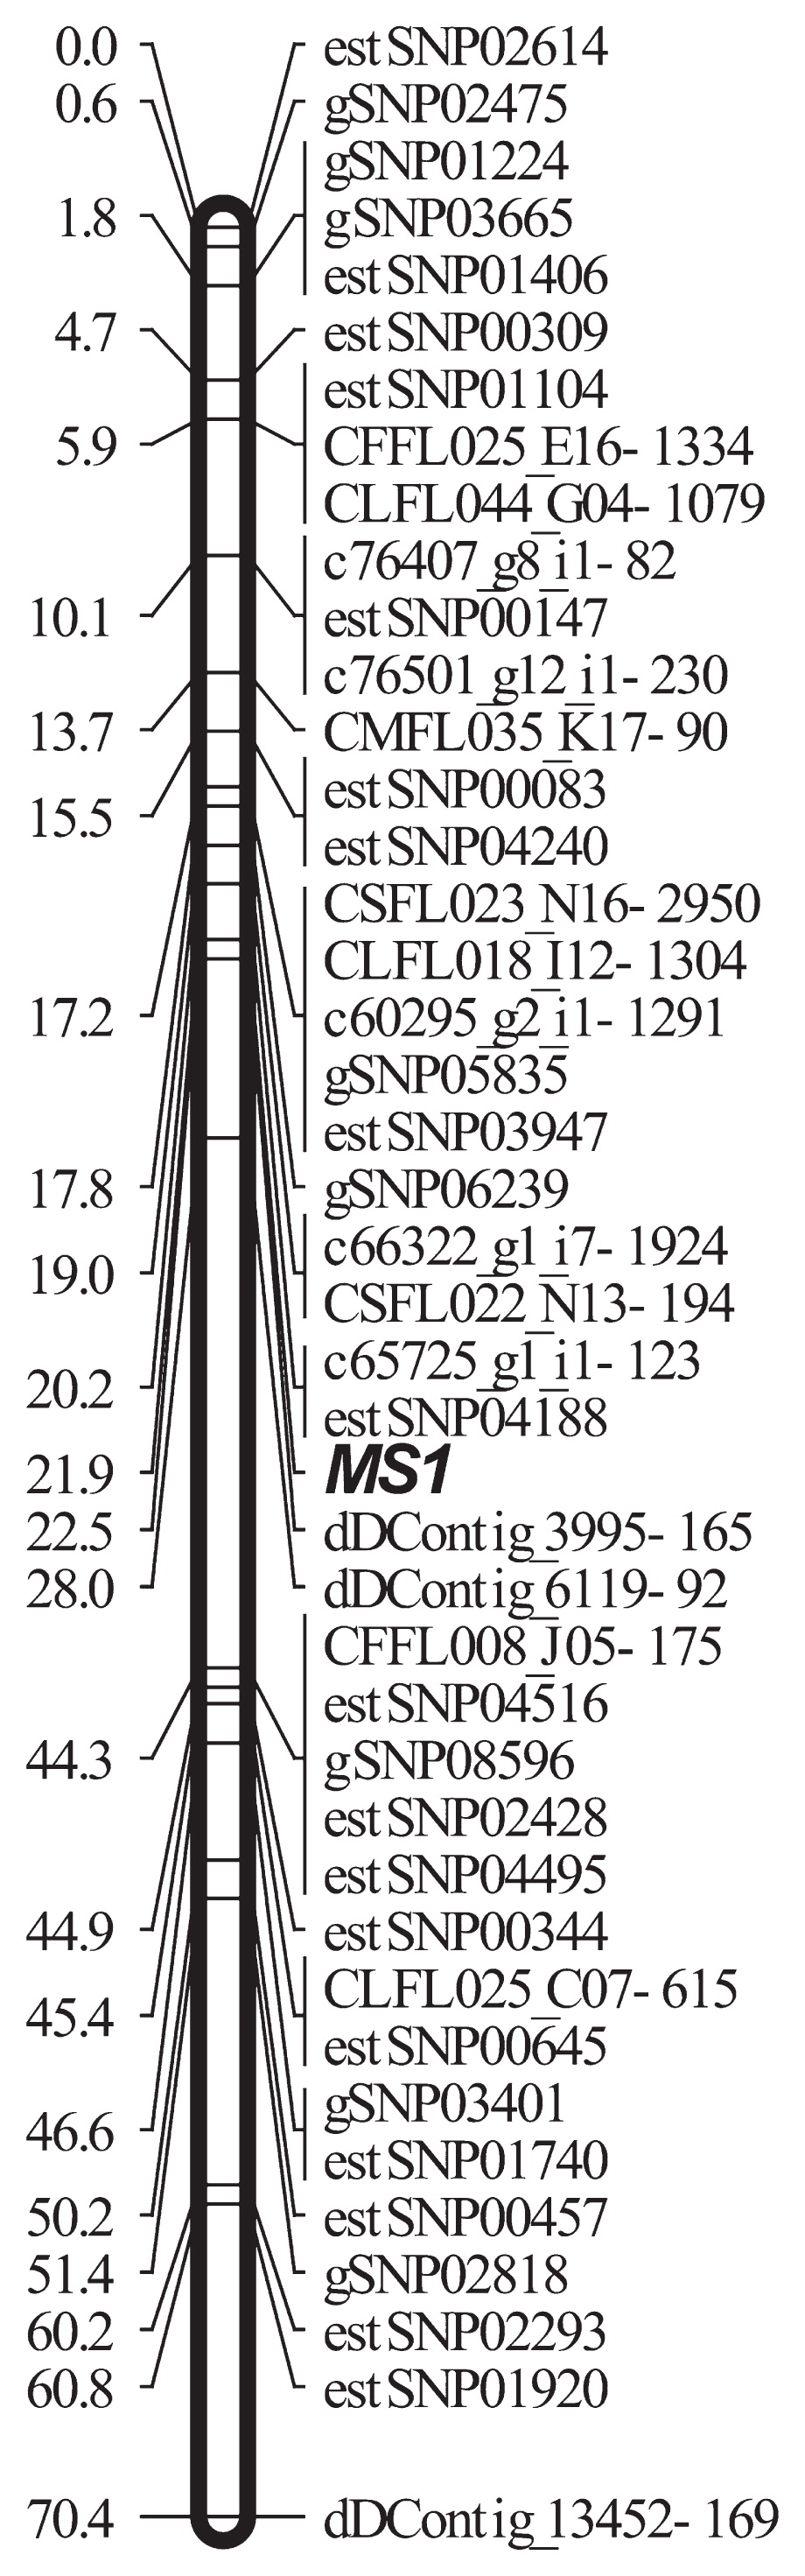
Three sets of SNPType assays (129 SNPs including 48, 33 and 48 SNPs from FLcDNA, RNA-Seq, and RAD-Seq references, respectively) were constructed based on Dav, whose ranges were 0.013–0.54, 0.37–0.50, and 0.30–0.56, respectively for FLcDNA, RNA-Seq and RAD-Seq references (data not shown). The assay was successful [number of missing genotypes ≤10, and no severe segregation distortion (P ≥ 0.001)] for 29 (60.4%) 24 (72.7%), and 22 (45.8%) SNPs originating from FLcDNA, RNA-Seq, and RAD-Seq, respectively. Linkage analysis using JoinMap included 26 backcross-type markers (eight, 13, and five from FLcDNA, RNA-Seq and RAD-Seq, respectively) and indicated that 16 markers were mapped onto LG9, where MS1 exists (Table 1, Fig. 3). The closest markers were CSFL022_N13-194, c65725_g1_i1-123, and dDContig_3995-165 from FLcDNA, RNA-Seq, and RAD-Seq, showing 2.95, 1.78, and 0.58 cM to MS1, respectively. The total LG9 map distance increased by 6.8 cM with the 16 markers added to the previous map (Moriguchi et al. 2016) (Supplemental Fig. 3).
Table 1
SNP markers on linkage group 9 (LG9) around male sterility locus (
MS1) in
C. japonica
| Marker origin |
Marker ID |
Dav |
Map position on LG9 (cM) |
Distance to MS1 (cM) |
| FLcDNA |
CLFL025_C07-615 |
0.346 |
45.44 |
23.52 |
|
CFFL008_J05-175 |
0.231 |
44.28 |
22.35 |
|
CFFL025_E16-1334 |
0.422 |
5.90 |
16.03 |
|
CLFL044_G04-1079 |
0.247 |
5.90 |
16.03 |
|
CMFL035_K17-90 |
0.334 |
13.71 |
8.22 |
|
CLFL018_I12-1304 |
0.515 |
17.24 |
4.69 |
|
CSFL023_N16-2950 |
0.412 |
17.24 |
4.69 |
|
CSFL022_N13-194 |
0.454 |
18.99 |
2.94 |
| RNA-Seq |
c76407_g8_i1-82 |
0.371 |
10.12 |
11.81 |
|
c76501_g12_i1-230 |
0.445 |
10.12 |
11.81 |
|
c60295_g2_i1-1291 |
0.480 |
17.24 |
4.69 |
|
c66322_g1_i7-1924 |
0.483 |
18.99 |
2.94 |
|
c65725_g1_i1-123 |
0.432 |
20.16 |
1.77 |
| RAD-Seq |
dDContig_13452-169 |
0.329 |
70.36 |
48.44 |
|
dDContig_6119-92 |
0.422 |
28.01 |
6.09 |
|
dDContig_3995-165 |
0.467 |
22.51 |
0.58 |
| Fertility |
MS1 |
NA |
21.93 |
0.00 |
#
Dav represents levels of linkage between marker and
MS1. The
Dav value of 0.5 is a theoretical prerequisite for complete linkage with
MS1.
Two pairs of allele-specific PCR primers (Table 2, Fig. 2) were designed targeting dD_Contig_3995, which was the most closely linked to MS1 based on the abovementioned mapping result. First, we used a single allele-specific primer pair in a single PCR reaction and confirmed allele-specific amplification from Ms1/Ms1, Ms1/ms1, and ms1/ms1 individuals (data not shown). Two pairs of allele-specific PCR primers were then combined, and multiplex PCR was performed, which enabled the detection of both male sterile- and wild-type alleles in a single PCR reaction (Fig. 4).
Table 2
Allele-specific PCR primers for dD_Contig_3995 discriminating male sterile and fertile trees on agarose gels (
Figs. 2,
4)
| Primer ID |
Primer sequence# |
Expected PCR product size (bp) |
Coupling allele |
| dD3995_47wild |
CTGCCTGCCAAAAATAGCACGG |
121 |
Ms1 |
| dD3995_47LSP137 |
GGCGGCTCATAATGTGGTAAAAA |
|
|
| dD3995_165ms |
TCAGGATTCCTTCTCGGTTTTCCG |
168 |
ms1 |
| dD3995_165LSP |
GATTTGCATGTCATACCATCACG |
|
|
# Underlined bases indicate artificial mismatch introduced to increase specificity.
Discussion
Detection and validation of candidate SNPs
SNP detection is a fundamental step to develop genetic markers. We detected 223,726, 517,140, and 98,887 candidate SNPs from the FLcDNA, RNA-Seq and RAD-Seq references, respectively. A total of 129 were selected for validation to perform a Fluidigm SNPType assay, which resulted in 75 (58.1%) successful markers. When the genotyping scatter plots for unsuccessful markers were inspected, some of the markers appeared to display a crushed or monomorphic pattern (Supplemental Fig. 4). Markers with a monomorphic pattern (seven, one and one candidate SNP from FLcDNA, RNA-Seq, and the RAD-Seq reference, respectively) indicates that we detected false SNP sites, which may have occurred due to a sequencing or data analysis error, null alleles (amplification failure in PCR due to SNPs at the primer binding site or third SNP allele), duplicated genomic sequences (paralogues), or RNA editing (Piskol et al. 2013). The higher monomorphic pattern rate in the candidate SNPs from the FLcDNA reference suggests that some of the reads were forced to be mapped onto paralogous sequences.
In the coding region of C. japonica, one exon SNP for every 106.7 bp was reported by re-sequencing four genotypes with the Sanger method (Uchiyama et al. 2012). The candidate SNP frequency from 35.96 Mbp of the FLcDNA reference in the current study based on 223,418 SNPs was roughly estimated as one candidate for every 161 bp. Although we detected 517,140 candidate SNPs from 177.5 Mb of RNA-Seq reference, most (80.1%) of them had less than 20× average depth, for which the SNP frequency calculation may be inappropriate. The ratio of transition- and transversion-type SNPs (Ts/Tv) can be considered an SNP quality metric because if all of the mutations occur at the same probability, we expect a Ts/Tv ratio ≈0.5, while the transversion type mutation rate is lower in general and Ts/Tv ratios of 2.15 and 3.27 has been reported in the final call set for human genome-wide and exome known SNPs, respectively (DePristo et al. 2011). Similar Ts/Tv ratio values (1.21–1.51) as the current study (1.49 and 1.59) have been reported in RNA-Seq data from coniferous species (Chen et al. 2012, Plomion et al. 2016, Ueno et al. 2018).
To gain further insights into the validity of the candidate SNPs, the RAD-Seq reads were mapped onto the FLcDNA references (hereinafter referred to as “RAD-FL mapping”). SNPs were detected by VarScan (ver. 2.4.3) (Koboldt et al. 2012) with default parameter settings, and the resulting VCF file was compared with that created from RNA-Seq reads’ mapping onto the same FLcDNA reference (hereinafter referred to as “RNA-FL mapping”). The comparison was made using “bcftools stats” and plot-vcfstats in bcftools ver. 1.7-1 (Li and Durbin 2009). In total, 2,014 candidate SNPs were common between RAD-FL and RNA-FL mapping. These candidates were distributed among 456 (2.0%) FLcDNA reference sequences. The Ts/Tv ratio for these common SNPs was 2.03. The mapping of RAD-Seq reads onto a genic reference helps validate the SNPs detected by RNA-Seq.
Scanning linked markers from pooled data
Male sterility in C. japonica has been investigated with an aim of identifying the responsible genes of the phenotype and for a better understanding of the molecular mechanisms of male sterility (Futamura et al. 2008, Moriguchi et al. 2012, 2016, Tsubomura et al. 2016). Analysis of EST (Expressed Sequence Tag) or RNA-Seq with high-throughput sequencers are both a method to capture the whole atlas of expressed genes (transcriptome) in a tissue (Weber 2015). Differentially expressed genes between male fertile and sterile strobili have been identified (Futamura et al. 2011, Tsubomura et al. 2016). Although the male sterility in C. japonica is caused by a single gene, none of the differentially expressed genes has directly dictated the phenotype and linkage analysis indicates that they are different from MS1 (Ihara et al. unpublished results). In the current study, we focused on the SNPs detected from high-throughput sequencing in the mapping family of MS1 and identified closely linked markers (Fig. 3).
Due to the backcross family we used, fertile and sterile genotypes are heterozygotes and homozygotes, respectively. If we had used other families such as selfed mapping family, homozygous fertile and sterile individuals would have been separated. Homozygous genotypes are easier to genotype, and larger values of expected score (Dav ≈1) would be preferable to differentiate both phenotypes. Unfortunately, in most of conifer tree species, which are allogamous, selfing leads to serious inbreeding depression, and construction of such mapping families is difficult. Heterozygote genotype calling is therefore required in allogamous species, which needs a higher (15×, for example) average depth (Song et al. 2016).
Because of the expensive sequencing costs to perform individual genotyping, especially for RNA-Seq, pooling strategy helped to reduce the cost, and selecting linked SNPs with appropriate Dav increased the efficiency of developing the markers. Of 21 analyzed SNPs from FLcDNA and RNA-Seq in the current study, 13 (62%) SNPs were mapped onto LG9 (Table 1). If we had randomly selected SNPs, a simple calculation would suggest 9.1% of markers on the chromosome, because C. japonica has 11 chromosomes. Considering the size of LG9 (96.9 cM or 7.7% of total map distance) (Moriguchi et al. 2016), the number of markers expected on LG9 may be <9.1%. Scanning RNA-Seq data increased the efficiency of partial linkage map construction by more than six times, compared with the method of developing markers randomly from the entire genome. Similarly, RAD-Seq data resulted in three (60%) linked markers of five analyzed SNPs. In the current study, we designed SNP assays with Dav ranges of 0.013–0.54, 0.37–0.50, and 0.30–0.56 for FLcDNA, RNA-Seq and RAD-Seq references, respectively, to design 129 Fluidigm SNPType assay primer pairs in total. If we had selected assays with Dav >0.4, for example, the efficiency to construct the partial linkage map would have been higher.
To gain some insight into Dav critical threshold values, the values were calculated for 771 (Moriguchi et al. 2012) and 2,160 (Moriguchi et al. 2016) expressed genic markers over 11 linkage groups, which were mapped in the YI mapping family (Supplemental Text 3). As expected, markers in LG9 where MS1 existed revealed higher Dav values, although MS1 was not mapped on the YI map and its exact location was unclear. If we defined the Dav critical threshold values as 1% of the upper tail of the Dav distribution, they were 0.343 and 0.312 for markers from Moriguchi et al. (2012) and Moriguchi et al. (2016), respectively, and the rate of false positives was <50%. These results agree well with the observed results (Table 1), where 7 (33.3%) of 21 assayable markers from the FLcDNA and RNA-Seq references were not mapped on LG9. Notably, the empirical estimates of the Dav distribution and the rate of false positives in Supplemental Text 3 were based on RNA-Seq reads. If we apply scanning RAD-Seq for the empirical estimates, these critical threshold values may change. The broader the Dav range considered, the larger the number of markers linked to MS1. However, in practice, the Dav threshold values are determined by the cost and time required for the specific assay method.
In the preliminary simulation (Supplemental Fig. 2), the difference (D) (for Fig. 1D) was calculated in cases where there was no linkage between a marker and MS1 in the backcross (BC1) pedigree, indicating that D approached zero as the number of BC1 offspring (N) increased, and that the average difference (D¯) was <0.1 when N > 20. Overall concordance was observed when the observed D values were compared with the simulated values. The observed/ simulated D¯ values were 0.1050/0.0456, 0.0995/0.0456, and 0.1035/0.0987 for SNPs from FLcDNA (N = 100), RNA-Seq (N = 100), and RAD-Seq (N = 20), respectively (Supplemental Fig. 5). The D¯ values for the observed values may be higher than those for the simulated values, because some of the linked markers were included in the real situation. The observed D values from RAD-Seq are closer to the simulated values, while those based on gene expression (FLcDNA and RNA-Seq) are not. This may have been caused by unequal contribution from each allele during gene expression and/or a contribution from paralogues.
In the present study, Dav values with at least two SNPs and a maximum distance among all SNPs ≥ 50 bp on a reference were considered (Supplemental Fig. 1), because we were afraid that Dav ≈0.5 may be obtained by chance even though there was no linkage between the markers and MS1. However, as the simple simulations (Supplemental Fig. 2) indicated that the D values (which could be considered as Dav for a reference sequence with a single SNP site) rerely exceeded 0.4 when at least 10 individuals were pooled from each category. If we considered all Dav values including Dav from a sequence with a single SNP site, the number of Dav, from the values of which linkage was evaluated, would have increased by 3,778 (23.6 %), 14,756 (36.4 %), 2,456 (37.0 %) for cases from FLcDNA, RNA-Seq, and RAD-Seq, respectively. To take advantage of many collected reads as possible and to avoid overlooking linked markers to target character (MS1), Dav for a reference sequence with a single SNP site should be considered (Supplemental Text 3).
The larger the Dav is, the closer the marker was to MS1 (Table 1). Regression of the distance (cM) to MS1 on the Dav value was significant (P = 0.0119, Supplemental Fig. 6). Markers in which Dav >0.475 had a high probability to link to MS1 within 5 cM. Mishima et al. (2018) reported the SNP marker (reCj19250_1927) for the putative causative MS1 gene, which showed homology to AT5G62190.1 (PRH75 DEAD box RNA helicase). The Dav value for reCj19250 (which corresponds to the RNA-Seq contig reference of c66093_g1_i1 in the current study) was 0.517. These data support the validity of the scanning method used in the present study. This method may be valid to search closely linked markers not only to qualitative trait loci, but also to quantitative trait loci with the largest effect.
Although pooling the sequence reads according to the phenotype to screen linked SNP candidates reduced the cost of sequencing in this study, the development of new sequencing technologies could lead to a continuous reduction in the sequencing cost in an unprecedented manner (Delseny et al. 2010) and make individual genotyping by sequencing (GBS) a routine task in breeding research. However, variation in the amount of sequencing reads for each individual causes uncertain genotypes for samples with low data volume, which is still problematic. Similarly, RNA-Seq data include expressional variation, and genes or alleles with low expression also cause biased data. In our preliminary analysis, we attempted to directly call the individual genotypes from RAD-Seq, estimated the error rate assuming Mendelian inheritance (Utsunomiya et al. 2013), and found an average Mendelian error (allelic drop in) rate of 6.9% (data not shown). Genotyping error inflates map distance and may lead to an incorrect marker order along chromosomes. Developing closely linked markers needs accurate linkage maps, and map construction from genotypes from GBS with a high error rate is probably inappropriate. Instead, scanning closely linked SNPs from pooled sequencing reads, at first, is robust against errors, and the SNP-specific markers developed achieve higher precision and scalability (from one sample to thousands of samples), enabling marker-assisted selection in the downstream applications.
Utility of the linked marker to MS1
The most closely linked marker developed in the present study (dD_Contig3995-165) was located 0.58 cM to the male sterility locus MS1 (Fig. 3). The results were obtained from the genotypes of the mapping family. One of the 173 pedigree members showed recombination between MS1 and the marker. This implies that discrimination of male sterile and fertile individuals based on the marker from 1,000 seedlings produced by backcross contains five to six individuals of false identification (1,000/173 ≈ 5.8). More information with addition of a second marker located on the opposite side of MS1 to dD_Contig3995-165 will increase the accuracy of phenotype prediction. Selection of male sterile individuals at the embryo stage is required for mass production of male sterile trees by tissue culture from immature zygotic embryos, where marker-assisted selection (MAS) is a prerequisite. The marker developed in this study (Table 2) is useful in such a project, which is now in progress. The discovery of two closely linked markers that cross the target gene (MS1) increases the precision of MAS, while the method developed in this study will be useful for identifying other male sterile genes and their closely linked markers.
Acknowledgments
The authors would like to thank Misako Koshiba, Yasuyuki Komatsu, Nozomi Ohmiya, and Yuriko Taguchi for their assistance with laboratory work and the sampling of male flower buds in the nursery. Authors also thank two anonymous reviewers and the managing editor to improve earlier draft of the manuscript. The mapping family used in the current study was produced by Shinji Itoo. Arboretum and Nursery Office, FFPRI was involved in the maintenance of C. japonica nursery. This work was partly supported by a Grant-in-Aid from the Program for Promotion of Basic and Applied Researches for Innovations in Bio-oriented Industry, JSPS KAKENHI (Grant Numbers 25850116 and 25450223), Research grants #201119, #201421, and #201414 from the Forestry and Forest Products Research Institute, genome-support grant from the National Institute of Agrobiological Sciences (NIAS), and grants from the Project of the NARO Bio-oriented Technology Research Advancement Institution (Research program on development of innovative technology).
Literature Cited
- Abe, A., S. Kosugi, K. Yoshida, S. Natsume, H. Takagi, H. Kanzaki, H. Matsumura, C. Mitsuoka, M. Tamiru, H. Innan et al. (2012) Genome sequencing reveals agronomically important loci in rice using MutMap. Nat. Biotechnol. 30: 174–178.
- Adams, M.D., M. Dubnick, A.R. Kerlavage, R. Moreno, J.M. Kelley, T.R. Utterback, J.W. Nagle, C. Fields and J.C. Venter (1992) Sequence identification of 2,375 human brain genes. Nature 355: 632–634.
- Baird, N.A., P.D. Etter, T.S. Atwood, M.C. Currey, A.L. Shiver, Z.A. Lewis, E.U. Selker, W.A. Cresko and E.A. Johnson (2008) Rapid SNP discovery and genetic mapping using sequenced RAD markers. PLoS ONE 3: e3376.
- Chen, J., S. Uebbing, N. Gyllenstrand, U. Lagercrantz, M. Lascoux and T. Kallman (2012) Sequencing of the needle transcriptome from Norway spruce (Picea abies Karst L.) reveals lower substitution rates, but similar selective constraints in gymnosperms and angiosperms. BMC Genomics 13: 589.
- Delseny, M., B. Han and Y. Hsing (2010) High throughput DNA sequencing: The new sequencing revolution. Plant Sci. 179: 407–422.
- DePristo, M.A., E. Banks, R. Poplin, K.V. Garimella, J.R. Maguire, C. Hartl, A.A. Philippakis, G. del Angel, M.A. Rivas, M. Hanna et al. (2011) A framework for variation discovery and genotyping using next-generation DNA sequencing data. Nat. Genet. 43: 491–498.
- Doyle, J.J. and J.L. Doyle (1987) A rapid DNA isolation procedure for small quantities of fresh leaf tissue. Phytochem. Bull. 19: 11–15.
- Fekih, R., H. Takagi, M. Tamiru, A. Abe, S. Natsume, H. Yaegashi, S. Sharma, H. Kanzaki, H. Matsumura, H. Saitoh et al. (2013) MutMap+: genetic mapping and mutant identification without crossing in rice. PLoS ONE 8: e68529.
- Futamura, N., Y. Totoki, A. Toyoda, T. Igasaki, T. Nanjo, M. Seki, Y. Sakaki, A. Mari, K. Shinozaki and K. Shinohara (2008) Characterization of expressed sequence tags from a full-length enriched cDNA library of Cryptomeria japonica male strobili. BMC Genomics 9: 383.
- Futamura, N., M. Saito, Y. Higuchi, K. Watanabe and K. Shinohara (2011) Screening of genes involved in pollen development of Cryptomeria japonica using microarray analyses for comparison of sterile and fertile male strobili derived from pedigrees of four male-sterile mutants. Jpn. For. Soc. Congr. 123: Pb198–Pb198.
- Grabherr, M.G., B.J. Haas, M. Yassour, J.Z. Levin, D.A. Thompson, I. Amit, X. Adiconis, L. Fan, R. Raychowdhury, Q. Zeng et al. (2011) Trinity: reconstructing a full-length transcriptome without a genome from RNA-Seq data. Nat. Biotechnol. 29: 644–652.
- Hill, J.T., B.L. Demarest, B.W. Bisgrove, B. Gorsi, Y.C. Su and H.J. Yost (2013) MMAPPR: mutation mapping analysis pipeline for pooled RNA-seq. Genome Res. 23: 687–697.
- Hizume, M., T. Kondo, F. Shibata and R. Ishizuka (2001) Flow cytometric determination of genome size in the Taxodiaceae, Cupressaceae sensu stricto and Sciadopityaceae. Cytologia 66: 307–311.
- Koboldt, D.C., Q. Zhang, D.E. Larson, D. Shen, M.D. McLellan, L. Lin, C.A. Miller, E.R. Mardis, L. Ding and R.K. Wilson (2012) VarScan 2: somatic mutation and copy number alteration discovery in cancer by exome sequencing. Genome Res. 22: 568–576.
- le Provost, G., R. Herrera, J.A. Paiva, P. Chaumeil, F. Salin and C. Plomion (2007) A micromethod for high throughput RNA extraction in forest trees. Biol. Res. 40: 291–297.
- Li, H. and R. Durbin (2009) Fast and accurate short read alignment with Burrows-Wheeler transform. Bioinformatics 25: 1754–1760.
- Mishima, K., T. Hirao, M. Tsubomura, M. Tamura, M. Kurita, M. Nose, S. Hanaoka, M. Takahashi and A. Watanabe (2018) Identification of novel putative causative genes and genetic marker for male sterility in Japanese cedar (Cryptomeria japonica D.Don). BMC Genomics 19: 277.
- Miyajima, D., E. Yoshii, Y. Hosoo and H. Taira (2010) Cytological and genetic studies on male sterility in Cryptomeria japonica D. Don (Shindai 8). J. Jpn. For. Soc. 92: 106–109.
- Moriguchi, Y., T. Ujino-Ihara, K. Uchiyama, N. Futamura, M. Saito, S. Ueno, A. Matsumoto, N. Tani, H. Taira, K. Shinohara et al. (2012) The construction of a high-density linkage map for identifying SNP markers that are tightly linked to a nuclear-recessive major gene for male sterility in Cryptomeria japonica D. Don. BMC Genomics 13: 95.
- Moriguchi, Y., K. Uchiyama, S. Ueno, T. Ujino-Ihara, A. Matsumoto, J. Iwai, D. Miyajima, M. Saito, M. Sato and Y. Tsumura (2016) A high-density linkage map with 2560 markers and its application for the localization of the male-sterile genes ms3 and ms4 in Cryptomeria japonica D. Don. Tree Genet. Genomes 12: 57.
- Moriguchi, Y., S. Totsuka, J. Iwai, A. Matsumoto, S. Ueno and Y. Tsumura (2017) Pyramiding of male-sterile genes in Cryptomeria japonica D. Don with the aid of closely linked markers. Tree Genet. Genomes 13: 61.
- Newton, C.R., A. Graham, L.E. Heptinstall, S.J. Powell, C. Summers, N. Kalsheker, J.C. Smith and A.F. Markham (1989) Analysis of any point mutation in DNA. The amplification refractory mutation system (ARMS). Nucleic Acids Res. 17: 2503–2516.
- Peterson, B.K., J.N. Weber, E.H. Kay, H.S. Fisher and H.E. Hoekstra (2012) Double digest RADseq: an inexpensive method for de novo SNP discovery and genotyping in model and non-model species. PLoS ONE 7: e37135.
- Piskol, R., G. Ramaswami and J.B. Li (2013) Reliable identification of genomic variants from RNA-seq data. Am. J. Hum. Genet. 93: 641–651.
- Plomion, C., J. Bartholome, I. Lesur, C. Boury, I. Rodriguez-Quilon, H. Lagraulet, F. Ehrenmann, L. Bouffier, J.M. Gion, D. Grivet et al. (2016) High-density SNP assay development for genetic analysis in maritime pine (Pinus pinaster). Mol. Ecol. Resour. 16: 574–587.
- Puritz, J.B., C.M. Hollenbeck and J.R. Gold (2014) dDocent: a RADseq, variant-calling pipeline designed for population genomics of non-model organisms. PeerJ 2: e431.
- Saito, M. (2010) Breeding strategy for the pollinosis preventive cultivars of Cryptomeria japonica D. Don. J. Jpn. For. Soc. 92: 316–323.
- Song, K., L. Li and G. Zhang (2016) Coverage recommendation for genotyping analysis of highly heterologous species using next-generation sequencing technology. Sci. Rep. 6: 35736.
- Taira, H., H. Teranishi and Y. Kenda (1993) A case study of male sterility in sugi (Cryptomeria japonica). J. Jpn. For. Soc. 75: 377–379.
- Taira, H., M. Saito and Y. Furuta (1999) Inheritance of the trait of male sterility in Cryptomeria japonica. J. For. Res. 4: 271–273.
- Takagi, H., A. Uemura, H. Yaegashi, M. Tamiru, A. Abe, C. Mitsuoka, H. Utsushi, S. Natsume, H. Kanzaki, H. Matsumura et al. (2013) MutMap-Gap: whole-genome resequencing of mutant F2 progeny bulk combined with de novo assembly of gap regions identifies the rice blast resistance gene Pii. New Phytol. 200: 276–283.
- Tsubomura, M., M. Kurita and A. Watanabe (2016) Determination of male strobilus developmental stages by cytological and gene expression analyses in Japanese cedar (Cryptomeria japonica). Tree Physiol. 36: 653–666.
- Uchiyama, K., T. Ujino-Ihara, S. Ueno, Y. Taguchi, N. Futamura, K. Shinohara and Y. Tsumura (2012) Single nucleotide polymorphisms in Cryptomeria japonica: their discovery and validation for genome mapping and diversity studies. Tree Genet. Genomes 8: 1213–1222.
- Ueno, S., Y. Moriguchi, K. Uchiyama, T. Ujino-Ihara, N. Futamura, T. Sakurai, K. Shinohara and Y. Tsumura (2012) A second generation framework for the analysis of microsatellites in expressed sequence tags and the development of EST-SSR markers for a conifer, Cryptomeria japonica. BMC Genomics 13: 136.
- Ueno, S., Y. Nakamura, M. Kobayashi, S. Terashima, W. Ishizuka, K. Uchiyama, Y. Tsumura, K. Yano and S. Goto (2018) TodoFirGene: Developing transcriptome resources for genetic analysis of Abies sachalinensis. Plant Cell Physiol. 59: 1276–1284.
- Untergasser, A., H. Nijveen, X. Rao, T. Bisseling, R. Geurts and J.A. Leunissen (2007) Primer3Plus, an enhanced web interface to Primer3. Nucleic Acids Res. 35: W71–74.
- Utsunomiya, Y.T., R.V. Alonso, A.S. Carmo, F. Campagnari, J.A. Vinsintin and J.F. Garcia (2013) mendelFix: a Perl script for checking Mendelian errors in high density SNP data of trio designs. ArXiv: 1306.2243.
- Velculescu, V.E., L. Zhang, W. Zhou, J. Vogelstein, M.A. Basrai, D.E. Bassett, Jr., P. Hieter, B. Vogelstein and K.W. Kinzler (1997) Characterization of the yeast transcriptome. Cell 88: 243–251.
- Voorrips, R.E. (2002) MapChart: software for the graphical presentation of linkage maps and QTLs. J. Hered. 93: 77–78.
- Vos, P., R. Hogers, M. Bleeker, M. Reijans, T. van de Lee, M. Hornes, A. Frijters, J. Pot, J. Peleman, M. Kuiper et al. (1995) AFLP: a new technique for DNA fingerprinting. Nucleic Acids Res. 23: 4407–4414.
- Wang, J., M. Lin, A. Crenshaw, A. Hutchinson, B. Hicks, M. Yeager, S. Berndt, W.Y. Huang, R.B. Hayes, S.J. Chanock et al. (2009) High-throughput single nucleotide polymorphism genotyping using nanofluidic Dynamic Arrays. BMC Genomics 10: 561.
- Weber, A.P.M. (2015) Discovering new biology through sequencing of RNA. Plant Physiol. 169: 1524–1531.
- Yoshii, E. and H. Taira (2007) Cytological and genetical studies on male sterile Sugi (Cryptomeria japonica D. Don), Shindai 1 and Shindai 5. J. Jpn. For. Soc. 89: 26–30.