Research Papers
Genetic diversity and structure of landrace of lablab (Lablab purpureus (L.) Sweet) cultivars in Thailand revealed by SSR markers
2021 年 71 巻 2 号 p. 176-183

詳細
2021 年 71 巻 2 号 p. 176-183
Lablab (Lablab purpureus (L.) Sweet) is a legume crop widely cultivated in tropical and subtropical regions of Africa and Asia. In this study, we assessed genetic diversity and population structure of 299 individuals of subspecies purpureus and bengalensis of lablab from Thailand using 13 simple sequence repeat (SSR) markers. The SSR markers detected only 34 alleles in total with a mean of 2.6 alleles per locus. Overall gene diversity was 0.360. Gene diversity (HE) and allelic richness (AR) in different geographic regions was comparable. Similarly, both HE and AR between subspecies purpureus and bengalensis were similar. STRUCTURE and neighbor-joining (NJ) analyses revealed that the 299 individuals were clustered into two major groups. In contrast, principal coordinate analysis (PCoA) revealed admixture of the lablab germplasm. STRUCTURE, NJ and PCoA analyses also revealed that the subspecies purpureus and bengalensis are not genetically differentiated. Although the number of individuals from the west of Thailand was small and all of them were collected from the same province, they possessed comparable gene diversity with those from the other geographic regions. These results demonstrated that there is moderately low genetic diversity of lablab in Thailand and the west of the country possesses high diversity of lablab.
Lablab (also known as hyacinth bean; Lablab purpureus (L.) Sweet) is an ancient and important tropical legume crop of the world. It is a bushy, trailing or twining herbaceous with annual, biennial or perennial plant. This legume crop is grown in substantial area of the tropical and sub-tropical regions mainly in Asia and Africa by small-farm holders for young seeds and pods, albeit it is cultivated in nearly all the continents (Maass et al. 2010). It is also grown as a forage crop, a green manure crop and an ornamental crop for its beautiful flowers. The mature and young seeds are consumed as a source of proteins and carbohydrates, while young pods and leaves are consumed as vegetable for vitamins and minerals. Dry seeds of lablab contains about 24% of proteins and 62% of carbohydrates (Hossain et al. 2016). The seeds are also rich in the essential amino acids, such as lysine (Deka and Sarkar 1990) and leucine (Kala et al. 2010), but are low in lipids, being only 1.2% (El Hardallo et al. 1980). However, the lipid contains essential fatty acids, including linoleic acid (omega-6) and alpha-linolenic acid (omega-3) (Kala et al. 2010). Moreover, the seeds contains micronutrients and minerals (Kala et al. 2010, Shaahu et al. 2015). Therefore, lablab seeds are good source of quality food components. In addition, leaves of lablab contains about 15 to 40% of proteins, depending on stages of maturity (Murphy and Colucci 1999) which can be a good source of quality forages.
In Africa, South Asia, Southeast Asia and China, lablab is popularly grown as a component in backyard vegetable garden. In South Asia, the crop is also cultivated as a field crop. Lablab is considered as a drought tolerance legume crop (Maass et al. 2010). Although it is an annual crop, in many cases this crop shows perennial behaviors and survive through drought condition or other hardy environments by developing deep tap root and tuber-like root which can regrow when suitable environment arrives (P. Somta, personal observations). Lablab roots are able to grow down under the soil more than 2 m depth (Cook et al. 2005). Most of the lablab cultivars grown in the world are landraces or pure lines selected from landraces, except in India, Bangladesh, China, Australia, USA and some European countries where improved cultivars are developed by hybridization and selection (Maass et al. 2010, Mihailović et al. 2016, Xin Chen, Jiangsu Academy of Agricultural Sciences, China, pers. comm. 2020). Breeding programs in India and Bangladesh focus on cultivars for dry seeds and young pods, while those in China focus on cultivars for young pods and those in Australian and USA focus on cultivars for forage uses.
Three subspecies of lablab have been described, including uncinatus, purpureus and bengalensis (Verdcourt 1970). The latter two are cultivated forms, while the former has two forms, wild and cultivated. The wild form of the subspecies uncinatus is believed to be the progenitor of all the cultivated forms (Maass et al. 2005). These three subspecies are phenotypically similar with the main difference in pod shape and size. Pods of both subspecies uncinatus and purpureus are crescent-like to more or less straight and oblong, or also dorsally straight and ventrally deeply curving while suddenly near the top returning towards the slender beak, laterally compressed, and bulging over the seeds (Westphal 1974). The subspecies uncinatus has pods of about 4 cm in length and 1.5 cm in width, while the ssp. purpureus has larger pods than the spp. uncinatus, up to 10 cm in length and about 4 cm in width (Verdcourt 1970). In contrast, the subspecies bengalensis has longer pods than the ssp. purpureus, narrowly oblong or linear-oblong, up to 14 cm in length and about 1–2.5 cm in width (Verdcourt 1970). Results from molecular diversity analysis suggest that lablab is possibly domesticated in East Africa where the wild lablab existed (Robotham and Chapman 2017). A later study with an in-depth analysis by reinterpreting previous results from other studies and integrating phenotypic data suggested that the crop may experience two domestication events; one of which is probably in Ethiopia (Maass et al. 2017). From Africa, the crop has been disseminated to Asia and other parts of the world (Maass 2016, Robotham and Chapman 2017). Apart from the Africa, lablab is so widely distributed in tropical and subtropical regions of Asia, especially the Indian subcontinent and Southeast Asia. However, previous studies of lablab genetic diversity included no or very small number of germplasm from Southeast Asia (Liu 1996, Maass and Usongo 2007, Maass et al. 2005, Pengelly and Maass 2001, Robotham and Chapman 2017, Sultana et al. 2000, Wang et al. 2007). In addition, these study used small number of lablab germplasm (<120 accessions/samples). Thus, levels and patterns of lablab diversity in Southeast Asia is not known. In Southeast Asia, the lablab is grown principally for young pods and young seeds.
Thailand lies in the center of Southeast Asia. In Thailand, lablab is known in several names, including “Mak Paeb”, “Ma Paeb”, “Thua Paeb”, “Pae Jee”, “Pae Yee”, “Thua Lhuang”, and “Thua Nhang” in which its young pods and young seeds are used to prepare a variety of dishes. Young pods are also boiled and then the seeds are eaten as snack in the same way as of consuming edamame (vegetable soybean). It is the most common legume crop grown and sold in the markets in the north and northeast of the country, although it is found in nearly all the regions of Thailand. Based on our surveys and collections in rural areas of Thailand in 2017 and 2018, we found that lablab is grown as a homegarden crop in nearly all the villages of the north and the northeast due to its rapid and vigorous growth and drought tolerance, while it is also grown as a field crop for young and mature seeds and young pods in some parts of the west and the north of Thailand. The young seeds are fried and sold as snack in a high price (25–30 US$ per kg). So, lablab constitutes food security and provides economic opportunity for people in Thailand. Nearly all of the lablab cultivars grown in Thailand are landraces. Some commercial cultivars are available, but all of them are selected from the landrace cultivars.
Although lablab is an important legume crop contributing to food security in Thailand, there is a very limited interest, research and development in this crop in the country. In this paper, we report genetic diversity analysis in a large collection of 299 lablab individuals collected in Thailand using simple sequence repeat (SSR) markers. The aim of this study is to determine level and pattern of diversity of lablab in Thailand for conservation and uses in genetic improvement. In addition, the results from this study can shed some light on diversity of lablab in Southeast Asia.
Young leaves of 299 individuals of lablab were collected from the north (145 individuals), northeast (113 individuals), west (11 individuals) and central (30 individuals) of Thailand in 2017 (Fig. 1, Supplemental Table 1). Each individual was collected from one farmer. The collected leaves were kept in icebox for 1 to 7 days, and then maintained in a –80°C freezer until DNA extraction. During the leaves collection, flower color, pod type, and young pod color were recorded. Two hundred and ninety-two individuals were recorded for flower color; 139 had white flower and 153 had purple flower (Supplemental Table 1). Two hundred and nine individuals were recorded for young pod color; 160 showed green pod, 12 showed purple pod, and 37 showed green pod with purple suture. Two hundred and sixty individuals were recorded for pod types (Supplemental Table 1). Based on the pod types, 176 and 84 individuals were classified as the subspecies purpureus and bengalensis, respectively (Supplemental Fig. 1, Supplemental Table 1).

Geographical distribution of the 299 individuals of Lablab purpureus from Thailand used in this study.
Total genomic DNA of each individual was extracted from the young leaves using a CTAB method (Lodhi et al. 1994). The DNA quality and quantity were assessed on 0.8% agarose gel electrophoresis by comparing with lambda DNA. The DNA was adjudged to 1 ng/ul for SSR marker analysis.
SSR marker analysisInitially, 145 SSR markers from four legume species including lablab (Chapman 2015, Robotham and Chapman 2017, Zhang et al. 2013), azuki bean (Vigna angularis (Willd.) Ohwi and Ohashi) (Chankaew et al. 2014, Wang et al. 2004), mungbean (Vigna radiata (L.) Wilczek) (Seehalak et al. 2009, Somta et al. 2008, 2009, Tangphatsornruang et al. 2009), cowpea (Vigna unguiculata (L.) Walp.) (Kongjaimun et al. 2012, Li et al. 2001, Xu et al. 2011), and common bean (Phaseolus vulgaris L.) (Gaitán-Solís et al. 2002) (Supplemental Table 2) were screened for polymorphism in six lablab individuals originating from different provenances. Sixty-eight of the markers from lablab were genic SSRs, while the rest were genomic SSRs (Supplemental Table 2). Polymerase chain reaction (PCR) mixture was prepared following Somta et al. (2009) with modifications. Briefly, the PCR mixture of 10 μl contained 2 ng genomic DNA, 5 pmol of each forward and reverse primers, 1 × Taq buffer, 2 mM dNTPs, 1.5 mM MgCl2, and 1 U Taq DNA polymerase (Thermo Scientific). The PCR was carried out in SimpliAmp Thermal Cycler (Applied Biosystems, California, USA). The thermal cycling profile was 94°C for 2 min, followed by 35 cycles of 94°C for 30 s, 55°C for 30 s, 72°C for 1 min and the final extension at 72°C for 10 min. The PCR products were electrophoresed on 5% denaturing polyacrylamide gel (w/v; 19:1 acrylamide-bisacrylamide) at 70 W constant power for 1.5–2.0 h (depending on allele size). pBR322 DNA/BsuRI (HaeIII) (Thermo Scientific) was used as the size standard for determining size of SSR alleles. The products were then visualized by silver staining. Subsequently, 13 markers showing polymorphism in the six lablab germplasm were further used to analyze DNA of all the 299 accessions.
Molecular data analysisNumber of alleles (NA), observed heterozygosity (HO), gene diversity (expected heterozygosity; HE), Wright’s fix index (FIS) and allelic richness (AR) were calculated from SSR allele data using FSTAT (Goudet 1995). FIS was then used to calculate the outcrossing rate using equation t = (1 – FIS)/(1 + FIS) (Weir 1996). The data were also used to compute polymorphism information content (PIC) (Anderson et al. 1993).
In order to determine genetic relationship among the 299 lablab accessions, Nei’s genetic distance (DA) (Nei et al. 1983) for all pairs of the accessions was calculated using POPULATIONS 1.2.32 (Langella 2002). The DA matrix was then used for neighbor-joining analysis using MEGA 7.0 (Tamura et al. 2013). The same matrix was also used for principle coordinate analysis (PCoA) using XLStat (Addinsoft, New York, USA).
Population structure of the 299 lablab accessions was determined by STRUCTURE 2.3.4 (Pritchard et al. 2007). Initially, we performed a 20 simulation run using number of assumed populations (K) ranging from 1 to 10 with a burn-in period of 10,000 and 50,000 replicates of Bayesian Markov Chain Monte Carlo (MCMC) algorithm. The outputs from the simulation run were used to estimate the number of K using the ad-hoc ΔK method (Evanno et al. 2005). Subsequently, a run with optimum K, burn-in period of 100,000 and 500,000 replicates of the MCMC algorithm was performed to assign each individual to a cluster.
In total, 145 SSR markers from four legume crops including lablab (21 markers), azuki bean (87 markers), mungbean (29 markers), cowpea (5 markers) and common bean (3 markers) were screened for polymorphism in six individuals of lablab. All the markers (100%) from lablab successfully amplified the DNA, while 73 (83.9%), 22 (75.9%), 3 (60.0%) and 2 (66.7) markers from azuki bean, mungbean, cowpea and common bean successfully amplified the lablab DNA. Six (28.6%), 6 (6.8%), 2 (6.9%), 1 (20.0%) and 1 (33.3%) markers from lablab, azuki bean, mungbean, cowpea and common bean, respectively, showed polymorphism.
When the 13 polymorphic SSR markers were used to analyze 299 individuals of lablab. The markers detected only 34 alleles in total (Table 1). The number of alleles per marker ranged from 2 (c13353_g1_i1, DMB-SSR228, VES0117, KTD241, KTD184, CEDG024 and CEDG044) to 4 (c17963_g1_i1 and BM142) with an average of 2.6 (Table 1). The PIC values of the markers varied between 0.04 (BM142) and 0.67 (c17963_g1_i1) with an average of 0.36 (Table 1).
| Marker | NA | HO | HE | PIC |
|---|---|---|---|---|
| c13353_g1_i1 | 2 | 0.004 | 0.228 | 0.23 |
| c17963_g1_i1 | 4 | 0.033 | 0.674 | 0.67 |
| Hbp016 | 3 | 0.016 | 0.609 | 0.59 |
| KTD241 | 2 | 0.006 | 0.501 | 0.49 |
| KTD184 | 2 | 0.025 | 0.108 | 0.15 |
| VES0117 | 2 | 0.017 | 0.444 | 0.45 |
| CEDG024 | 2 | 0.045 | 0.495 | 0.49 |
| CEDG030 | 3 | 0.057 | 0.619 | 0.61 |
| CEDG044 | 2 | 0.053 | 0.164 | 0.19 |
| DMB-SSR024 | 3 | 0.000 | 0.040 | 0.04 |
| DMB-SSR228 | 2 | 0.002 | 0.087 | 0.06 |
| VM27 | 3 | 0.008 | 0.192 | 0.13 |
| BM142 | 4 | 0.017 | 0.544 | 0.52 |
| Average | 2.6 | 0.026 | 0.362 | 0.36 |
| Overall | 34 | 0.022 | – | – |
The number of alleles, observed heterozygosity, gene diversity, and allelic richness of the lablab from the four regions are summarized in Table 2. The number of alleles varied from 25 in the west to 33 in the north with an average of 30.50. However, the number of alleles in the north were nearly the same with that in the northeast and the central. Observed heterozygosity was low, varying from 0.015 to 0.032 with an overall of 0.022. This implies low outcrossing rate. The overall gene diversity was relatively low, being 0.360. Gene diversity among the different regions varied between 0.331 and 0.351. Overall fixation index was 0.95, indicating high self-pollination rate. Overall outcrossing rate was 2.67%, lablab plants from the west exhibited about two- to three-fold higher outcrossing rate (5.37%) than those from the other regions.
| Geographical region | Number of individuals | NA | AR | HO | HE | FIS | t (%) |
|---|---|---|---|---|---|---|---|
| North | 145 | 33 | 27.35 | 0.015 | 0.331 | 0.96 | 2.15 |
| Northeast | 113 | 32 | 29.90 | 0.024 | 0.351 | 0.93 | 3.73 |
| Central | 30 | 32 | 29.86 | 0.015 | 0.338 | 0.96 | 1.99 |
| West | 11 | 25 | 25.00 | 0.032 | 0.343 | 0.90 | 5.37 |
| Overall | 299 | 34 | 29.42 | 0.022 | 0.360 | 0.95 | 2.67 |
| Average | 74.75 | 30.50 | 28.00 | 0.0215 | 0.345 | 0.94 | 3.31 |
Two subspecies of lablab exist in Thailand; purpureus and bengalensis. These two subspecies showed comparable number of alleles, observed heterozygosity, gene diversity, allelic richness, and fixation index (Table 3). However, the outcrossing rate of the subspecies bengalensis was about two-fold higher than that of the subspecies purpureus, being 4.38% and 2.04%, respectively.
| Subspecies | Number of individuals | NA | AR | HO | HE | FIS | t (%) |
|---|---|---|---|---|---|---|---|
| purpureus | 176 | 34 | 33.42 | 0.029 | 0.372 | 0.96 | 2.04 |
| bengalensis | 84 | 32 | 32.00 | 0.022 | 0.341 | 0.92 | 4.38 |
| Overall | 260 | 34 | 33.26 | 0.029 | 0.362 | 0.95 | 2.72 |
| Average | 130 | 33 | 32.7 | 0.0255 | 0.356 | 0.94 | 3.21 |
Bayesian clustering analysis using STRUCTURE software (Pritchard et al. 2007) in combination with Evanno’s ad hoc ΔK statistic (Evanno et al. 2005) revealed two sub-populations, I and II, in the 299 lablab accessions (Supplemental Fig. 2A). The sub-population I was composed of 124 individuals; 89, 17, 12 and 6 individuals from the north, northeast, central and west, respectively (Supplemental Fig. 2B). There were 104 individuals with known subspecies in this subpopulation of which 71 and 33 individuals were the subspecies purpureus and bengalensis, respectively. The sub-population II was composed of 175 individuals; 56, 96, 18 and 5 individuals from the north, northeast, central and west, respectively (Supplemental Fig. 2B). There were 156 individuals with known subspecies in this subpopulation of which 104 individuals were the subspecies purpureus, while 52 individuals were the subspecies bengalensis.
Neighbor-joining analysisA neighbor-joining tree constructed using Nei’s genetic distance (Nei et al. 1983) showed that the 299 lablab individuals were grouped into major clusters (I and II) (Fig. 2A), albeit the two clusters were not statistically supported by bootstrap; the bootstrap values at the major nodes were lower than 20. The cluster I was composted of 136 individuals. Seventy-three, 48, 11 and 4 individuals from the northeast, north, central and west were included in this cluster. There were sub-clusters of individuals from the northeast or the north. The cluster II was composted of 163 individuals of which 97, 40, 19 and 7 were from the north, northeast, central and west, respectively. The cluster II can be separated into two sub-clusters, II-A and II-B (Fig. 2A). The sub-cluster II-A mostly contained individuals from the northeast, while the sub-cluster II-B principally contained individuals from the north (Fig. 2A). When subspecies information were integrated into the neighbor-joining tree, it was found that the subspecies purpureus and bengalensis were not clearly differentiated, albeit purpureus or bengalensis individuals tended to cluster together (Fig. 2B).

Neighbor-joining tree constructed from Nei’s genetic distance depicting genetic relationship among the 299 individuals of Lablab purpureus from Thailand. The distance was calculated from allelic data of 13 simple sequence repeat loci. (A) Individuals are shown based on their geographical origins. (B) Individuals are shown based on the subspecies they belonged to.
PCoA analysis based on Nei’s genetic distance (Nei et al. 1983) demonstrated that the first three PCs together accounted for 74.5% of the total variation. The PC1, PC2 and PC3 accounted for 32.9, 23.9 and 17.7% of the total variation, respectively. A scatter plot of the 299 lablab germplasm plotted using PC1 and PC2 revealed that most of the individuals were differentiated from one another (Fig. 3A). Lablabs from each region showed wide distribution (Fig. 3A). In the northern and northeastern regions that comprised many lablab individuals, several lablabs from these two regions showed unique distribution, albeit many of them showed overlapped distribution (Fig. 3A). Most of the lablabs from the north were in the right of the plot, while most of the lablabs from the northeast were in the left of the plot. Both subspecies purpureus and bengalensis showed wide distribution on the PCoA plot and individuals of the two subspecies were intermingled (Fig. 3B).
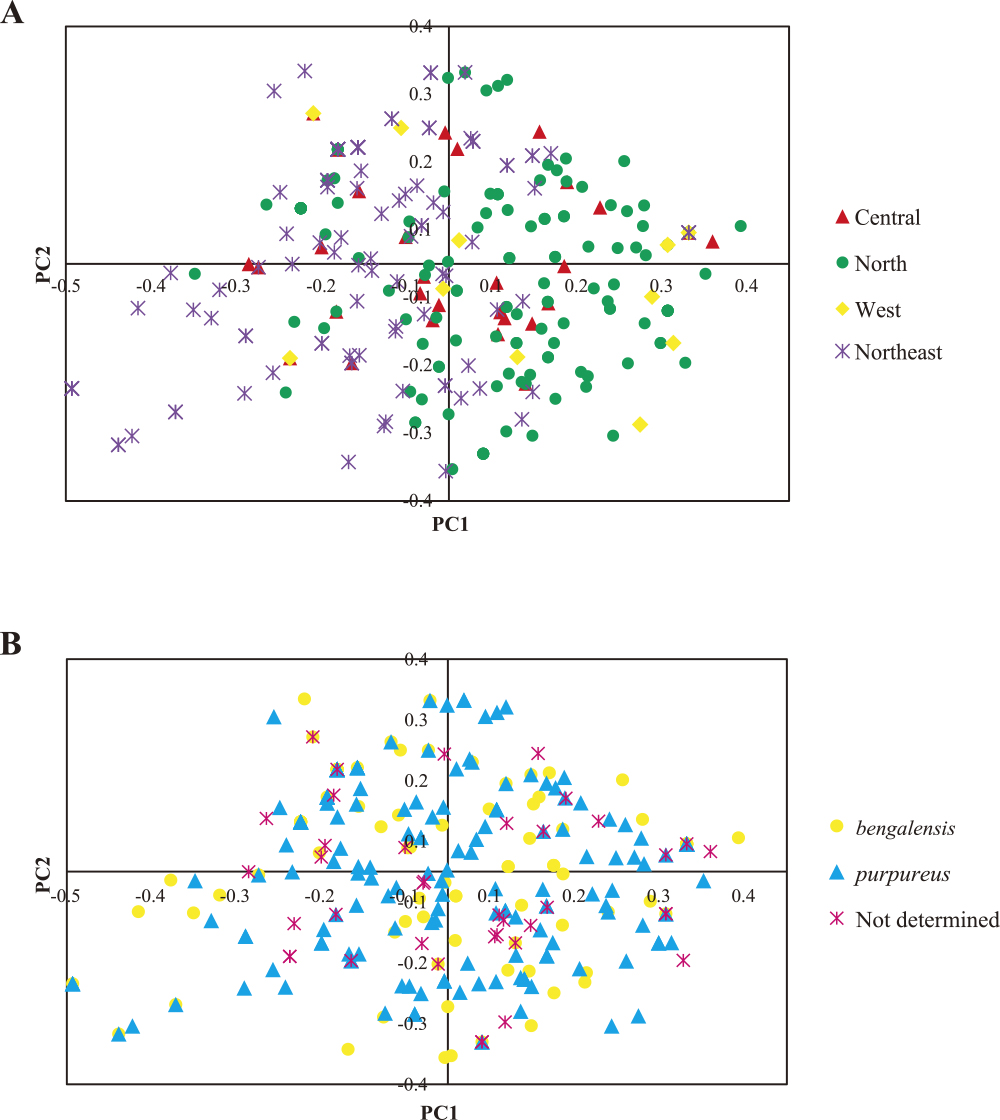
Scatter-plot of PC1 and PC2 from principal coordinate analysis based on Nei’s genetic distance depicting genetic relationship among the 299 accessions of Lablab purpureus from Thailand. The distance was calculated from allelic data of 13 simple sequence repeat loci. The distance was calculated from allelic data of 13 simple sequence repeat loci. (A) Individuals are shown based on their geographical origins. (B) Individuals are shown based on the subspecies they belonged to.
Knowledge and understanding on diversity and structure of a genepool of crop is a prime importance for germplasm conservation and planning a plant breeding program. SSR marker is a standard DNA marker system popularly utilized in plant diversity analysis due to its several advantages, including being co-dominant, PCR-based, multi-allelic and easy-to-score (Varshney et al. 2005). In this study, we analyzed diversity of the 299 lablab individuals from Thailand using 13 SSR loci.
In this study, 145 SSR markers from lablab (21 markers), common bean (3 markers) and three Vigna species (azuki bean, mungbean and cowpea; 121 markers) were screened for polymorphism in six lablab individuals. Although all of the markers developed specifically from the lablab successfully amplified the DNA, only six (28.6%) of them showed polymorphism. When five of the six polymorphic markers were used to analyzed 299 lablab individuals from various origins of Thailand, they revealed only 2 to 4 alleles per marker with an average of 2.6 (Table 1). In fact, all these 21 lablab SSR markers have been previously reported to be polymorphic in other sets of lablab germplasm (Keerthi et al. 2018, Robotham and Chapman 2017, Zhang et al. 2013). Thus, these results indicate low SSR polymorphism in the lablab germplasm in Thailand.
One hundred and twenty-five out of 145 SSR markers (86.2%) from Vigna species screened for polymorphism in the six lablab individuals were able to amplify the lablab DNA. The high percentage of cross-species amplification in the lablab indicates high genome conservation between the genus Vigna and Lablab. Previously, high genome conservation between these two genera have been demonstrated. A comparative genome map between lablab and mungbean (V. radiata) revealed high genome conservation between these species (Humphry et al. 2002). Nonetheless, in this study only 9 out of 121 SSR markers (7.4%) from Vigna species showed polymorphism in the screening. When these polymorphic markers were analyzed in the 299 lablab germplasm, they detected only 2–4 alleles per locus with an average of 2.6. Again, this result indicates the low SSR polymorphism in the lablab cultivars in Thailand. However, it is worth noting that nearly a half of the SSR markers used in these study are genic markers (47%), thus they are in general highly conserved but show low polymorphism (Varshney et al. 2005).
Although 13 SSR markers analysis in the 299 lablab individuals of the subspecies purpureus and bengalensis from Thailand revealed low number of alleles, the gene diversity calculated from these markers was not very low, being 0.36 (Tables 1, 2). This value is not much different from the gene diversity value, 0.52, estimated for 91 lablab accessions including subspecies purpureus, bengalensis and uncinatus (wild) that originated from several countries of Asia, Africa, America and Australia (Robotham and Chapman 2017). However, it should be noted that many of the alleles presented in the global genepool reported by Robotham and Chapman (2017) are absent in the genepool of lablab in Thailand. For examples, 27 alleles were detected in the global genepool by the SSR markers c13119_g1_il, c21512_g2_il c22788_g1_il and c23309_g1_i1 (Robotham and Chapman 2017), but these markers each detected one allele in the Thailand lablab genepool (Table 1). A similar result is reported by Venkatesha et al. (2007) who demonstrated very limited genetic diversity lablab germplasm from the southern India as compared to a set of germplasm from different countries. Nonetheless, our results suggest that although the lablab germplasm in Thailand possesses a considerable genetic diversity as compared to the global lablab collection, for breeding purpose additional diversity from exotic lablab germplasm should be integrated into the local genepool. It is worth mentioning that the subspecies purpureus and bengalensis from Thailand possessed comparable level of genetic diversity (Table 3).
STRUCTURE analysis revealed two sub-populations (clusters) among the 299 lablab individuals from Thailand (Supplemental Fig. 2). NJ analysis also suggested two clusters in this set of lablab germplasms (Fig. 2). However, the clusters of lablab germplasm revealed by these two approaches are largely different (Fig. 2A, Supplemental Fig. 2). Each cluster is composed of accessions from different geographical regions. In contrast, PCoA analysis revealed no clear clustering of the lablab germplasm; most of the accessions from different regions showed overlapped distribution on the PCoA plot (Fig. 3A). These results indicate high genetic admixture of the lablab germplasm in Thailand. One reason that may explain the high genetic admixture found in this study is migration of seeds. During the collection of lablab germplasm used in this study, we were told by some farmers/villagers that the seeds of the lablab plants they grown are from other provenances and that some of their relatives take the seeds with them when they move to other provenances. Also, few farmers/villagers told that they exchange lablab seeds with people from other villages. Seed migration mediated by socio-cultural factors can shape genetic diversity and structure of crops (Hodgkin et al. 2007, Pautasso et al. 2013). Nonetheless, all the cluster analyses consistently showed that the lablab germplasm of the subspecies purpureus and bengalensis from Thailand are not genetically differentiated (Figs. 2B, 3B, Supplemental Fig. 2). This result is in line with previous reports by Maass et al. 2005 and Robotham and Chapman (2017) that the two subspecies are genetically clustered together.
Although genetic parameters relating to diversity such as number of alleles, gene diversity and allelic richness of the lablab germplasm from different regions are very similar, the germplasm from the west appeared to be highly diverse (Fig. 3A) as only 11 individuals from this region were used. Moreover, all of the individuals from the west were collected from the same province, Tak (Supplemental Table 1). This suggests high diversity of the lablab in this province. Lablab germplasm from this province and other provinces in the west should be collected and conserved.
P.S. conceived, designed and supervised study. J.M.S., P.S. and K.A. collected leaves. K.A. and J.M.S. conducted DNA marker analysis. K.A. and P.S. performed data analysis. J.M.S and P.S. sought funding. P.S. and K.A. wrote and revised manuscript.
This research is supported by Kasetsart University Research and Development Institute, Kasetsart University, Thailand.