Abstract
Bacterial blight caused by Xanthomonas oryzae pv. oryzae (Xoo) is an important disease constraining rice (Oryza sativa L.) production worldwide. The XM6 line was induced by N-methyl-N-nitrosourea from IR24, an Indica cultivar that is susceptible to Philippine and Japanese Xoo races. XM6 was confirmed to carry a recessive gene named xa20, resistant to six Philippine and five Japanese Xoo races. The chromosomal gene location was found using 10 plants with the shortest lesion length in an F2 population consisting of 298 plants from a susceptible Japonica variety Koshihikari × XM6. Analysis using PCR-based DNA markers covering the whole rice genome indicated the gene as located on the distal region of the long arm of chromosome 3. The IKC3 line carries IR24 genetic background with Koshihikari fragment on chromosome 3 where a resistance gene was thought to be located. The F2 population from IKC3 × XM6 clearly showed a bimodal distribution separating resistant and susceptible plants. Further linkage analysis conducted using this F2 population revealed that xa20 is located within the 0.8 cM region flanked by DNA markers KIC3-33.88 (33.0 Mb) and KIC3-34.06 (33.2 Mb). This study yields important findings for resistance breeding and for the genetic mechanism of Xoo resistance.
Introduction
Rice (Oryza sativa L.), together with maize and wheat, are the most important cereal crops in the world. Rice is the second most produced cereal crop globally. On average, the world produces about 740 million tons of milled rice annually (FAOSTAT http://www.fao.org/faostat/en/#data/QC). It is the staple food of more than half of the world’s population. Rice is grown on every continent except Antarctica, but Asia accounts for 90% of its global production. In spite of its success, rice production is constrained considerably by numerous diseases. Among the major diseases of rice, bacterial blight (BB) is extremely destructive. This disease, which results from a bacterium: Xanthomonas oryzae pv. oryzae (Xoo), is a disease of economic importance particularly in Asia and Africa. It has also been reported in rice-growing regions of Australia and Latin America (Mew 1987, Mew et al. 1993, Séré et al. 2005).
The disease, which usually develops in paddy fields with Xoo contaminated stubble and weeds, can be found in both tropical and temperate climates, particularly in lowland areas that are either rain-fed or irrigated (Ou 1985). In general, the disease favors temperatures of 25−34°C, with greater than 70% relative humidity. Yield loss resulting from BB can reach 50% when susceptible varieties are grown in environments favorable to the disease (Mew et al. 1993). When BB infects plants at the booting stage, it does not affect the quantity of yield. However, the grains and kernel quality becomes severely degraded (Khan et al. 2015, Reddy 1997, Shaheen et al. 2019).
Several genetic, biological, and chemical control approaches are used for protection of rice from BB. Pesticides containing bismerthiazol and streptomycin as active ingredients are used as major bactericides against Xoo, although results of recent studies have indicated that Xoo has developed high resistance against these widely used chemicals (Shi et al. 2015, Xu et al. 2010, Yu et al. 2016, Zhu et al. 2013). With the biological control approach, specific plant-growth-promoting rhizobacteria have been used experimentally. Treatment of rice seeds with fresh suspensions or powdered formulations of Bacillus subtilis or Bacillus pumilus has been found to induce systemic resistance in rice against Xoo (Chithrashree et al. 2011). However, pathogen variation and the lack of suitable biological agents undermine the efficacy of biological controls. The use of genetically resistant varieties has been reported as the most economical and effective disease control technique (Horino et al. 1982, Mew et al. 1993, Ogawa and Khush 1989).
A review by Chukwu et al. (2019) listed 42 genes of resistance (Xa/xa) against Xoo. Since then, four more genes have been reported: Xa43(t) (Kim and Reinke 2019), xa44 (Kim 2018), xa45(t) (Neelam et al. 2020), and Xa46(t) (Chen et al. 2020). A few of these genes have been used for development of breeding lines with pyramided resistance genes in most Asian countries since the 1970s. However, Xoo has been shown to evolve and defeat the resistance of the genes in widely used cultivars. In Taiwan, Deng et al. (2016) found a strain of Xoo ‘2011_Yli_X133’, that defeated previously effective genes xa5 and Xa21, respectively, in IRBB5 and IRBB21. The Indian subcontinent presents higher probability of resistance breakdown. There, some Xanthomonas strains have shown virulence on pyramided lines with multiple resistance genes including IRBB52 (Xa4 + Xa21), IRBB50 (Xa4 + xa5), and IRBB54 (xa5 + Xa21) (Lore et al. 2011, Yugander et al. 2017). Therefore, a constant need exists for investigating new resistant genes, and for mapping and cloning of earlier discovered genes. Taura et al. (1991a, 1991b, 1992a) produced ‘XM5’ and ‘XM6’ Xoo resistant mutants by induction of N-methyl-N-nitrosourea (MNU) mutagen. The mutants were found to be resistant to six tested Philippines races. The XM5 and XM6 lines each carry one recessive resistance gene, designated respectively as xa19 and xa20. These genes have not yet been mapped. For this study, we conducted a genetic and linkage analysis of resistant gene xa20 in XM6 to map the gene location. These study findings are expected to be useful for elucidating mechanisms of the resistance of xa20.
Materials and Methods
Bacterial races and plant materials
The Xoo bacterial races used for this study were five Japanese races: race I (strain T7174), race IIA (strain T7147), race III (strain T7133), race IV (strain H75373), and race V (strain H75304).
IR24, an Indica rice cultivar released in 1972 by the International Rice Research Institute (IRRI), is susceptible to six Philippines Xoo races: race 1 (strain PXO 61), race 2 (strain PXO 86), race 3 (strain PXO 79), race 4 (strain PXO 71), race 5 (strain PXO 112), and race 6 (strain PXO 99) (Taura et al. 1991a, 1992b). Moreover, it is susceptible to the five Japanese Xoo races described earlier. (Ogawa and Yamamoto 1987). XM6, a mutant line derived from IR24, is actually resistant to four Japanese and six Philippine Xoo races tested (Taura et al. 1992a). Koshihikari, a popular Japonica rice cultivar used widely in Japan, Australia, and the United States, is known to be susceptible to seven Japanese Xoo races tested (Noda and Ohuchi 1989). The F2 population from the cross between Koshihikari and XM6 was subjected to preliminary linkage analysis for rough mapping of xa20 to ascertain the chromosomal location of the gene.
For precise mapping of xa20, we adopted the IAS16 line, which is a reciprocal chromosome segment substitution line (CSSL) between the Japonica cultivar ‘Asominori’ and IR24 (Kubo et al. 2002). The graphical genotypes of IAS lines are available at https://www.shigen.nig.ac.jp/rice/oryzabase/strain/recombinant/genotypeIAS. Among 70 IAS lines, we selected IAS16 because it carries an Asominori chromosomal segment covering C1677 to G249 (https://rgp.dna.affrc.go.jp/E/publicdata/geneticmap2000/chr03.html). Actually, G249 is located near RM3346. We have already used this line for mapping the XA42 gene (Busungu et al. 2016, 2018). Moreover, we have checked its genotypes for the DNA markers in our stock. IAS16 carried the Asominori chromosomal segment covering RM3525 (located on 30.4 Mb of Os-Nipponbare-Reference-IRGSP-1.0 (Kawahara et al. 2013) of chromosome 3) and RM3346 (33.3 Mb) (Table 1). IAS16 seemed suitable for mapping the precise mapping of xa20 gene. Asominori is resistant to Japanese Xoo races I and V, but is susceptible to races II, III, and IV (Kaku and Kimura 1989). Actually, IAS16 is susceptible to the five Japanese Xoo races described earlier (Busungu et al. 2016). As described in Results, the strategy for using IAS16 for mapping xa20 under IR24 background with low genetic noise was unsuccessful. Therefore, as an alternative to IAS16, we developed a line named IKC3, which includes the Koshihikari chromosomal fragment of xa20 candidate region by backcrossing IR24 twice to a recombinant inbred line from the cross IR24 × Koshihikari, with subsequent selfing. The F2 plants from the cross between IAS16 × XM6 and subsequently, the cross between IKC3 × XM6 were subjected to precise linkage analysis. F3 plants from the cross between IKC3 and XM6 were grown to confirm the genotypes of the informative recombinant plants in F2. For this study, we tested XM6, IAS16, IR24, IKC3, and Koshihikari to assess their reactions to Japanese Xoo races under similar conditions.
Table 1.
DNA marker banding patterns for IR24, IAS16, IKC3, Koshihikari, and Asominori
|
|
Banding pattern of DNA markers on chromosome 3a |
| RM16 |
RM3513 |
RM3436 |
RM3525 |
KIC3-33.25 |
KIC3-33.88 |
KIC3-34.06 |
RM3346 |
RM1221 |
| Rice accession |
Location on IRGSP1.0 (kb) |
23,127 |
25,112 |
27,415 |
30,394 |
32,354 |
33,036 |
33,210 |
33,325 |
35,677 |
| IR24 |
|
I |
I |
I |
I |
I |
I |
I |
I |
I |
| XM6 |
|
I |
I |
I |
I |
I |
I |
I |
I |
I |
| IAS16 |
|
J |
J |
I |
J |
I |
I |
J |
J |
I |
| IKC3 |
|
I |
I |
J |
J |
J |
J |
J |
J |
J |
| Koshihikari |
|
J |
J |
J |
J |
J |
J |
J |
J |
J |
| Asominori |
|
J |
J |
J |
J |
J |
J |
J |
J |
J |
a I and J respectively denote the same banding pattern as IR24 and the other patterns expressed collectively.
Germinated seeds of F2 segregating populations arising from the cross between Koshihikari and XM6 and parental lines were sown in seedling boxes in a greenhouse in 2012. Two weeks later, seedlings were moved from the greenhouse. They were kept in an open-air area that was completely enclosed by wire mesh. About three weeks later, seedlings were transplanted to a paddy field in the Kagoshima University Experimental Farm. From each parental line, 10 plants were planted along with the respective segregating populations. The same procedures of this experiment were performed for F2 segregating populations derived from the cross between IAS16 and XM6 in 2014, and the cross between IKC3 and XM6 in 2018. F3 lines selected from recombinant F2 plants resulting from cross between IKC3 and XM6 were sown in 2019, following the same procedures at the same farm as that used for experiments. The applied fertilizers were 6, 3, and 3 g/m2, respectively, for N, K2O, and P2O5. One week before inoculation, 3 g/m2 of N additional fertilizer was applied. Rice seedlings were planted at 15 cm spacing within rows and 30 cm between rows.
Inoculation test
Xoo stocks were stored in skim milk medium (10% skim milk, 1.5% L-monosodium glutamate) tubes at –80°C in a deep freezer. Potato semi-synthetic agar medium (Wakimoto 1954) was used for culture and inoculum preparation. One week before inoculation, bacteria were transferred from the stock tube to the slanted tube and were incubated at 28°C for 2 days. The growing bacteria were used for second stocks within a week of bacteria growth and were kept in a refrigerator at 4°C. The bacteria from second stocks were transferred to new slanted tubes and were incubated at 28°C for 2 days as well. The inoculum was subsequently diluted with distilled water. The absorbance was adjusted to A = 0.05 (620 nm) using a spectrophotometer. The value corresponds to concentration of about 108 colony-forming units per milliliter (cfu/ml). The plants were inoculated using clipping during the booting stage to the flowering stage (Kauffman et al. 1973). Then the reaction of each plant was ascertained from the mean lesion length (LL) of three leaves measured using a ruler at 18 days after inoculation. Scoring of LL of some F3 lines and F2 plants from the cross between IKC3 and XM6 was based on visual observation.
DNA markers and linkage analysis
Simple Sequence Repeat (SSR) and Insertion/Deletion (Indel) markers used for PCR reactions during the course of this study worked better when the DNA concentration was about 10 ng/μl–20 ng/μl. DNA was extracted according to Dellaporta et al. (1983) with some modifications. The PCR-mixture (5 μl) contained 10 ng of genomic DNA, 200 μM dNTPs, 0.2 μM of each primer, 0.25 U of Taq polymerase and 1x buffer containing MgCl2. The PCR conditions were set as follows: 95°C for 5 min, 35 cycles at 94°C for 30 s, 55°C for 30 s, and 72°C for 30 s, with subsequent final extension at 72°C for 7 min. After the PCR products were separated in 10% (29:1) polyacrylamide gels, they were stained with ethidium bromide and were visualized using ultraviolet light (GelDoc-It® TS Imaging system; UVP LLC, CA, USA).
For preliminary linkage analysis using the cross between Koshihikari and XM6, we used 108 published SSR and Indel markers developed by Busungu et al. (2016), Chen et al. (1997), Ichitani et al. (2011), IRGSP (2005), McCouch et al. (2002), Monna et al. (2006), Panaud et al. (1996), Shen et al. (2004), Temnykh et al. (2000), Toyomoto et al. (2019), and Rice Genome Research Program (https://rgp.dna.affrc.go.jp/E/publicdata/caps/index.html) (Table 2, Supplemental Table 1).
Table 2.
Genotypes of 108 DNA markers covering the entire rice genome of ten plants with the shortest lesion length derived from the F
2 population from the cross between Koshihikari and XM6
| Chromosome |
DNA markerb |
Genotypea |
Recombination frequencyc |
| Individuala |
| 1 |
2 |
3 |
4 |
5 |
6 |
7 |
8 |
9 |
10 |
| 1 |
RM1282 |
X |
K |
X |
X |
H |
H |
K |
H |
H |
X |
0.40 |
| RM220 |
X |
K |
X |
X |
H |
H |
K |
X |
H |
H |
0.40 |
| RM259 |
H |
H |
H |
X |
H |
H |
H |
X |
H |
H |
0.60 |
| RM8132 |
K |
H |
K |
X |
K |
K |
H |
X |
K |
K |
0.70 |
| RM5422 |
K |
H |
K |
X |
H |
K |
X |
X |
H |
H |
0.50 |
| S13623 |
K |
H |
K |
X |
H |
K |
H |
H |
H |
H |
0.60 |
| RM8129 |
H |
H |
K |
X |
H |
K |
H |
H |
K |
K |
0.65 |
| RM1297 |
H |
X |
K |
H |
H |
H |
H |
H |
K |
H |
0.55 |
| RM212 |
H |
X |
H |
– |
H |
H |
H |
H |
K |
H |
0.50 |
| RM5448 |
X |
X |
X |
X |
– |
H |
K |
H |
K |
H |
0.39 |
| RM8099 |
H |
X |
X |
X |
H |
K |
K |
H |
K |
K |
0.55 |
| 2 |
RM211 |
K |
H |
H |
H |
– |
H |
H |
K |
K |
K |
0.72 |
| RM6853 |
H |
X |
H |
H |
H |
H |
H |
H |
K |
H |
0.50 |
| S1864 |
H |
H |
H |
H |
H |
H |
H |
H |
K |
X |
0.50 |
| RM29 |
H |
X |
H |
H |
X |
H |
H |
X |
K |
X |
0.35 |
| RM3762 |
K |
X |
H |
H |
H |
X |
H |
X |
K |
H |
0.45 |
| RM3515 |
K |
X |
X |
X |
H |
X |
H |
X |
K |
H |
0.35 |
| RM1367 |
H |
X |
X |
X |
H |
X |
H |
H |
H |
X |
0.30 |
| RM6 |
H |
X |
X |
X |
H |
X |
X |
H |
X |
X |
0.15 |
| RM240 |
K |
X |
X |
H |
H |
X |
X |
H |
X |
X |
0.25 |
| RM250 |
H |
H |
H |
H |
X |
X |
X |
H |
X |
X |
0.25 |
| 3 |
RM22 |
H |
X |
H |
H |
– |
H |
X |
H |
H |
H |
0.39 |
| E50818 |
X |
X |
X |
H |
– |
H |
H |
H |
X |
H |
0.28 |
| RM251 |
K |
X |
H |
H |
X |
H |
H |
K |
H |
K |
0.55 |
| RM282 |
H |
H |
H |
X |
– |
X |
X |
H |
H |
H |
0.33 |
| RM6959 |
H |
H |
H |
X |
X |
X |
X |
H |
H |
H |
0.30 |
| KGC3 16.7 |
K |
H |
H |
H |
X |
X |
X |
H |
H |
H |
0.40 |
| RM5488 |
K |
H |
H |
H |
X |
X |
X |
H |
H |
X |
0.35 |
| RM3513 |
K |
H |
H |
H |
X |
X |
X |
H |
H |
X |
0.35 |
| RM3436 |
K |
H |
H |
H |
X |
X |
X |
H |
H |
X |
0.35 |
| RM3525 |
X |
X |
X |
H |
X |
X |
X |
X |
X |
X |
0.05 |
| RM3346 |
X |
X |
X |
X |
X |
X |
X |
X |
X |
X |
0.00 |
| RM1221 |
X |
X |
X |
X |
X |
X |
X |
H |
X |
X |
0.05 |
| 4 |
C61009 |
H |
H |
H |
H |
X |
H |
X |
X |
H |
K |
0.40 |
| RM7279 |
H |
H |
H |
H |
X |
H |
H |
H |
H |
K |
0.50 |
| RM17144 |
H |
H |
H |
H |
K |
H |
H |
H |
X |
K |
0.55 |
| RM303 |
K |
H |
H |
H |
K |
H |
H |
H |
X |
K |
0.60 |
| RM255 |
K |
K |
H |
H |
X |
H |
H |
H |
H |
X |
0.50 |
| KGC4M20 |
K |
K |
H |
H |
H |
H |
H |
H |
H |
H |
0.60 |
| RM348 |
K |
K |
K |
K |
H |
H |
H |
H |
K |
H |
0.75 |
| 5 |
RM7373 |
H |
H |
K |
H |
H |
H |
H |
K |
H |
H |
0.60 |
| RM1688 |
H |
H |
K |
H |
H |
H |
H |
K |
H |
K |
0.65 |
| RM5874 |
H |
H |
K |
H |
X |
H |
H |
H |
H |
K |
0.55 |
| RM3381 |
H |
H |
H |
H |
K |
K |
X |
K |
H |
K |
0.65 |
| RM7568 |
H |
H |
H |
H |
K |
K |
X |
K |
K |
K |
0.70 |
| E60663 |
H |
H |
H |
H |
K |
K |
X |
K |
K |
X |
0.60 |
| RM6054 |
H |
H |
H |
H |
K |
K |
X |
K |
K |
X |
0.60 |
| RM3476 |
H |
H |
H |
H |
H |
K |
X |
K |
K |
X |
0.55 |
| RM31 |
X |
X |
H |
H |
K |
H |
H |
H |
H |
X |
0.40 |
| 6 |
E30287 |
H |
H |
X |
H |
H |
X |
K |
K |
X |
H |
0.45 |
| RM1163 |
X |
X |
X |
H |
H |
X |
X |
H |
X |
H |
0.20 |
| RM276 |
X |
X |
X |
K |
H |
X |
X |
X |
X |
H |
0.20 |
| CH6 8820 |
X |
X |
H |
K |
X |
X |
X |
X |
X |
H |
0.20 |
| CH6 12020 |
H |
X |
H |
H |
X |
X |
X |
X |
X |
H |
0.20 |
| RM3 |
H |
X |
K |
H |
X |
X |
X |
X |
X |
K |
0.30 |
| RM3628 |
H |
X |
K |
H |
K |
X |
X |
X |
X |
X |
0.30 |
| C11635 |
X |
X |
K |
H |
H |
H |
H |
X |
X |
X |
0.30 |
| RM5814 |
X |
X |
H |
X |
X |
H |
H |
X |
X |
X |
0.15 |
| 7 |
RM5752 |
X |
X |
H |
X |
K |
H |
H |
K |
X |
H |
0.40 |
| RM1353 |
X |
X |
X |
X |
H |
H |
H |
H |
X |
H |
0.25 |
| RM6574 |
H |
X |
X |
H |
H |
H |
H |
X |
X |
H |
0.30 |
| JC7 5.308 |
H |
X |
X |
X |
H |
H |
H |
X |
X |
H |
0.25 |
| RM5672 |
H |
X |
X |
X |
H |
H |
H |
X |
X |
H |
0.25 |
| RM500 |
H |
X |
X |
X |
H |
X |
X |
X |
X |
H |
0.15 |
| C30372 |
H |
X |
H |
X |
H |
X |
X |
X |
X |
H |
0.20 |
| RM3826 |
X |
X |
H |
X |
H |
X |
X |
H |
X |
H |
0.20 |
| RM234 |
K |
H |
X |
K |
X |
X |
X |
H |
X |
H |
0.35 |
| RM1306 |
K |
H |
H |
K |
H |
X |
X |
H |
X |
H |
0.45 |
| 8 |
RM6369 |
X |
H |
X |
K |
H |
X |
K |
H |
H |
X |
0.40 |
| RM6863 |
X |
H |
X |
H |
H |
X |
H |
H |
K |
X |
0.35 |
| RM5556 |
X |
K |
X |
H |
K |
X |
H |
H |
H |
X |
0.40 |
| RM6429 |
X |
K |
H |
H |
K |
X |
H |
X |
X |
X |
0.35 |
| RM3395 |
X |
K |
X |
H |
K |
H |
H |
– |
H |
X |
0.44 |
| RM22928 |
X |
K |
X |
H |
K |
H |
H |
H |
H |
X |
0.45 |
| RM223 |
K |
K |
H |
H |
K |
X |
H |
X |
H |
H |
0.55 |
| RM7556 |
K |
K |
H |
K |
K |
X |
H |
H |
K |
H |
0.70 |
| RM80 |
K |
H |
H |
K |
K |
X |
K |
H |
H |
H |
0.65 |
| RM3120 |
H |
K |
H |
H |
K |
K |
H |
K |
K |
K |
0.80 |
| 9 |
RM7212 |
H |
K |
H |
H |
H |
X |
H |
X |
X |
X |
0.35 |
| E1828 |
H |
K |
H |
H |
H |
X |
H |
H |
X |
X |
0.40 |
| RM3912 |
H |
H |
H |
H |
H |
H |
K |
K |
H |
H |
0.60 |
| RM6771 |
H |
H |
H |
H |
H |
H |
K |
K |
H |
H |
0.60 |
| RM257 |
K |
K |
H |
H |
– |
H |
K |
K |
H |
H |
0.72 |
| RM201 |
K |
K |
H |
K |
H |
K |
H |
K |
H |
H |
0.75 |
| E21191 |
K |
H |
H |
K |
H |
K |
H |
K |
H |
– |
0.72 |
| 10 |
RM7361 |
H |
K |
H |
H |
H |
H |
K |
H |
K |
H |
0.65 |
| C51124 |
K |
K |
H |
H |
H |
H |
K |
H |
K |
H |
0.70 |
| KGS0342 |
K |
K |
K |
H |
H |
H |
X |
H |
K |
H |
0.65 |
| RM1375 |
K |
K |
K |
H |
H |
H |
H |
H |
K |
H |
0.70 |
| RM258 |
K |
H |
K |
H |
H |
K |
X |
H |
K |
H |
0.65 |
| KGR10M40 |
– |
X |
K |
H |
H |
H |
X |
H |
K |
– |
0.50 |
| RM5352 |
K |
H |
H |
H |
H |
X |
X |
H |
X |
X |
0.35 |
| RM228 |
K |
H |
H |
H |
H |
X |
X |
H |
H |
K |
0.50 |
| 11 |
RM4B |
– |
H |
H |
H |
H |
X |
K |
H |
X |
X |
0.39 |
| RM5599 |
K |
H |
X |
K |
– |
X |
H |
H |
H |
H |
0.50 |
| S21074 |
K |
H |
X |
K |
H |
X |
H |
H |
H |
H |
0.50 |
| RM202 |
K |
H |
X |
H |
– |
X |
H |
H |
H |
H |
0.44 |
| KGS185 |
H |
H |
X |
H |
K |
X |
H |
H |
H |
X |
0.40 |
| RM229 |
H |
H |
X |
H |
K |
X |
– |
H |
H |
H |
0.44 |
| RM5349 |
H |
H |
X |
H |
K |
X |
H |
H |
H |
X |
0.40 |
| RM6440 |
X |
H |
X |
H |
K |
K |
H |
H |
H |
X |
0.45 |
| RM224 |
X |
K |
X |
H |
H |
K |
H |
X |
H |
X |
0.40 |
| 12 |
RM8214 |
H |
X |
X |
X |
H |
X |
H |
X |
H |
H |
0.25 |
| RM6296 |
X |
H |
X |
X |
H |
X |
H |
H |
H |
H |
0.30 |
| RZ869 |
X |
K |
X |
X |
X |
X |
H |
H |
X |
X |
0.20 |
| RM7102 |
X |
K |
H |
H |
X |
X |
H |
H |
X |
H |
0.35 |
| RM1986 |
X |
K |
H |
H |
X |
X |
H |
H |
X |
H |
0.35 |
| L714 |
X |
H |
K |
H |
– |
X |
H |
X |
H |
H |
0.39 |
a X, H, and K respectively denote homozygotes for XM6, heterozygotes, and homozygotes for Koshihikari.
b DNA markers are arranged based on the physical distance from the end of short arm of each chromosome.
c Recombination frequency is calculated as (2N1 + N2)/2N, where N = Total number of plants analyzed (in this case N = 10), N1 = Number of Koshihikari homozygotes and N2 = Number of heterozygotes (Zhang et al. 1994).
Further linkage analysis to narrow down the position of gene xa20 necessitated new markers. Several PCR-based DNA markers were developed following Busungu et al. (2016) as shown in Table 3. Finally, a linkage map was developed using the AntMap software (Iwata and Ninomiya 2006). Map distances were calculated using the Kosambi function (Kosambi 1944).
Table 3.
Primer sequences of DNA markers used to perform linkage analysis of
xa20 gene
| Marker name |
Kind of DNA marker |
Direction |
Primer sequence |
Location on IRGSP 1.0 pseudomolecule chromosome 3 |
Source |
| From (bp) |
To (bp) |
| RM16 |
SSR |
F |
GTGCGCCAGGAGTAGTTGTCTCC |
23,127,621 |
23,127,768 |
Panaud et al. 1996 |
|
|
R |
GACGTGTACACATAGCCAAATCATCC |
|
|
|
| RM3513 |
SSR |
F |
CCAAACATGGCCTTGTAGTAGACG |
25,114,592 |
25,114,796 |
McCouch et al. 2002 |
|
|
R |
CTGTGGCTATGCCTTTGGTTGG |
|
|
|
| RM3436 |
SSR |
F |
AGAGTTGTTAGCATGGCAGCATCC |
27,422,280 |
27,422,442 |
McCouch et al. 2002 |
|
|
R |
CAATTGGCCATTGCAAACATGG |
|
|
|
| RM3525 |
SSR |
F |
ACACTCTCAGCTCATCAAGACC |
30,394,026 |
30,393,888 |
McCouch et al. 2002 |
|
|
R |
GGGCAAGTGGTCAAATCTTG |
|
|
|
| KIC3-33.25 |
INDEL |
F |
TCCTTCTCATCGGAGATGCT |
32,353,790 |
32,354,026 |
This study |
|
|
R |
ACTCTGGTTGCTTCCGCATA |
|
|
|
| KIC3-33.88 |
INDEL |
F |
ATGTTCGCTAAGGACCAGATAGTAG |
33,035,696 |
33,035,951 |
This study |
|
|
R |
TAGTTTATTGGGATTTTGCTCTGCC |
|
|
|
| KIC3-34.06 |
INDEL |
F |
GCATGAACTCACCAACTGATAACTC |
33,210,861 |
33,211,027 |
This study |
|
|
R |
ACTCCTACATGTTTAGCAATTGGTG |
|
|
|
| RM3346 |
SSR |
F |
AAGAACCAGAGCAAGATCGG |
33,324,573 |
33,324,682 |
McCouch et al. 2002 |
|
|
R |
CTTCCAATTCGATCGCTAGC |
|
|
|
| RM1221 |
SSR |
F |
GAGTAGAGAGAGATGGCGGC |
35,676,727 |
35,676,908 |
McCouch et al. 2002 |
|
|
R |
AGGATTAGCAGCGTTAAGCG |
|
|
|
Results
Reaction of plant materials to Xoo
In accordance with earlier studies, XM6 was found to be resistant to the five Japanese Xoo races tested, although IR24 was susceptible (Fig. 1). Lesion length (LL) was used to determine the reaction of a variety to Xoo: shorter LL indicated the variety as resistant; longer LL indicated the variety as susceptible. At 18 days after inoculation, the LL of XM6 was less than 3 cm in the five Japanese Xoo races tested with the highest value (2.4 cm) observed in Race III and the lowest value (0.1 cm) in Race V. The LL of susceptible varieties were the following: IR24 was 12.7–26.8 cm, Koshihikari was 6.8–18.3 cm, IAS16 was 13.6–22.3 cm, whereas IKC3 was 21.6–32.0 cm. These results indicate XM6 as resistant to the Japanese Xoo races tested, whereas IR24, IAS16, and IKC3 are susceptible when compared to a 3 cm threshold value (Table 4).

Table 4.
Reactions in lesion length (cm) of XM6, IR24, Koshihikari, IKC3, and IAS16 after inoculation with five Japanese races of
Xanthomonas oryzae pv.
oryzae
| Rice accessiona |
Lesion lengthb (cm) |
| Race I (Strain T7174) |
Race IIA (Strain T7147) |
Race III (Strain T7133) |
Race IV (Strain H75373) |
Race V (Strain H75304) |
| XM6 (xa20) |
0.2 ± 0.1 |
0.2 ± 0.1 |
2.4 ± 1.9 |
0.8 ± 0.7 |
0.1 ± 0.0 |
| IR24 |
20.4 ± 2.0 |
21.5 ± 2.1 |
26.8 ± 2.0 |
12.7 ± 1.9 |
15.0 ± 2.9 |
| Koshihikari |
10.7 ± 4.4 |
14.6 ± 3.0 |
18.3 ± 4.4 |
6.8 ± 1.5 |
9.7 ± 3.1 |
| IKC3 |
32.0 ± 5.4 |
28.1 ± 6.2 |
29.8 ± 6.9 |
21.6 ± 6.7 |
27.5 ± 3.7 |
| IAS16 |
13.6 ± 3.6 |
22.3 ± 1.1 |
20.6 ± 5.3 |
21.6 ± 2.9 |
20.5 ± 5.1 |
a Genes for resistance are in parentheses.
b Lesion length ± Standard deviation (SD) at 18 days after inoculation.
The F2 population consisting of 298 plants from the cross between Koshihikari and XM6 showed a continuous distribution of LL after inoculation with Xoo race IIA (Fig. 2). However, the F2 population from the cross between IAS16 and XM6 showed a clear bimodal distribution of LL. Using LL of 5 cm as the dividing point, 245 F2 plants were classified into 53 resistant plants with LL of 0.1–4.8 cm and 192 susceptible plants with LL of 7.6–43.1 cm (Fig. 3). The ratio 53:192 fitted 1:3, one-gene segregation (χ2 = 1.482, P = 0.22). We used a ruler to measure the LL of 60 plants out of 299 in the F2 population of the cross between IKC3 and XM6. These were classified into 13 resistant plants with LL of 0.2–1.6 cm and 47 susceptible plants with LL of 7.0–31.5 cm (Fig. 4). The ratio 13:47 fits 1:3, one-gene segregation (χ2 = 0.356, P = 0.56). The remaining 239 plants, which were evaluated based on visual observation, were classified into 50 resistant and 189 susceptible plants. Regarding the total of all the observed 299 plants, the ratio of 63 resistant to 236 susceptible fits one-gene segregation (χ2 = 2.46, P = 0.12).

In the rough mapping of xa20, we used the extreme recessive phenotype linkage analysis method reported by Zhang et al. (1994). Ten F2 plants with the shortest LL (0.1–2.5 cm) were selected from 298 F2 population from a susceptible Japonica variety Koshihikari × XM6. Also, DNA was extracted from each plant. Then genotyping was performed using 108 published DNA markers, which cover the whole rice genome (Table 2). As a principle, when a DNA marker is linked closely to xa20, most of the ten resistant plants should be homozygotes of XM6 allele at that particular DNA marker locus. On chromosome 3, nine plants were homozygous of XM6 allele at the DNA marker loci, RM3525, and RM1221. Moreover, all 10 plants were homozygotes of the XM6 allele at the neighboring DNA marker loci RM3346 on the same chromosome. Fewer than seven plants were homozygotes of XM6 allele at the other loci. These results of whole rice genome scanning for XM6 gene suggest strongly that xa20 is located on the long arm of chromosome 3. Recombination of frequency calculations (Table 2) based on the extreme recessive phenotype proposed by Zhang et al. (1994) also support this inference.
Precise mapping of xa20
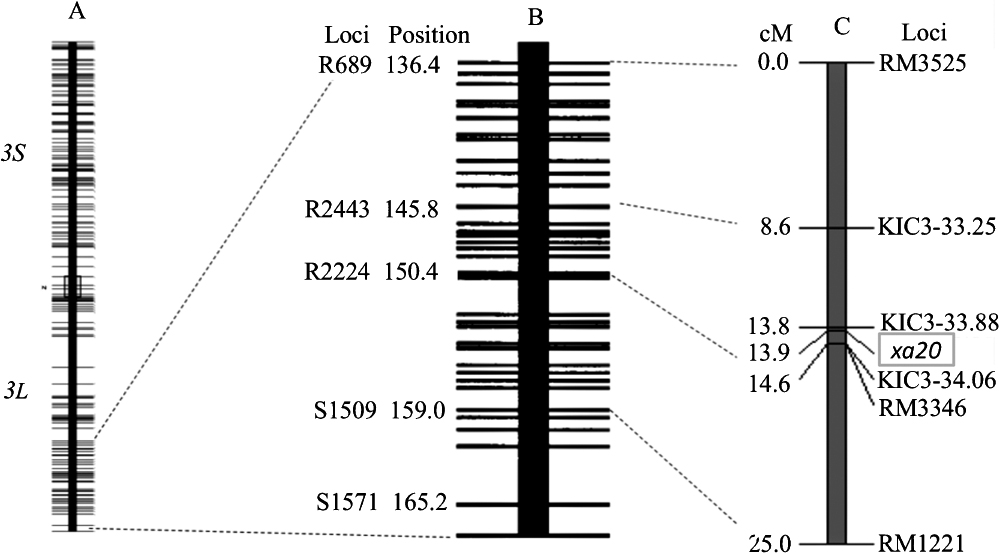
We used the strategy described by Busungu et al. (2016) to minimize the genetic ‘noise’ caused by Indica–Japonica crossing without compromising the usefulness of Indica–Japonica DNA polymorphism. Genetic analysis of the chromosomal fragment of xa20 candidate region was performed in all 245 plants of the F2 population from the cross between IAS16 and XM6. However, upon further narrowing by inside markers KIC3-33.25, KIC3-33.88, and KIC3-34.06, we found that IAS16 does not contain the Asominori fragment on the narrowed down region spanned by KIC3-33.25 and KIC3-33.88, where xa20 was thought to be located (Table 1). We were able to narrow down the position of the gene using the F2 population from the cross between IKC3 and XM6. Almost all resistant plants in this population were found to be homozygotes of XM6 at DNA marker KIC3-33.88 and KIC3-34.06 loci. Table 5 shows genotypes of DNA markers surrounding xa20 locus in the selected informative F2 recombinant plants and the results of their progeny after inoculation with Xoo. At the DNA marker KIC3-33.88 locus, plants 4 and 25 contained the Koshihikari fragment in homozygous form. Their progenies were all susceptible to Xoo. Plants numbered as 5, 6, 7, 8, and 27 were found to have a XM6 fragment in homozygous form at this particular locus. All their progenies were resistant to Xoo. These results suggest that xa20 is located very close to KIC3-33.88. Plant number 28 corresponds to a homozygote of XM6 allele with the LL of 20 cm in Fig. 4. A recombination event occurred between KIC3-33.88 and KIC3-34.06 loci. The heterozygous form at KIC3-34.06 locus corresponded to the segregation observed in its progeny. Collectively, xa20 is thought to be located close to KIC3-33.88, flanked by this locus and KIC3-34.06. In fact, results from other plants in Table 5 support this inference. F2 plants from the cross between IKC3 and XM6 were clearly classified into resistant homozygous plants of xa20 allele and susceptible plants of other different genotypes by taking 2 cm as the dividing point. Based on this classification, a linkage map around xa20 was constructed as presented in Fig. 5. The linkage map was compared side-to-side with a restriction fragment length polymorphism (RFLP) marker-based high-density linkage map (Harushima et al. 1998), in which some markers have been sequenced. Based on the Nipponbare genome sequence (Os-Nipponbare-Reference-IRGSP-1.0) (Kawahara et al. 2013), DNA markers located near each other on Nipponbare pseudomolecules are connected with dotted lines. xa20 is located on the distal end of the long arm of chromosome 3 flanked by DNA markers KIC3-33.88 and KIC3-34.06.
Table 5.
Reaction to
Xoo Japanese Race IIA (T7147) and Genotypes of informative recombinants for the DNA marker loci linked with
XA20 on chromosome 3 in the F
2 population (IKC3 × XM6), and gene segregation in the F
3 generation
| F2 Plant No. |
Phenotypea |
Genotypes of the DNA marker locib |
Segregation in F3 Plantsc |
| RM3525 |
KIC3-33.25 |
KIC3-33.88 |
KIC3-34.06 |
RM3346 |
RM1221 |
R |
S |
Total |
| 1 |
S |
H |
H |
H |
K |
K |
K |
6 |
19 |
25 |
| 2 |
S |
H |
H |
H |
K |
K |
K |
5 |
20 |
25 |
| 3 |
S |
H |
H |
H |
K |
K |
X |
6 |
19 |
25 |
| 4 |
S |
H |
H |
K |
K |
K |
K |
0 |
25 |
25 |
| 5 |
R |
H |
H |
X |
X |
X |
H |
25 |
0 |
25 |
| 6 |
R |
H |
H |
X |
X |
X |
X |
25 |
0 |
25 |
| 7 |
R |
H |
H |
X |
X |
X |
X |
25 |
0 |
25 |
| 8 |
R |
H |
H |
X |
X |
X |
X |
25 |
0 |
25 |
| 9 |
S |
K |
K |
H |
H |
H |
H |
3 |
22 |
25 |
| 10 |
S |
K |
K |
H |
H |
H |
H |
5 |
20 |
25 |
| 11 |
S |
K |
K |
H |
H |
H |
H |
5 |
20 |
25 |
| 12 |
S |
K |
K |
H |
H |
H |
H |
11 |
14 |
25 |
| 13 |
S |
K |
K |
H |
H |
H |
X |
6 |
19 |
25 |
| 14 |
S |
K |
K |
H |
H |
H |
H |
4 |
21 |
25 |
| 15 |
S |
K |
K |
H |
H |
H |
X |
4 |
21 |
25 |
| 16 |
S |
K |
K |
H |
H |
H |
H |
5 |
20 |
25 |
| 17 |
S |
K |
K |
H |
H |
H |
H |
7 |
18 |
25 |
| 18 |
S |
X |
X |
H |
H |
H |
H |
11 |
14 |
25 |
| 19 |
S |
X |
X |
H |
H |
H |
H |
4 |
21 |
25 |
| 20 |
S |
X |
X |
H |
H |
H |
H |
5 |
20 |
25 |
| 21 |
S |
X |
X |
H |
H |
H |
H |
2 |
23 |
25 |
| 22 |
S |
X |
X |
H |
H |
H |
H |
7 |
18 |
25 |
| 23 |
S |
X |
X |
H |
H |
H |
H |
7 |
18 |
25 |
| 24 |
S |
X |
X |
H |
H |
H |
K |
8 |
17 |
25 |
| 25 |
S |
X |
X |
K |
K |
K |
K |
0 |
25 |
25 |
| 26 |
S |
X |
X |
H |
H |
H |
H |
7 |
18 |
25 |
| 27 |
R |
X |
X |
X |
H |
H |
H |
25 |
0 |
25 |
| 28 |
S |
X |
X |
X |
H |
H |
K |
12 |
13 |
25 |
a Scoring of LL of F2 lines from the cross between XM6 and IKC3 was based on visual observation: LL shorter than 2 cm are regarded as resistant ‘R’; those longer are regarded as susceptible ‘S’.
b X, H, and K respectively denote homozygotes for XM6, heterozygotes, and homozygotes for IKC3.
c LL were recorded 18 days after inoculation with Xoo race IIA 8T7147): LL shorter than 2 cm are regarded as resistant ‘R’; those longer than that are regarded as susceptible ‘S’.
Discussion
This study mapped the earlier identified gene xa20 from XM6 within 0.8 cM region on the long arm of chromosome 3 (Fig. 5). xa20 marks a third gene to be located on chromosome 3. Others include Xa11, which is also located on the long arm, and xa42, which is located around the centromeric region (Busungu et al. 2016, 2018, Goto et al. 2009). Although both Xa11 and xa20 are located on the long arm of chromosome 3, they are distinct genes. Actually, Xa11 is a dominant gene flanked by markers RM347 (26.7 Mb region) and RM1350 (28.7 Mb). In contrast, xa20 is a recessive gene flanked by DNA markers KIC3-33.88 (33.0 Mb) and marker KIC3-34.06 (33.2 Mb). Furthermore, although xa20 is resistant to five races of Japanese Xoo tested (Fig. 1, Table 4), Xa11 is resistant to races: IB, II, IIIA, and V only (Goto et al. 2009, Taura et al. 1992a). Therefore, one can safely infer that xa20 is differs from Xa11 and xa42.
Among 46 identified genes of resistance (Xa/xa), 18 are recessive (Neelam et al. 2020). The molecular mechanisms of four recessive resistance genes; xa5, xa13, xa25, and xa41 have been properly elucidated. Xoo uses Transcription Activator-Like Effectors (TALEs) to bind onto specific DNA sequences named effector binding elements (EBEs), in the promoter regions of susceptibility genes. When TALE binds to EBE located in the promoter region of each DNA strand, it bidirectionally drives expression of host target genes, which enhances the virulence of Xoo. However, when spontaneous or artificial mutation occurs to thwart the TALE-EBE compatibility, a plant becomes resistant to the Xoo strain that relies on such compatibility for its virulence (Hutin et al. 2015a, 2015b, Xu et al. 2019). These mutations effectively confer resistance against Xoo by eliminating cognate TALE binding sites. This resistance mechanism is typically exhibited by xa13, xa25, and xa41 (Jiang et al. 2020). By contrast, xa5 exhibits an entirely different mechanism by encoding a mutated small subunit of the basal transcription factor IIA (TFIIAγ5) (Iyer and McCouch 2004). The mutated protein has high binding activity to a particular avirulence gene named avrxa5 and consequently initiates the transcription of some specific defense response genes, which results in rapid cell death and resistance (Jiang et al. 2006).
The Rice Annotation Project Database (https://rapdb.dna.affrc.go.jp/) (Sakai et al. 2013) predicts 34 genes in the candidate region for xa20. Nevertheless, no homolog of the cloned Xoo resistance gene has been identified there or in the Rice Genome Annotation Project (http://rice.plantbiology.msu.edu/) (Ouyang et al. 2007). Therefore, the resistance mechanism conferred by xa20 might be a new one. This situation holds true for xa42, another recessive Xoo resistance gene of our interest (Busungu et al. 2018). These facts suggest that mutations induced by N-methyl-N-nitrosourea are a credible source of novel resistance mechanism(s) against Xoo. Once the recessive resistance genes xa20 and xa42 are identified at the molecular level, application of a gene editing technology such as CRISPR-Cas9 might induce a recessive resistant allele at the respective loci without disturbing the genetic background (Eom et al. 2019, Oliva et al. 2019, Xu et al. 2019).
In fact, results show LL of XM6 to be less than 3 cm in five races of Japanese Xoo tested, which signifies its resistance (Fig. 1, Table 4). Taura et al. (1991a, 1992a) reported the XM6 line as resistant against the six Philippine Xoo races tested. Taken together, these results suggest that xa20 is a broad-spectrum resistance gene. Such an effective gene is important for producing pyramided lines with multiple resistance genes. It is possible that xa20 can significantly slow resistance breakdown when used concomitantly in pyramided lines with other broad-spectrum resistance genes.
Generally, the distribution of the LL graph for plant materials containing single recessive resistance gene should demonstrate a clear dividing point between plants showing resistance and susceptible phenotypes. Nevertheless, no clear point of division was observed for the F2 population resulting from the cross between Koshihikari and XM6 (Fig. 2), unlike what was observed in the F2 population derived from IAS16 × XM6 (Fig. 3) and IKC3 × XM6 in Fig. 4. Actually, Koshihikari and XM6 respectively represent Japonica and Indica genetic backgrounds. The difference in their individual genetic composition engenders the marked variation in their agronomic traits such as the tiller number and plant height. It is possible that the observed distribution of LL is the result of the Japonica–Indica genetic difference. In fact, it was similarly observed in the cross between Koshihikari and XM14 (Busungu et al. 2016). Nonetheless, homozygotes of XM6 at DNA marker loci closer to xa20 were skewed towards shorter LL, including the ten plants selected for rough mapping of xa20. In the F2 population of the cross between IAS16 and XM6 (Fig. 3) homozygotes of XM6 on the DNA marker RM3346 were strongly skewed toward short LL. Heterozygotes and homozygotes of IAS16 were skewed strongly toward long LL. These results confirmed the initial mapping of xa20 using the cross between Koshihikari and XM6. The frequency distribution of LL of the F2 population of IKC3 × XM6 separated by the genotype of DNA marker KIC3-33.88 is presented in Fig. 4. Homozygotes of XM6 were skewed strongly towards short LL whereas heterozygotes and homozygotes of IKC3 were skewed towards long LL. These results indicate that xa20 is closely linked with DNA marker KIC3-33.88.
Our mapping strategy required the combination of rough linkage analysis using extreme recessive phenotype using Indica–Japonica cross and precise linkage analysis using backcross recombinant-inbred lines (BRILs). This process effectively mapped recessive mutant resistance gene in XM6, but it took a long time and involved the creation of several lines (Results). In fact, this limitation can be addressed using a recently developed method called MutMap (Al Amin et al. 2019, Tribhuvan et al. 2018, Wang et al. 2018). In this method, causal SNPs are identified by pooling and resequencing whole-genome DNA from a segregating population of plants that show a useful phenotype. Then they are compared to parental DNA. In this regard, the number of genetic crosses (n = 1 or 0) and the required mutant F2 progeny are minimized (Abe et al. 2012). MutMap can be regarded as an effective and economic method in terms of cutting back on the time and labor needed for identification of mutant loci and gene mapping. We were unable to use the method because it was still very new at the initiation of our study in 2014. However, it could be applied to map other previously identified Xoo resistance genes in mutant lines with IR24 background such as XM5 (Taura et al. 1991b). Information about chromosome location and molecular markers linked to xa20 is useful in breeding for BB resistance including gene pyramiding. Our results support the fine mapping and cloning of xa20.
Author Contribution Statement
J.A.M., K.I., and S.T designed the study. J.A.M., Y.K., and S.T. performed experiments. J.A.M. prepared the manuscript. K.I. and S.T. edited the manuscript.
Acknowledgments
The authors gratefully acknowledge Dr. Atsushi Yoshimura of Kyushu University for kind provision of IAS lines. This research was funded by JSPS KAKENHI Grant Number JP19H02934 from the Japan Society for the Promotion of Science.
Literature Cited
- Abe, A., S. Kosugi, K. Yoshida, S. Natsume, H. Takagi, H. Kanzaki, H. Matsumura, K. Yoshida, C. Mitsuoka, M. Tamiru et al. (2012) Genome sequencing reveals agronomically important loci in rice using MutMap. Nat. Biotechnol. 30: 174–179.
- Al Amin, G.M., K. Kong, R.A. Sharmin, J. Kong, J.A. Bhat and T. Zhao (2019) Characterization and rapid gene-mapping of leaf lesion mimic phenotype of spl-1 mutant in soybean (Glycine max (L.) Merr.). Int. J. Mol. Sci. 20: 2193.
- Busungu, C., S. Taura, J. Sakagami and K. Ichitani (2016) Identification and linkage analysis of a new rice bacterial blight resistance gene from XM14, a mutant line from IR24. Breed. Sci. 66: 636–645.
- Busungu, C., S. Taura, J. Sakagami, T. Anai and K. Ichitani (2018) High-resolution mapping and characterization of xa42, a resistance gene against multiple Xanthomonas oryzae pv. oryzae races in rice (Oryza sativa L.). Breed. Sci. 68: 188–199.
- Chen, S., C. Wang, J. Yang, B. Chen, W. Wang, J. Su, A. Feng, L. Zeng and X. Zhu (2020) Identification of the novel bacterial blight resistance gene Xa46(t) by mapping and expression analysis of the rice mutant H120. Sci. Rep. 10: 12642.
- Chen, X., S. Temnykh, Y. Xu, Y.G. Cho and S.R. McCouch (1997) Development of a microsatellite framework map providing genome-wide coverage in rice (Oryza sativa L.). Theor. Appl. Genet. 95: 553–567.
- Chithrashree, A.C. Udayashankar, S.C. Nayaka, M.S. Reddy and C. Srinivas (2011) Plant growth-promoting rhizobacteria mediate induced systemic resistance in rice against bacterial leaf blight caused by Xanthomonas oryzae pv. oryzae. Biol. Control. 59: 114–122.
- Chukwu, S.C., M.Y. Rafii, S.I. Ramlee, S.I. Ismail, M.M. Hasan, Y.A. Oladosu, U.G. Magaji, I. Akos and K.K. Olalekan (2019) Bacterial leaf blight resistance in rice: a review of conventional breeding to molecular approach. Mol. Biol. Rep. 46: 1519–1532.
- Dellaporta, S.L., J. Wood and J.B. Hicks (1983) A plant DNA minipreparation: Version II. Plant Mol. Biol. Rep. 1: 19–21.
- Deng, W.L., H.A. Lin, Y.C. Shih, C.C. Kuo, J.Y. Tzeng, L.Y.D. Liu, S.T. Huang, C.M. Huang and C.L. Chung (2016) Genotypic and pathotypic diversity of Xanthomonas oryzae pv. oryzae strains in Taiwan. J. Phytopathol. 164: 745–759.
- Eom, J.S., D. Luo, G. Atienza-Grande, J. Yang, C. Ji, V.T. Luu, J.C. Huguet-Tapia, S.N. Char, B. Liu, H. Nguyen et al. (2019) Diagnostic kit for rice blight resistance. Nat. Biotechnol. 37: 1372–1379.
- Goto, T., T. Matsumoto, N. Furuya, K. Tsuchiya and A. Yoshimura (2009) Mapping of bacterial blight resistance gene Xa11 on rice chromosome 3. Jpn. Agric. Res. Q. 43: 221–225.
- Harushima, Y., M. Yano, A. Shomura, M. Sato, T. Shimano, Y. Kuboki, T. Yamamoto, S. Lin, B.A. Antonio, A. Parco et al. (1998) A high-density rice genetic linkage map with 2275 markers using a single F2 population. Genetics 148: 479–494.
- Horino, O., T.W. Mew and T. Yamada (1982) The effect of temperature on the development of bacterial leaf blight on rice. Ann. Phytopathol. Soc. Jpn. 48: 72–75.
- Hutin, M., A.L. Pérez-Quintero, C. Lopez and B. Szurek (2015a) MorTAL Kombat: the story of defense against TAL effectors through loss-of-susceptibility. Front. Plant Sci. 6: 535.
- Hutin, M., F. Sabot, A. Ghesquière, R. Koebnik and B. Szurek (2015b) A knowledge-based molecular screen uncovers a broad-spectrum OsSWEET14 resistance allele to bacterial blight from wild rice. Plant J. 84: 694–703.
- Ichitani, K., S. Taura, T. Tezuka, Y. Okiyama and T. Kuboyama (2011) Chromosomal location of HWA1 and HWA2, complementary hybrid weakness genes in rice. Rice (N Y) 4: 29–38.
- International Rice Genome Sequencing Project (2005) The map-based sequence of the rice genome. Nature 436: 793–800.
- Iwata, H. and S. Ninomiya (2006) AntMap: Constructing genetic linkage maps using an ant colony optimization algorithm. Breed. Sci. 56: 371–377.
- Iyer, A.S. and S.R. McCouch (2004) The rice bacterial blight resistance gene xa5 encodes a novel form of disease resistance. Mol. Plant Microbe Interact. 17: 1348–1354.
- Jiang, G.H., Z.H. Xia, Y.L. Zhou, J. Wan, D.Y. Li, R.S. Chen, W.X. Zhai and L.H. Zhu (2006) Testifying the rice bacterial blight resistance gene xa5 by genetic complementation and further analyzing xa5 (Xa5) in comparison with its homolog TFIIAγ1. Mol. Genet. Genomics 275: 354–366.
- Jiang, N., J. Yang, Y. Liang, Y. Shi, Z. He, Y. Wu, Q. Zeng, X. Liu and J. Peng (2020) Resistance genes and their interactions with bacterial blight/leaf streak pathogens (Xanthomonas oryzae) in rice (Oryza sativa L.)—an updated Review. Rice (N Y) 13: 3.
- Kaku, H. and T. Kimura (1989) Qualitative resistance reaction of rice cultivar Asominori to certain race II strains of Xanthomonas campestris pv. oryzae. Ann. Phytopathol. Soc. Jpn. 55: 657–659.
- Kauffman, H.E., A.P.K. Reddy, S.P.Y. Hsieh and S.D. Merca (1973) An improved technique for evaluating resistance of rice varieties to Xanthomonas oryzae. Plant Dis. Rep. 57: 537–541.
- Kawahara, Y., M. de la Bastide, J.P. Hamilton, H. Kanamori, W.R. McCombie, S. Ouyang, D.C. Schwartz, T. Tanaka, J. Wu, S. Zhou et al. (2013) Improvement of the Oryza sativa Nipponbare reference genome using next generation sequence and optical map data. Rice (N Y) 6: 4.
- Khan, M., A. Rafi, A. Abbas, T. Ali and A. Hassan (2015) Assessment of yield lossess caused by bacterial blight of rice in upper Dir, Khyber Pakhtunkhwa province. Asian J. Agric. Biol. 3: 74–78.
- Kim, S.M. (2018) Identification of novel recessive gene xa44(t) conferring resistance to bacterial blight races in rice by QTL linkage analysis using an SNP chip. Theor. Appl. Genet. 131: 2733–2743.
- Kim, S.M. and R.F. Reinke (2019) A novel resistance gene for bacterial blight in rice, Xa43(t) identified by GWAS, confirmed by QTL mapping using a bi-parental population. PLoS ONE 14: e0211775.
- Kosambi, D.D. (1944) The estimation of map distances from recombination values. Ann. Eugen. 12: 172–175.
- Kubo, T., Y. Aida, K. Nakamura, H. Tsunematsu, K. Doi and A. Yoshimura (2002) Reciprocal chromosome segment substitution series derived from Japonica and Indica cross of rice (Oryza sativa L.). Breed. Sci. 52: 319–325.
- Lore, J.S., Y. Vikal, M.S. Hunjan, R.K. Goel, T.S. Bharaj and G.L. Raina (2011) Genotypic and pathotypic diversity of Xanthomonas oryzae pv. oryzae, the cause of bacterial blight of rice in Punjab State of India. J. Phytopathol. 159: 479–487.
- McCouch, S.R., L. Teytelman, Y. Xu, K.B. Lobos, K. Clare, M. Walton, B. Fu, R. Maghirang, Z. Li, Y. Xing et al. (2002) Development and mapping of 2240 new SSR markers for rice (Oryza sativa L.). DNA Res. 9: 199–207.
- Mew, T.W. (1987) Current status and future prospects of research on bacterial blight of rice. Ann. Rev. Phytopathol. 25: 359–382.
- Mew, T.W., A.M. Alvarez, J.E. Leach and J. Swings (1993) Focus on bacterial blight of rice. Plant Dis. 77: 5–12.
- Monna, L., R. Ohta, H. Masuda, A. Koike and Y. Minobe (2006) Genome-wide searching of single-nucleotide polymorphisms among eight distantly and closely related rice cultivars (Oryza sativa L.) and a wild accession (Oryza rufipogon Griff.). DNA Res. 13: 43–51.
- Neelam, K., R. Mahajan, V. Gupta, D. Bhatia, B.K. Gill, R. Komal, J.S. Lore, G.S. Mangat and K. Singh (2020) High-resolution genetic mapping of a novel bacterial blight resistance gene xa-45(t) identified from Oryza glaberrima and transferred to Oryza sativa. Theor. Appl. Genet. 133: 689–705.
- Noda, T. and A. Ohuchi (1989) A new pathogenic race of Xanthomonas campestris pv. oryzae and inheritance of resistance of differential rice variety, Te-tep to it. Ann. Phytopathol. Soc. Jpn. 55: 201–207.
- Ogawa, T. and T. Yamamoto (1987) Reaction of rice cultivars resistant to Japanese and Philippine races of Xanthomonas campestris pv. oryzae. Jpn. Agric. Res. Q. 21: 138–145.
- Ogawa, T. and G.S. Khush (1989) Major genes for resistance to bacteria blight in rice. In: Bacterial blight of rice, International Rice Research Institute, Manila, pp. 178–192.
- Oliva, R., C. Ji, G. Atienza-Grande, J.C. Huguet-Tapia, A. Perez-Quintero, T. Li, J.S. Eom, C. Li, H. Nguyen, B. Liu et al. (2019) Broad-spectrum resistance to bacterial blight in rice using genome editing. Nat. Biotechnol. 37: 1344–1350.
- Ou, S.H. (1985) Bacterial leaf blight. In: Rice Disease. Commonwealth Mycological Institute, Kew, Surrey, England, pp. 61–96.
- Ouyang, S., W. Zhu, J. Hamilton, H. Lin, M. Campbell, K. Childs, F. Thibaud-Nissen, R.L. Malek, Y. Lee, L. Zheng et al. (2007) The TIGR Rice Genome Annotation Resource: improvements and new features. Nucleic Acids Res. 35 Database Issue: D883–887.
- Panaud, O., X. Chen and S.R. McCouch (1996) Development of microsatellite markers and characterization of simple sequence length polymorphism (SSLP) in rice (Oryza sativa L.). Mol. Gen. Genet. 252: 597–607.
- Reddy, P.R. (1997) Quantification of the effects of bacterial blight disease on rice crop growth and grain yield. In: Kropff, M.J., P. Teng, P.K. Aggarwal, J. Bouma, B.A.M. Bouman, J.W. Jones and H.H. Van Laar (eds.) Applications of systems approaches at the field level. Proceed. Sec. Int. Symp. Systems approaches for sustainable agricultural development vol. 2, Springer – Science+Business Media, B.V., pp. 339–348.
- Sakai, H., S.S. Lee, T. Tanaka, H. Numa, J. Kim, Y. Kawahara, H. Wakimoto, C.C. Yang, M. Iwamoto, T. Abe et al. (2013) Rice Annotation Project Database (RAP-DB): an integrative and interactive database for rice genomics. Plant Cell Physiol. 54: e6.
- Séré, Y., A. Onasanya, V. Verdier, K. Akator, L.S. Ouédraogo, Z. Segda, M.M. Mbare, A.Y. Sido and A. Basso (2005) Rice bacterial leaf blight in West Africa: Preliminary studies on disease in farmers’ fields and screening released varieties for resistance to the bacteria. Asian J. Plant Sci. 4: 577–579.
- Shaheen, R., M.Z. Sharif, L. Amrao, A. Zheng, M. Manzoor, D. Majeed, H. Kiran, M. Jafir and A. Ali (2019) Investigation of bacterial leaf blight of rice through various detection tools and its impact on crop yield in Punjab, Pakistan. Pak. J. Bot. 51: 307–312.
- Shen, Y.J., H. Jiang, J.P. Jin, Z.B. Zhang, B. Xi, Y.Y. He, G. Wang, C. Wang, L. Qian, X. Li et al. (2004) Development of genome-wide DNA polymorphism database for map-based cloning of rice genes. Plant Physiol. 135: 1198–1205.
- Shi, L., P. Li, W. Wang, M. Gao, Z. Wu, X. Song and D. Hu (2015) Antibacterial activity and mechanism of action of sulfone derivatives containing 1,3,4-oxadiazole moieties on rice bacterial leaf blight. Molecules 20: 11660–11675.
- Taura, S., T. Ogawa, A. Yoshimura and T. Omura (1991a) Induction of mutants resistant to bacterial blight in rice. Japan. J. Breed. 41: 279–288.
- Taura, S., T. Ogawa, A. Yoshimura, R. Ikeda and T. Omura (1991b) Identification of a recessive resistance gene in induced mutant line XM5 of rice to rice bacterial blight. Japan. J. Breed. 41:427–432.
- Taura, S., T. Ogawa, A. Yoshimura, R. Ikeda and N. Iwata (1992a) Identification of a recessive resistance gene to rice bacterial blight of mutant line XM6, Oryzae sativa L. Japan. J. Breed. 42: 7–13.
- Taura, S., T. Ogawa, R.E. Tabien, G.S. Khush, A. Yoshimura and T. Omura (1992b) Resistance genes of rice cultivar, Taichung Native 1 to Philippine races of bacterial blight pathogens. Japan. J. Breed. 42: 195–201.
- Temnykh, S., W.D. Park, N.M. Ayres, S. Cartinhour, N. Hauck, L. Lipovich, Y.G. Cho, T. Ishii and S.R. McCouch (2000) Mapping and genome organization of microsatellite sequences in rice (Oryza sativa L.). Theor. Appl. Genet. 100: 697–712.
- Toyomoto, D., M. Uemura, S. Taura, T. Sato, R. Henry, R. Ishikawa and K. Ichitani (2019) Segregation distortion observed in the progeny of crosses between Oryza sativa and O. meridionalis caused by abortion during seed development. Plants (Basel) 8: 398.
- Tribhuvan, K.U., Sandhya, K. Kumar, A.M. Sevanthi and K. Gaikwad (2018) MutMap: a versatile tool for identification of mutant loci and mapping of genes. Ind. J. Plant Physiol. 23: 612–621.
- Wakimoto, S. (1954) Biological and physiological properties of Xanthomonas oryzae phage. Sci. Bull. Fac. Agric., Kyushu Univ. 14: 485–493 (in Japanese with English summary).
- Wang, H., Y. Zhang, L. Sun, P. Xu, R. Tu, S. Meng, W. Wu, G.B. Anis, K. Hussain, A. Riaz et al. (2018) WB1, a regulator of endosperm development in rice, is identified by a modified MutMap method. Int. J. Mol. Sci. 19: 2159.
- Xu, Y., X. Zhu, M. Zhou, J. Kuang, Y. Zhang, Y. Shang and J. Wang (2010) Status of streptomycin resistance development in Xanthomonas oryzae pv. oryzae and Xanthomonas oryzae pv. oryzicola in China and their resistance characters. J. Phytopathol. 158: 601–608.
- Xu, Z., X. Xu, Q. Gong, Z. Li, Y. Li, S. Wang, Y. Yang, W. Ma, L. Liu, B. Zhu et al. (2019) Engineering broad-spectrum bacterial blight resistance by simultaneously disrupting variable TALE-binding elements of multiple susceptibility genes in rice. Mol. Plant 12: 1434–1446.
- Yu, X., C.M. Armstrong, M. Zhou and Y. Duan (2016) Bismerthiazol inhibits Xanthomonas citri subsp. citri growth and induces differential expression of citrus defense-related genes. Phytopathology 106: 693–701.
- Yugander, A., R.M. Sundaram, D. Ladhalakshmi, S.K. Hajira, V. Prakasam, M.S. Prasad, M.S. Madhav, V.R. Babu and G.S. Laha (2017) Virulence profiling of Xanthomonas oryzae pv. oryzae isolates, causing bacterial blight of rice in India. Eur. J. Plant Pathol. 149: 171–191.
- Zhang, Q., B.Z. Shen, X.K. Dai, M.H. Mei, M.A. Saghai Maroof and Z.B. Li (1994) Using bulked extremes and recessive class to map genes for photoperiod-sensitive genic male sterility in rice. Proc. Natl. Acad. Sci. USA 91: 8675–8679.
- Zhu, X.F., Y. Xu, D. Peng, Y. Zhang, T.T. Huang, J.X. Wang and M.G. Zhou (2013) Detection and characterization of bismerthiazol-resistance of Xanthomonas oryzae pv. oryzae. Crop Prot. 47: 24–29.


