Abstract
Genome sequence analysis in higher plants began with the whole-genome sequencing of Arabidopsis thaliana. Owing to the great advances in sequencing technologies, also known as next-generation sequencing (NGS) technologies, genomes of more than 400 plant species have been sequenced to date. Long-read sequencing technologies, together with sequence scaffolding methods, have enabled the synthesis of chromosome-level de novo genome sequence assemblies, which has further allowed comparative analysis of the structural features of multiple plant genomes, thus elucidating the evolutionary history of plants. However, the quality of the assembled chromosome-level sequences varies among plant species. In this review, we summarize the status of chromosome-level assemblies of 114 plant species, with genome sizes ranging from 125 Mb to 16.9 Gb. While the average genome coverage of the assembled sequences reached up to 89.1%, the average coverage of chromosome-level pseudomolecules was 73.3%. Thus, further improvements in sequencing technologies and scaffolding, and data analysis methods, are required to establish gap-free telomere-to-telomere genome sequence assemblies. With the forthcoming new technologies, we are going to enter into a new genomics era where pan-genomics and the >1,000 or >1 million genomes’ project will be routine in higher plants.
Introduction
Arabidopsis thaliana is the first plant species to be sequenced (The Arabidopsis Genome Initiative 2000), making the genome sequence information a gold standard for plant genomics research. Subsequently, draft genome sequences of rice (Oryza sativa) were released (Goff et al. 2002, Yu et al. 2002), followed by map-based sequencing of a rice variety, ‘Nipponbare’ (International Rice Genome Sequencing Project 2005). The genomes of Arabidopsis and rice were then used as models for dicot and monocot species, respectively (Rensink and Buell 2004). Moreover, the rice genome sequence provides important information that could be utilized in breeding programs, especially those focusing on cereal crops (Paterson et al. 2005). Owing to next-generation sequencing (NGS) technologies, genomes of 50 plant species were sequenced and made publicly available by 2013 (Michael and Jackson 2013); this number has increased to 100 plant species as of 2020 (Michael and VanBuren 2020). Plant genome sequence-related information has been summarized in several genome databases, such as plaBiPD (https://www.plabipd.de), CoGepedia (https://genomevolution.org/coge), Ensembl Plants (https://plants.ensembl.org/index.html), Phytozome (https://phytozome.jgi.doe.gov/pz/portal.html), and Plant GARDEN (https://plantgarden.jp/en/index). Although the availability of chromosome-level pseudomolecule sequences was limited about a decade ago, long-read sequencing technologies and new scaffolding techniques have made it possible to easily establish chromosome-level de novo genome assemblies of many plant species.
Here, we summarize the progress in plant genome sequence analysis, along with the advances in DNA sequencing technologies. Since details of individual genome sequences and their applications have been summarized in a collection of research articles and reviews, such as the Compendium of Plant Genomes (Kole 2014-contd.; https://www.springer.com/series/11805), we mainly focus on the status of chromosome-level genome assemblies in this review.
DNA sequencing technologies
The first attempt to sequence genetic material was accomplished by Sanger and colleagues (Sanger et al. 1977) and by Maxam and Gilbert (Maxam and Gilbert 1977). Sanger established a dideoxynucleotide chain-termination method for DNA sequencing, while Maxam and Gilbert developed a chemical digestion-based technology for sequencing. Subsequently, the Sanger method was greatly improved using fluorescent dyes (Smith et al. 1986) and capillary electrophoresis (Durney et al. 2015), instead of radioisotopes and polyacrylamide gel electrophoresis. These improvements contributed to the automation of DNA sequencing (Martin et al. 1985); however, it was difficult to achieve high-throughput DNA sequencing because of the need for electrophoresis of each DNA molecule in a given sample, as well as the cost of sequencing.
NGS technologies enabled massively parallel DNA sequencing in a cost-effective manner, leading to large amounts of data in a single experiment (Goodwin et al. 2016). New NGS techniques, such as pyrosequencing (Nyrén et al. 1993), sequencing-by-ligation (Thermo Fisher Scientific, Waltham, MA, USA), and sequencing-by-synthesis (Illumina, San Diego, CA, USA), were developed and implemented in DNA sequencers distributed by Roche (Basel, Switzerland), Illumina, and Thermo Fisher Scientific, respectively. Among these NGS technologies, sequencing-by-synthesis gained popularity for genome sequencing because of its low cost input and highly accurate data generation (Korostin et al. 2020), despite the shorter read length (≤300 bp) compared with other methods (~1 kb). The sequencing-by-synthesis technique generates a large number of sequence reads from DNA fragments amplified by bridge PCR in spots on the surface of flow cells (Illumina) or from DNA nanoballs generated by linear rolling circle amplification (MGI Tech, Shenzhen, China). Linked-reads, a sequencing technology available from 10X Genomics (Pleasanton, CA, USA), was one of the methods used to generate long-read sequence data. In this method, a long DNA molecule is digested into short fragments and sequenced by the sequencing-by-synthesis short-read method. The short reads are then assembled in silico into a long-read sequence, representing the original long DNA sequence (Zheng et al. 2016).
Long-read sequencing technologies overcame the technical limitation of short-read sequencing (~1 kb), a characteristic feature of NGS technologies. Pacific Bioscience (PacBio, Menlo Park, CA, USA) generates long-read sequences, ranging from 10 to 100 kb, from a single DNA molecule using a DNA polymerase fixed to the bottom of reaction wells (Eid et al. 2009). Alternatively, Oxford Nanopore Technologies (Oxford, UK) utilizes current blockage, which occurs when single DNA molecules pass through channels on a membrane, thus generating nucleotide sequences (Kasianowicz et al. 1996). The accuracy of a single long-read sequence is not as high as that of multiple short reads; however, the error-prone long reads allow spanning repetitive sequences, frequently detected in plant genomes, to obtain long contiguous sequences (Koren and Phillippy 2015). Since sequencing errors that occur during long-read sequencing are random rather than systematic, these errors can be corrected by sequencing single molecules multiple times to generate high-fidelity long reads (Wenger et al. 2019); reads obtained using this method are known as HiFi reads of PacBio.
Sequence extension technologies
Despite the development of long-read sequencing technologies, determining the nucleotide sequence of super-long DNA molecules (≥100 kb) in a single reaction is challenging. In contrast to sequencing methods, optical mapping technologies generate a physical map of enzyme recognition sites in a long DNA fragment (Zheng et al. 2016). For example, the BioNano technology (Bionano Genomics, San Diego, CA, USA) generates a fingerprint of nickase recognition sites in long DNA molecules labeled with fluorescent dyes, and the physical distances of dye intervals are measured on nanochannel arrays (Yuan et al. 2020). This information is merged with the assembled sequences to extend DNA contiguity and simultaneously validate the assembly accuracy.
The Hi-C technology, which is commercially available from Dovetail Genomics (Scotts Valley, CA, USA) and Phase Genomics (Seattle, WA, USA), is based on chromosome conformation capture. The Hi-C method provides information on chromatin interactions (Lieberman-Aiden et al. 2009). It is expected that individual chromosomes remain physically separate in nuclei, and DNA–DNA interactions are more frequent between adjacent regions on the same chromosome than between chromosomes. Contact maps, based on interaction frequencies between any two genomic regions, are used to group, order, and orient contig sequences to generate chromosome-level assemblies (Dudchenko et al. 2017).
Haplotype-phased genome assembly
The size of a genome assembly generally corresponds to the haploid genome size of the target plant species. In all plant species, including allogamous species with a heterozygous genome, an integrated genome sequence, also known as a reference genome sequence, is usually generated from two haploid sequences. This explains why chromosome-level assemblies are known as pseudomolecule sequences. To overcome this limitation, genome assemblers have been developed for diploids to generate long-read data (Chin et al. 2016). The resultant contigs comprise two sets of sequences, primary contigs and haplotigs, which represent two haplotype sequences of diploids (Chin et al. 2016). Since one sequence does not always arise from one haploid genome, the concerned sequence might be a chimera of the two haploid sequences, which occurs due to a phenomenon known as haplotype switching. To avoid this problem, Hi-C data are employed to correct the mis-haplotype phasing and to extend the contig sequences along one haploid genome (https://github.com/phasegenomics/FALCON-Phase).
Another strategy for haplotype-phased assembly is trio binning (Koren et al. 2018). Sequence reads obtained from the target individual are separated into two groups, in accordance with the sequence information of its parents. The separated reads are independently assembled into two sequences, representing the diploid genomes. In principle, the haplotype switch is avoidable using this approach.
The linked-reads technique also provides long-range haplotype-phase information (Zheng et al. 2016). Contig sequences constructed from short-read data are phased with linked-reads to establish two haploid genome sequences. Although this method is available commercially (NRGENE, Ness-Ziona, Israel), its details have not yet been disclosed in the public domain (Edger et al. 2019, International Wheat Genome Sequencing Consortium 2018).
Chromosome-level genome assemblies in plants
The first chromosome-level genome assemblies were established for Arabidopsis (The Arabidopsis Genome Initiative 2000) and subsequently rice (International Rice Genome Sequencing Project 2005). When these assemblies were generated, genome sequencing analysis was performed using the Sanger method with a clone-by-clone strategy. However, one of the major drawbacks of this approach is the high cost.
With advances in short-read sequencing technologies, the cost associated with genome sequencing dramatically decreased. Consequently, genome sequences of more than 400 angiosperms were released as of October 2020 (plaBiPD: https://www.plabipd.de). Since it was difficult to construct chromosome-level genome assemblies with only short reads, most of the draft genome sequence assemblies were highly fragmented (Michael and Jackson 2013). Nonetheless, it was possible to assign the fragmented contig sequences to chromosomes by genetic mapping. DNA markers capable of detecting sequence polymorphisms between the parental lines of the mapping population are required for mapping these contigs. In this process, DNA markers are assigned into linkage groups and ordered along the map in accordance with chromosome recombination frequencies in the mapping population. Contigs showing sequence similarity to the DNA markers are assigned to chromosomes. However, it is impossible to assign contigs lacking DNA markers. Moreover, more than two DNA markers at least are required to determine the orientation of each contig on a chromosome.
Long-read sequencing technologies, together with Hi-C and optical mapping methods, have contributed to cluster the assemblies into the chromosome numbers to establish chromosome-level pseudomolecules (Michael and VanBuren 2020); however, the term “chromosome-level” is not defined. In most cases, chromosome-level genome assemblies refer to sequences clustered into the chromosome numbers or assigned to linkage maps with DNA markers as anchors.
We collected a total of 114 chromosome-level plant genome assemblies from the plaBiPD database (accessed at the end of 2019), in addition to those published by a group at the Kazusa DNA Research Institute, and assessed their status (Table 1, Fig. 1). The genome sizes of the selected plant species ranged from 125 Mb (Arabidopsis) to 16.9 Gb (hexaploid wheat [Triticum aestivum]) (Table 1, Fig. 2A) (mean genome size: 1,303 Mb; median genome size: 644 Mb). These genome sequence assemblies contained, on average, approximately 52,950 putative genes (Table 1, Fig. 2B), ranging from 19,023 in white yam (Dioscorea rotundata) to 258,680 in hexaploid wheat. The number of predicted genes roughly correlated with the genome size, even though the criteria used for gene predictions and annotations probably differed among plant species.
Table 1.
Statistics of plant genomes sequenced at the chromosome level
| Plant species name |
Accession name |
Basic chr. no.a |
Estimated genome size (Mb) |
Assembled sequences (Mb)b |
Gap length (Mb)c |
Pseudomol. size (Mb)d |
No. of predicted genes |
Sequencing technologye |
Reference DOI |
| Acer yangbiense |
Malutang |
13 |
640 |
665.9 |
0.0 |
646.2 |
28,320 |
PB |
10.1093/gigascience/giz085 |
| Actinidia chinensis |
Red5 |
29 |
758 |
553.8 |
19.8 |
528.4 |
33,115 |
ILMN |
10.1186/s12864-018-4656-3 |
| Actinidia eriantha |
White |
29 |
745 |
690.8 |
0.4 |
682.4 |
42,988 |
PB |
10.1093/gigascience/giz027 |
| Aegilops tauschii subsp. strangulata |
AL8/78 |
7 |
4,360 |
4,224.9 |
95.9 |
3,942.5 |
258,680 |
ILMN |
10.1038/nature24486 |
| Amaranthus hypochondriacus |
Plainsman |
16 |
466 |
403.9 |
0.0 |
395.8 |
23,879 |
PB, HiC |
10.1186/s12915-017-0412-4 |
| Ananas comosus |
F153 |
25 |
526 |
381.9 |
6.8 |
311.3 |
27,024 |
454, ILMN, PB |
10.1038/ng.3435 |
| Antirrhinum majus |
JI7 |
8 |
520 |
500.7 |
3.3 |
497.4 |
51,479 |
ILMN, PB, 10X, HiC |
10.1038/s41477-018-0349-9 |
| Arabidopsis thaliana |
Col-0 |
5 |
125 |
119.7 |
0.2 |
119.0 |
48,359 |
Sanger, ILMN |
10.1038/35048692 |
| Arabis alpina |
Pajares |
8 |
375 |
336.7 |
11.3 |
300.8 |
39,815 |
Sanger, 454, ILMN |
10.1038/nplants.2014.23 |
| Arachis duranensis |
V14167 |
10 |
1,250 |
1,084.3 |
144.2 |
910.9 |
36,734 |
ILMN |
10.1038/ng.3517 |
| Arachis hypogaea |
Tifrunner |
20 |
2,807 |
2,556.9 |
3.9 |
2,534.6 |
84,714 |
PB |
10.1038/s41588-019-0405-z |
| Arachis ipaensis |
K30076 |
10 |
1,560 |
1,353.8 |
96.8 |
1,251.8 |
41,840 |
ILMN |
10.1038/ng.3517 |
| Arachis monticola |
PI 263393 |
20 |
2,700 |
2,618.8 |
308.9 |
2,114.8 |
74,907 |
ILMN, PB, BN |
10.1093/gigascience/giy066 |
| Asparagus officinalis |
male |
10 |
1,300 |
1,187.5 |
35.5 |
1,080.4 |
27,395 |
ILMN |
10.1038/s41467-017-01064-8 |
| Benincasa hispida |
B227 |
12 |
1,030 |
913.0 |
14.8 |
846.1 |
27,467 |
ILMN |
10.1038/s41467-019-13185-3 |
| Beta vulgaris subsp. vulgaris |
KWS2320 |
9 |
731 |
566.2 |
48.8 |
342.8 |
28,721 |
Sanger, 454, ILMN |
10.1038/nature12817 |
| Brachypodium distachyon |
Bd21 |
5 |
272 |
271.2 |
0.4 |
270.6 |
52,972 |
Sanger |
10.1038/nature08747 |
| Brassica juncea var. tumida |
T84-66 |
18 |
922 |
937.0 |
184.9 |
638.1 |
79,644 |
ILMN, PB, BN |
10.1038/ng.3657 |
| Brassica napus |
Darmor-bzh |
19 |
1,125 |
850.3 |
111.9 |
553.4 |
101,040 |
Sanger, 454 |
10.1126/science.1253435 |
| Brassica nigra |
YZ12151 |
8 |
591 |
402.1 |
47.5 |
277.3 |
47,953 |
ILMN |
10.1038/ng.3657 |
| Brassica oleracea |
TO1000DH3 |
9 |
648 |
488.6 |
43.0 |
407.5 |
59,220 |
454, ILMN |
10.1186/gb-2014-15-6-r77 |
| Brassica oleracea var. capitata |
02-12 |
9 |
630 |
385.0 |
25.6 |
359.4 |
35,400 |
ILMN |
10.1038/ncomms4930 |
| Brassica rapa subsp. pekinensis |
Chiifu-401-42 |
10 |
485 |
353.1 |
2.1 |
294.5 |
46,250 |
ILMN, PB |
10.1038/ng.919 |
| Cajanus cajan |
Asha |
11 |
833 |
605.8 |
34.4 |
235.9 |
48,680 |
ILMN |
10.1038/nbt.2022 |
| Camelina sativa |
DH55 |
20 |
750 |
641.4 |
45.1 |
569.2 |
107,481 |
454, ILMN |
10.1038/ncomms4706 |
| Cannabis sativa |
CBDRx |
10 |
820 |
876.1 |
139.6 |
714.5 |
33,677 |
ILMN, PB, ONT, HiC |
10.1101/458083 |
| Capsicum annuum var. annuum |
Zunla-1 |
12 |
3,070 |
3,528.0 |
229.3 |
2,317.8 |
34,476 |
ILMN |
10.1073/pnas.1400975111 |
| Capsicum annuum var. glabriusculum |
Chiltepin |
12 |
3,260 |
3,364.0 |
154.7 |
2,565.8 |
35,336 |
ILMN |
10.1073/pnas.1400975111 |
| Capsicum baccatum |
PBC81 |
12 |
3,900 |
3,215.6 |
110.6 |
2,737.6 |
35,853 |
ILMN |
10.1186/s13059-017-1341-9 |
| Capsicum chinense |
PI159236 |
12 |
3,200 |
3,070.9 |
51.1 |
2,772.1 |
34,974 |
ILMN |
10.1186/s13059-017-1341-9 |
| Cenchrus americanus |
Tift 23D2B1-P1-P5 |
7 |
2,350 |
1,817.0 |
237.7 |
1,353.4 |
38,579 |
ILMN |
10.1038/nbt.3943 |
| Cerasus × yedoensis |
Somei-Yoshino |
16 |
690 |
735.6 |
45.5 |
421.0 |
95,076 |
PB |
10.1093/dnares/dsz016 |
| Cicer arietinum |
CDC Frontier |
8 |
738 |
532.3 |
49.5 |
319.4 |
28,269 |
ILMN |
10.1038/nbt.2491 |
| Citrullus lanatus |
97103 |
11 |
425 |
404.6 |
27.4 |
364.0 |
22,546 |
ILMN |
10.1111/pbi.13136 |
| Citrus maxima |
Citrus grandis |
9 |
380 |
345.8 |
0.9 |
301.4 |
42,886 |
ILMN, PB |
10.1038/ng.3839 |
| Citrus sinensis |
Valencia |
9 |
367 |
327.9 |
26.8 |
223.9 |
44,275 |
ILMN |
10.1038/ng.2472 |
| Coffea canephora |
DH200-94 |
11 |
710 |
568.6 |
97.3 |
303.3 |
25,574 |
Sanger, 454, ILMN |
10.1126/science.1255274 |
| Cucumis melo |
DHL92 |
12 |
450 |
417.0 |
79.7 |
318.1 |
29,980 |
454 |
10.1073/pnas.1205415109 |
| Cucumis sativus var. sativus |
Chinese long |
7 |
350 |
193.8 |
3.5 |
188.6 |
23,780 |
Sanger, ILMN |
10.1038/ng.475 |
| Cucurbita maxima |
Rimu |
20 |
387 |
279.7 |
14.2 |
209.4 |
32,076 |
ILMN |
10.1016/j.molp.2017.09.003 |
| Cucurbita moschata |
Rifu |
20 |
372 |
273.4 |
10.4 |
233.6 |
32,205 |
ILMN |
10.1016/j.molp.2017.09.003 |
| Cucurbita pepo subsp. pepo |
mu-cu-16 |
20 |
283 |
263.4 |
17.6 |
208.7 |
27,868 |
ILMN |
10.1111/pbi.12860 |
| Daucus carota |
DH1 |
9 |
473 |
421.5 |
34.7 |
340.3 |
32,118 |
Sanger, 454, ILMN |
10.1038/ng.3565 |
| Dioscorea rotundata |
TDr96_F1 |
20 |
580 |
456.7 |
50.6 |
405.0 |
19,023 |
ILMN |
10.1186/s12915-017-0419-x |
| Diospyros lotus |
Kunsenshi-male |
15 |
878 |
746.1 |
35.5 |
414.5 |
51,693 |
PB |
10.1371/journal.pgen.1008566 |
| Elaeis guineensis |
AVROS pisifera |
16 |
1,800 |
1,535.2 |
478.1 |
507.2 |
43,551 |
454 |
10.1038/nature12309 |
| Eragrostis curvula |
Victoria |
10 |
660 |
603.1 |
1.3 |
360.5 |
55,182 |
PB, HiC |
10.1038/s41598-019-46610-0 |
| Eucalyptus grandis |
BRASUZ1 |
11 |
640 |
691.3 |
50.9 |
575.0 |
46,280 |
Sanger |
10.1038/nature13308 |
| Fagopyrum tataricum |
Pinku1 |
8 |
490 |
451.3 |
15.0 |
436.4 |
34,544 |
ILMN, PB |
10.1016/j.molp.2017.08.013 |
| Ficus erecta |
FE-Hiroshima-1 |
13 |
341 |
336.9 |
5.2 |
275.2 |
93,450 |
PB |
10.1111/tpj.14703 |
| Fragaria vesca |
Hawaii-4 |
7 |
240 |
211.7 |
14.7 |
195.3 |
50,732 |
454, ILMN |
10.1038/ng.740 |
| Fragaria × ananassa |
Camarosa |
28 |
813 |
805.5 |
5.2 |
800.3 |
108,087 |
ILMN, PB, 10X |
10.1038/s41588-019-0356-4 |
| Glycine max |
Zhonghuang 13 |
20 |
1,100 |
1,020.3 |
20.5 |
973.8 |
58,017 |
ILMN, PB |
10.1007/s11427-018-9360-0 |
| Glycine max |
Williams 82 |
20 |
1,100 |
978.5 |
23.1 |
932.5 |
88,412 |
Sanger |
10.1038/nature08670 |
| Glycine soja |
W05 |
20 |
1,000 |
1,013.2 |
24.6 |
945.4 |
89,477 |
ILMN, PB |
10.1038/s41467-019-09142-9 |
| Gossypium arboreum |
Shixiya1 |
13 |
1,746 |
1,694.6 |
133.3 |
1,423.5 |
40,134 |
ILMN |
10.1038/ng.2987 |
| Gossypium barbadense |
Hai7124 |
26 |
2,470 |
2,226.7 |
34.2 |
2,149.9 |
75,071 |
ILMN |
10.1038/s41588-019-0371-5 |
| Gossypium hirsutum |
Texas Marker-1 |
26 |
2,340 |
2,298.4 |
30.5 |
2,210.7 |
72,761 |
ILMN |
10.1038/s41588-019-0371-5 |
| Gossypium raimondii |
Not available |
13 |
880 |
761.4 |
13.3 |
737.8 |
77,267 |
Sanger |
10.1038/nature11798 |
| Helianthus annuus |
XRQ |
17 |
3,600 |
3,027.8 |
102.5 |
2,897.3 |
52,191 |
PB |
10.1038/nature22380 |
| Hevea brasiliensis |
GT1 |
18 |
2,150 |
1,473.5 |
1.5 |
1,440.4 |
44,146 |
PB |
10.1016/j.molp.2019.10.017 |
| Hordeum vulgare |
Morex |
7 |
5,428 |
4,834.4 |
262.9 |
4,347.6 |
236,301 |
454, ILMN |
10.1038/nature22043 |
| Hydrangea macrophylla |
Aogashima |
18 |
2,164 |
2,227.6 |
0.6 |
1,076.3 |
32,222 |
ILMN, PB |
10.1101/2020.06.14.151431 |
| Hydrangea macrophylla |
Aogashima |
18 |
2,164 |
2,256.1 |
0.7 |
1,077.1 |
32,205 |
ILMN, PB |
10.1101/2020.06.14.151431 |
| Ipomoea trifida |
NCNSP0306 |
15 |
520 |
492.4 |
59.1 |
355.7 |
44,158 |
ILMN, PB, BN |
10.1038/s41467-018-06983-8 |
| Ipomoea triloba |
NCNSP0323 |
15 |
496 |
461.8 |
24.3 |
427.2 |
47,091 |
ILMN, PB |
10.1038/s41467-018-06983-8 |
| Lactuca sativa |
Salinas |
9 |
2,500 |
2,399.5 |
190.1 |
2,135.8 |
62,656 |
ILMN |
10.1038/ncomms14953 |
| Lagenaria siceraria |
USVL1VR-Ls |
11 |
334 |
313.8 |
16.3 |
292.5 |
22,472 |
ILMN |
10.1111/tpj.13722 |
| Lotus japonicus |
Miyakojima MG-20 |
6 |
465 |
447.4 |
53.0 |
231.6 |
48,105 |
Sanger, 454, ILMN |
10.1093/dnares/dsn008 |
| Lupinus albus |
Amiga |
25 |
450 |
558.9 |
1.5 |
474.2 |
48,719 |
ILMN, PB |
10.1038/s41467-020-14891-z |
| Lupinus angustifolius |
Tanjil |
20 |
951 |
609.2 |
4.2 |
467.1 |
33,083 |
ILMN |
10.1111/pbi.12615 |
| Malus × domestica |
GDDH13 |
17 |
750 |
660.5 |
1.6 |
651.0 |
44,677 |
PB |
10.1038/s41467-019-09518-x |
| Malus × domestica |
HFTH1 |
17 |
750 |
709.6 |
84.7 |
580.0 |
45,116 |
ILMN, PB, BN |
10.1038/ng.654 |
| Manihot esculenta |
AM560-2 |
18 |
807 |
582.1 |
86.6 |
443.9 |
41,393 |
ILMN, HiC |
10.1007/s12042-011-9088-z |
| Medicago truncatula |
A17 |
8 |
454 |
411.8 |
22.8 |
365.9 |
57,585 |
Sanger, 454, ILMN |
10.1186/1471-2164-15-312 |
| Mikania micrantha |
NLD-2019 |
19 |
1,860 |
1,790.6 |
0.2 |
1,616.8 |
46,351 |
PB |
10.1038/s41467-019-13926-4 |
| Musa acuminata subsp. malaccensis |
DH-Pahang |
11 |
523 |
450.8 |
45.3 |
363.5 |
45,856 |
Sanger, 454, ILMN |
10.1093/database/bat035 |
| Musa balbisiana |
DH-PKW |
11 |
438 |
457.2 |
1.1 |
429.3 |
33,021 |
PB |
10.1038/s41477-019-0452-6 |
| Nicotiana attenuata |
Utah |
12 |
2,500 |
2,365.7 |
275.2 |
727.8 |
33,320 |
454, ILMN, PB |
10.1073/pnas.1700073114 |
| Nymphaea colorata |
Beijing-Zhang1983 |
14 |
409 |
409.0 |
0.1 |
371.6 |
33,500 |
PB, HiC |
10.1038/s41586-019-1852-5 |
| Olea europaea var. sylvestris |
Not available |
23 |
1,380 |
1,142.3 |
110.8 |
530.8 |
50,684 |
ILMN |
10.1073/pnas.1708621114 |
| Oryza glaberrima |
IRGC96717 |
12 |
411 |
316.4 |
13.1 |
273.6 |
33,164 |
454 |
10.1038/ng.3044 |
| Oryza sativa subsp. indica |
93-11 |
12 |
385 |
427.0 |
16.3 |
359.4 |
40,745 |
Sanger |
10.1371/journal.pbio.0030038 |
| Oryza sativa subsp. japonica |
Nipponbare |
12 |
385 |
375.0 |
0.1 |
373.1 |
42,373 |
Sanger, 454, ILMN |
10.1186/1939-8433-6-4 |
| Papaver somniferum |
HN1 |
11 |
2,870 |
2,715.5 |
5.4 |
2,214.1 |
84,179 |
ILMN, PB, 10X, ONT |
10.1126/science.aat4096 |
| Phaseolus vulgaris |
G19833 |
11 |
587 |
521.1 |
48.6 |
468.1 |
32,720 |
Sanger, 454, ILMN |
10.1038/ng.3008 |
| Populus trichocarpa |
Nisqually-1 |
19 |
485 |
392.2 |
0.6 |
388.6 |
52,400 |
Sanger, ILMN |
10.1126/science.1128691 |
| Prunus avium |
Satonishiki |
8 |
353 |
373.8 |
127.0 |
180.7 |
43,673 |
ILMN |
10.1093/dnares/dsx020 |
| Prunus dulcis |
Texas |
8 |
240 |
227.6 |
3.9 |
204.9 |
31,654 |
ILMN, ONT |
10.1111/tpj.14538 |
| Prunus mume |
BJFU1210120008 |
8 |
280 |
234.0 |
16.9 |
186.6 |
29,705 |
ILMN |
10.1038/ncomms2290 |
| Prunus persica |
Lovell |
8 |
269 |
227.4 |
2.8 |
223.1 |
47,089 |
Sanger |
10.1038/ng.2586 |
| Punica granatum |
Tunisia-2019 |
8 |
360 |
320.5 |
0.0 |
296.8 |
36,608 |
PB |
10.1111/pbi.13260 |
| Pyrus betulifolia |
Shanxi Duli |
17 |
511 |
532.7 |
35.8 |
471.0 |
59,552 |
PB |
10.1111/pbi.13226 |
| Raphanus sativus |
Okute-Sakurajima |
9 |
538 |
504.7 |
0.1 |
349.8 |
89,915 |
PB |
10.1093/dnares/dsaa010 |
| Raphanus sativus |
WK10039 |
9 |
538 |
426.2 |
54.6 |
297.1 |
46,512 |
Sanger, 454, ILMN, SOLiD |
10.1007/s13580-018-0079-y |
| Saccharum spontaneum |
AP85-441 |
32 |
3,360 |
2,900.2 |
8.1 |
2,892.2 |
53,284 |
ILMN, PB |
10.1038/s41588-018-0237-2 |
| Sesamum indicum |
Zhongzhi No. 13 |
16 |
357 |
275.1 |
4.6 |
230.1 |
35,410 |
ILMN |
10.1186/gb-2014-15-2-r39 |
| Solanum lycopersicum |
Heinz 1706 |
12 |
950 |
828.1 |
81.7 |
728.5 |
35,768 |
Sanger, ILMN |
10.1007/s00122-005-0107-z |
| Solanum pennellii |
LA0716 |
12 |
1,200 |
989.5 |
114.1 |
855.4 |
48,923 |
Sanger, ILMN |
10.1038/ng.3046 |
| Solanum tuberosum |
DM1-3 516 R44 |
12 |
856 |
810.7 |
128.0 |
634.1 |
56,210 |
ILMN |
10.1038/nature10158 |
| Sorghum bicolor |
BTx623 |
10 |
818 |
708.7 |
33.4 |
655.2 |
47,110 |
Sanger, ILMN |
10.1038/nature07723 |
| Thellungiella parvula |
Not available |
7 |
140 |
123.6 |
1.4 |
112.7 |
27,132 |
454, ILMN |
10.1038/ng.889 |
| Theobroma cacao |
B97-61/B2 |
10 |
430 |
324.8 |
18.5 |
297.3 |
30,655 |
Sanger, 454, ILMN |
10.1186/s12864-017-4120-9 |
| Trifolium pratense var. Milvus |
Milvus B |
7 |
420 |
304.8 |
35.8 |
164.2 |
41,270 |
ILMN |
10.1038/srep17394 |
| Trifolium subterraneum |
Daliak |
8 |
540 |
488.8 |
74.7 |
346.3 |
42,706 |
454, ILMN |
10.1038/srep30358 |
| Triticum aestivum |
Chinese Spring |
21 |
16,944 |
14,547.3 |
275.7 |
13,840.5 |
133,346 |
Sanger, ILMN, HiC, BN |
10.1126/science.aar7191 |
| Triticum turgidum |
Svevo |
14 |
12,000 |
10,463.1 |
162.1 |
9,836.6 |
196,105 |
ILMN, HiC |
10.1038/s41588-019-0381-3 |
| Vigna angularis var. angularis |
Jingnong 6 |
11 |
538 |
466.7 |
17.0 |
360.8 |
33,860 |
ILMN |
10.1073/pnas.1420949112 |
| Vigna radiata var. radiata |
VC1973A |
11 |
548 |
463.1 |
33.6 |
314.0 |
23,181 |
ILMN |
10.1038/ncomms6443 |
| Vigna unguiculata |
IT97K-499-35 |
11 |
586 |
519.4 |
2.7 |
471.2 |
54,484 |
PB, BN |
10.1111/tpj.14349 |
| Vitis vinifera |
PN40024 |
19 |
416 |
486.3 |
16.0 |
416.2 |
29,927 |
Sanger |
10.1038/nature06148 |
| Zea mays |
B73 |
10 |
2,665 |
2,135.1 |
30.7 |
2,075.6 |
131,585 |
PB |
10.1038/nature22971 |
| Ziziphus jujuba |
Dongzao |
12 |
443 |
437.8 |
20.4 |
307.7 |
43,574 |
ILMN |
10.1038/ncomms6315 |
| Zoysia japonica |
Nagirizaki |
20 |
390 |
273.7 |
10.1 |
263.6 |
59,271 |
ILMN |
10.1093/dnares/dsw006 |
a Basic chromosome number (n).
b Total length of assembled sequences, including gaps.
c Total length of gaps.
d Total length of pseudomolecule sequences without gaps and sequences unassigned to any chromosomes.
e 10X, 10X Genomics; 454, Roche; BN, Bionano Genomics; HiC, Hi-C; ILMN, Illumina; ONT, Oxford Nanopore Technologies; PB, PacBio; SOLiD, Thermo Fisher Scientific; Sanger, Sanger sequencing method.
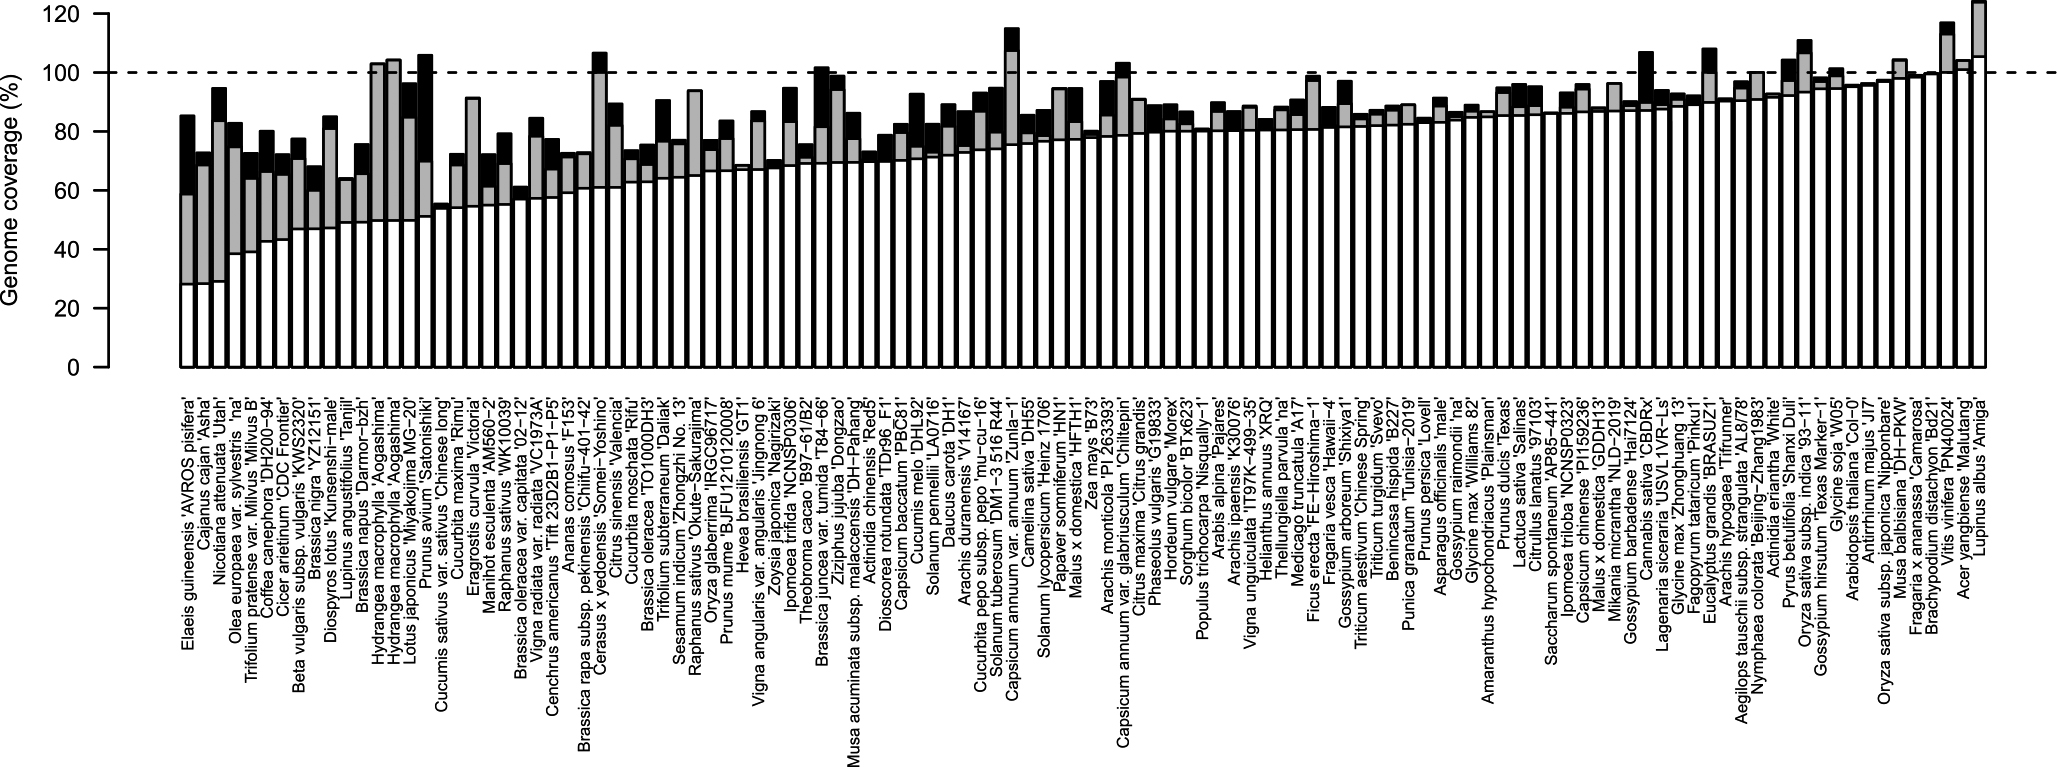

The size of the assembled sequences (including unassigned sequences and gaps) was closely related to the genome size estimated by flow cytometry analysis and/or k-mer size distributions (Table 1, Fig. 1). The average genome coverage of chromosome-level assemblies was 89.1% (Table 1, Fig. 1), ranging from 55.3% in cucumber (Cucumis sativus var. sativus) to 124.2% in white lupin (Lupinus albus). On the other hand, the average genome coverage of chromosome-level pseudomolecules (excluding unassigned sequences and gaps) was 73.3% (Table 1, Fig. 1), ranging from 28.2% in African oil palm (Elaeis guineensis) to 105.4% in white lupin. The completeness of the genome assembly might be influenced by several factors, such as fragmented contigs obtained using short-read sequencing technologies, and unavailability of DNA markers in the parental lines of a given mapping population. Hi-C and optical mapping methods could overcome the limitation of genetic mapping; both technologies use only a single individual and are not affected by the availability of DNA markers. However, a major limitation of the optical mapping method is the extraction of high-quality super-long genomic DNA molecules from plant cells. Therefore, Hi-C has become a popular technology, as it does not require long genomic DNA fragments (Michael and VanBuren 2020).
Other factors affecting the completeness of the genome assembly include the presence of repetitive sequences and high ploidy levels, as these factors would interfere with the extension of sequence contiguity. Single chromosome separation by microscopy (Yanagi et al. 2017) or using chromosome sorting techniques (International Wheat Genome Sequencing Consortium 2014) would prevent the mis-assembly of contigs belonging to different chromosomes.
Future perspectives
Genome sequencing using advanced technologies has improved genome assembly. Initially, NGS technologies were based on short-read sequencing methods, resulting in highly fragmented draft genome sequences, which were used as a reference for many plant species. Although the draft genome sequence provides information on all genes in the genome, it does not provide genome structure data. On the other hand, long-read technologies, together with scaffolding methods, generate chromosome-level pseudomolecule sequences. However, researchers should be aware that the genome coverage of pseudomolecule sequences does not always correspond to the estimated genome size of the plant species. Therefore, further improvements are necessary to generate telomere-to-telomere sequences (Miga et al. 2020).
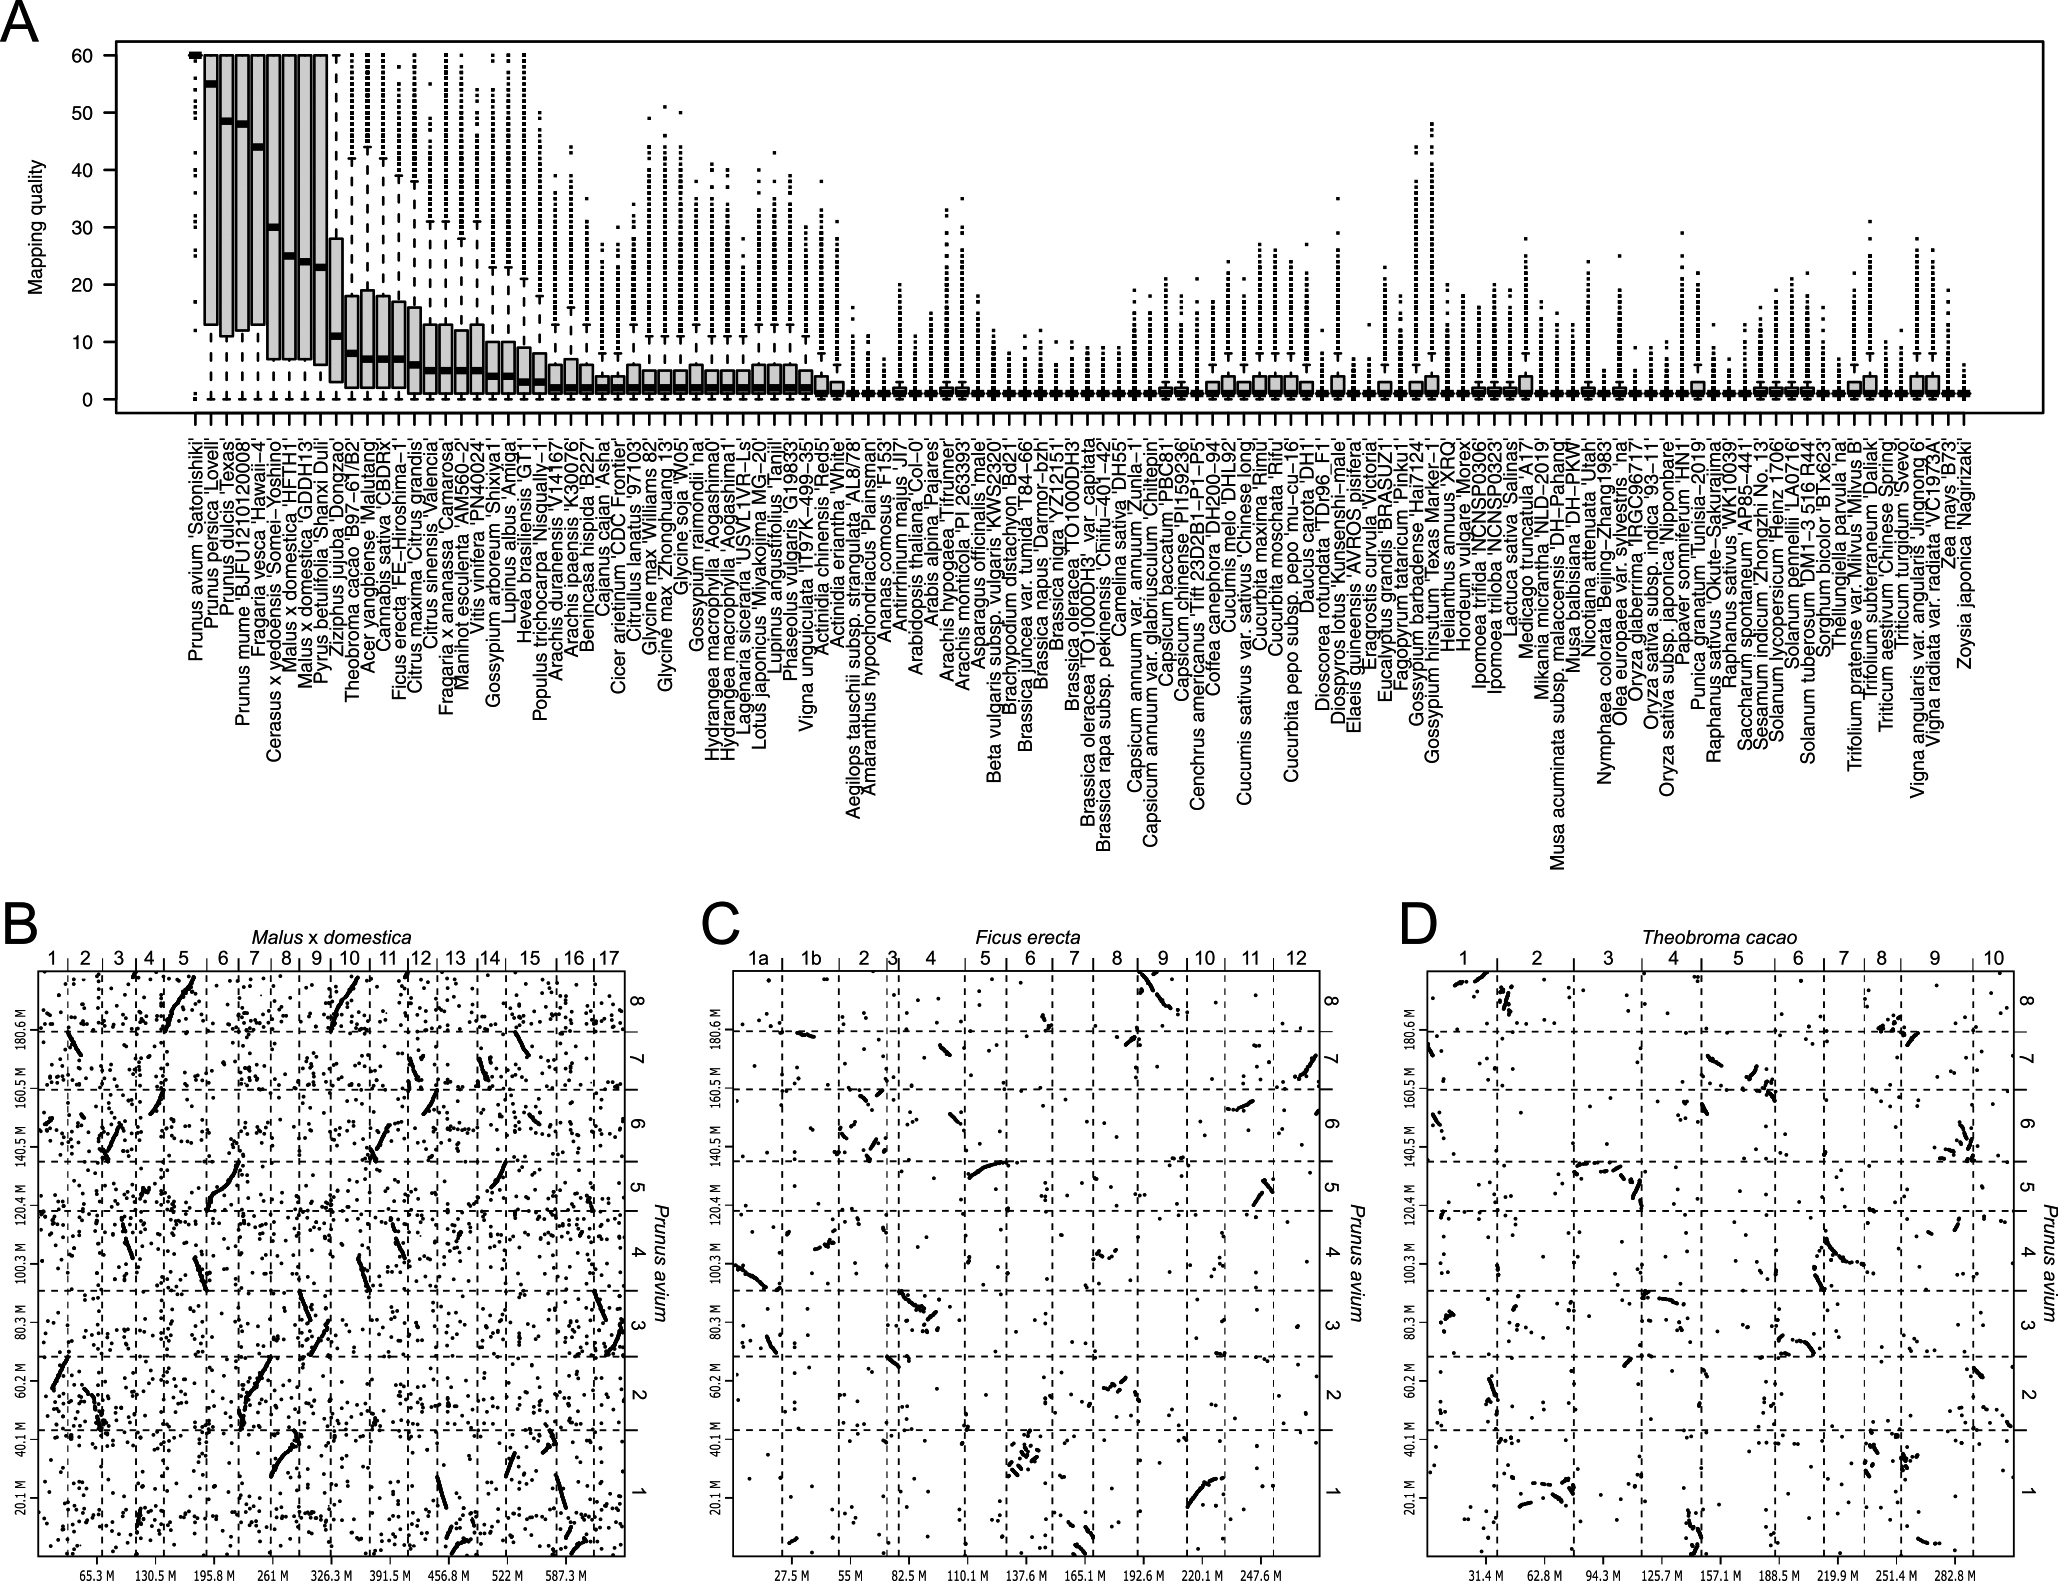
Indeed, chromosome-level genome assemblies would provide us new insights into the evolutionary history of plant genomes. It is possible to compare genome sequences and structures of plant species, for which chromosome-level sequences are available. For example, chromosome-level genome sequence of sweet cherry (Prunus avium) (Shirasawa et al. 2017) was aligned onto those of the 114 plants listed in the Table 1 with minimap2 (Li 2018), and the sequence alignments were visualized by dot plots with D-GENIES (Cabanettes and Klopp 2018). Sequence similarities between the query and subject sequences were scored as mapping quality in the pairwise mapping format (PAF) file generated from the minimap2 (Fig. 3A). Since sweet cherry is a member of the Rosaceae, the genome structure of sweet cherry was expectedly conserved in the family, e.g., apple (Malus × domestica) (Fig. 3B). In addition, it was revealed that the sweet cherry genome structure was similar to not only those from the Rosales to which the Rosaceae belongs, e.g., Japanese fig (Ficus erecta) (Fig. 3C), and but also those of other orders, e.g., cacao (Theobroma cacao) (Fig. 3D). This result well supported the phylogenetic relationship of angiosperms (Ramírez-Barahona et al. 2020). Recently, it has been proposed that the genome of a common ancestor for angiosperms is diploid with seven basic chromosomes (n = 7) comprised a DNA content of 1C = 1.73 pg (approximately 1.7 Gb in size) (Carta et al. 2020). It might be possible to presume the structure of the common ancestor genome by the comparative analysis of the chromosome-level sequences across angiosperms.
Advanced genome sequencing technologies are expected to analyze pan-genomes, which will reveal all genes present within a species by comparing chromosome-level de novo genome sequences of multiple accessions belonging to the same species (Gao et al. 2019, Liu et al. 2020, The 1001 Genomes Consortium 2016, Wang et al. 2018). Genome sequences of these accessions are classified as core and dispensable genomes, and describe sequence and structural variations through genome graphs (Bayer et al. 2020). Along with pan-genome studies, several international genome sequencing consortia have been launched. For example, the One Thousand Plant Transcriptomes Initiative (One Thousand Plant Transcriptomes Initiative 2019) and 10PK (Cheng et al. 2018) projects have been initiated to sequence >1,000 plant transcriptomes and >10,000 plant genomes, respectively. Moreover, the Earth BioGenome Project (EBP) aims to sequence, catalog, and characterize the genomes of all eukaryotes present on earth; completion of this project is expected to take 10 years (Lewin et al. 2018). These efforts would enhance not only our understanding of the genomics and genetic diversity of all life forms on earth, but also facilitate genomics-based breeding.
Author Contribution Statement
KS designed the structure of the manuscript. DH, HH, and SI collected the genome data. KS analyzed the data and wrote the manuscript with contributions from SI and CK. All authors read and approved the final manuscript.
Acknowledgments
We thank A. Watanabe at the Kazusa DNA Research Institute for technical assistance. This work was partially supported by Life Science Database Integration Project of the National Bioscience Database Center (NBDC) of the Japan Science and Technology Agency (JST) and Kazusa DNA Research Institute Foundation.
Literature Cited
- Bayer, P.E., A.A. Golicz, A. Scheben, J. Batley and D. Edwards (2020) Plant pan-genomes are the new reference. Nat. Plants 6: 914–920.
- Cabanettes, F. and C. Klopp (2018) D-GENIES: dot plot large genomes in an interactive, efficient and simple way. PeerJ 6: e4958.
- Carta, A., G. Bedini and L. Peruzzi (2020) A deep dive into the ancestral chromosome number and genome size of flowering plants. New Phytol. 228: 805–808.
- Cheng, S., M. Melkonian, S.A. Smith, S. Brockington, J.M. Archibald, P.M. Delaux, F.W. Li, B. Melkonian, E.V. Mavrodiev, W. Sun et al. (2018) 10KP: A phylodiverse genome sequencing plan. Gigascience 7: 1–9.
- Chin, C.S., P. Peluso, F.J. Sedlazeck, M. Nattestad, G.T. Concepcion, A. Clum, C. Dunn, R. O’Malley, R. Figueroa-Balderas, A. Morales-Cruz et al. (2016) Phased diploid genome assembly with single-molecule real-time sequencing. Nat. Methods 13: 1050–1054.
- Dudchenko, O., S.S. Batra, A.D. Omer, S.K. Nyquist, M. Hoeger, N.C. Durand, M.S. Shamim, I. Machol, E.S. Lander, A.P. Aiden et al. (2017) De novo assembly of the Aedes aegypti genome using Hi-C yields chromosome-length scaffolds. Science 356: 92–95.
- Durney, B.C., C.L. Crihfield and L.A. Holland (2015) Capillary electrophoresis applied to DNA: determining and harnessing sequence and structure to advance bioanalyses (2009–2014). Anal. Bioanal. Chem. 407: 6923–6938.
- Edger, P.P., T.J. Poorten, R. VanBuren, M.A. Hardigan, M. Colle, M.R. McKain, R.D. Smith, S.J. Teresi, A.D.L. Nelson, C.M. Wai et al. (2019) Origin and evolution of the octoploid strawberry genome. Nat. Genet. 51: 541–547.
- Eid, J., A. Fehr, J. Gray, K. Luong, J. Lyle, G. Otto, P. Peluso, D. Rank, P. Baybayan, B. Bettman et al. (2009) Real-time DNA sequencing from single polymerase molecules. Science 323: 133–138.
- Gao, L., I. Gonda, H. Sun, Q. Ma, K. Bao, D.M. Tieman, E.A. Burzynski-Chang, T.L. Fish, K.A. Stromberg, G.L. Sacks et al. (2019) The tomato pan-genome uncovers new genes and a rare allele regulating fruit flavor. Nat. Genet. 51: 1044–1051.
- Goff, S.A., D. Ricke, T.H. Lan, G. Presting, R. Wang, M. Dunn, J. Glazebrook, A. Sessions, P. Oeller, H. Varma et al. (2002) A draft sequence of the rice genome (Oryza sativa L. ssp. japonica). Science 296: 92–100.
- Goodwin, S., J.D. McPherson and W.R. McCombie (2016) Coming of age: ten years of next-generation sequencing technologies. Nat. Rev. Genet. 17: 333–351.
- International Rice Genome Sequencing Project (2005) The map-based sequence of the rice genome. Nature 436: 793–800.
- International Wheat Genome Sequencing Consortium (2014) A chromosome-based draft sequence of the hexaploid bread wheat (Triticum aestivum) genome. Science 345: 1251788.
- International Wheat Genome Sequencing Consortium (2018) Shifting the limits in wheat research and breeding using a fully annotated reference genome. Science 361: eaar7191.
- Kasianowicz, J.J., E. Brandin, D. Branton and D.W. Deamer (1996) Characterization of individual polynucleotide molecules using a membrane channel. Proc. Natl. Acad. Sci. USA 93: 13770–13773.
- Koren, S. and A.M. Phillippy (2015) One chromosome, one contig: complete microbial genomes from long-read sequencing and assembly. Curr. Opin. Microbiol. 23: 110–120.
- Koren, S., A. Rhie, B.P. Walenz, A.T. Dilthey, D.M. Bickhart, S.B. Kingan, S. Hiendleder, J.L. Williams, T.P.L. Smith and A.M. Phillippy (2018) De novo assembly of haplotype-resolved genomes with trio binning. Nat. Biotechnol. 36: 1174–1182.
- Korostin, D., N. Kulemin, V. Naumov, V. Belova, D. Kwon and A. Gorbachev (2020) Comparative analysis of novel MGISEQ-2000 sequencing platform vs Illumina HiSeq 2500 for whole-genome sequencing. PLoS ONE 15: e0230301.
- Lewin, H.A., G.E. Robinson, W.J. Kress, W.J. Baker, J. Coddington, K.A. Crandall, R. Durbin, S.V. Edwards, F. Forest, M.T.P. Gilbert et al. (2018) Earth BioGenome Project: Sequencing life for the future of life. Proc. Natl. Acad. Sci. USA 115: 4325–4333.
- Li, H. (2018) Minimap2: pairwise alignment for nucleotide sequences. Bioinformatics 34: 3094–3100.
- Lieberman-Aiden, E., N.L. van Berkum, L. Williams, M. Imakaev, T. Ragoczy, A. Telling, I. Amit, B.R. Lajoie, P.J. Sabo, M.O. Dorschner et al. (2009) Comprehensive mapping of long-range interactions reveals folding principles of the human genome. Science 326: 289–293.
- Liu, Y., H. Du, P. Li, Y. Shen, H. Peng, S. Liu, G.A. Zhou, H. Zhang, Z. Liu, M. Shi et al. (2020) Pan-genome of wild and cultivated soybeans. Cell 182: 162–176.e13.
- Martin, W.J., J.R. Warmington, B.R. Galinski, M. Gallagher, R.W. Davies, M.S. Beck and S.G. Oliver (1985) Automation of DNA sequencing: A system to perform the Sanger dideoxysequencing reactions. Nat. Biotechnol. 3: 911–915.
- Maxam, A.M. and W. Gilbert (1977) A new method for sequencing DNA. Proc. Natl. Acad. Sci. USA 74: 560–564.
- Michael, T.P. and S. Jackson (2013) The first 50 plant genomes. Plant Genome 6: 1–7.
- Michael, T.P. and R. VanBuren (2020) Building near-complete plant genomes. Curr. Opin. Plant Biol. 54: 26–33.
- Miga, K.H., S. Koren, A. Rhie, M.R. Vollger, A. Gershman, A. Bzikadze, S. Brooks, E. Howe, D. Porubsky, G.A. Logsdon et al. (2020) Telomere-to-telomere assembly of a complete human X chromosome. Nature 585: 79–84.
- Nyrén, P., B. Pettersson and M. Uhlén (1993) Solid phase DNA minisequencing by an enzymatic luminometric inorganic pyrophosphate detection assay. Anal. Biochem. 208: 171–175.
- One Thousand Plant Transcriptomes Initiative (2019) One thousand plant transcriptomes and the phylogenomics of green plants. Nature 574: 679–685.
- Paterson, A.H., M. Freeling and T. Sasaki (2005) Grains of knowledge: genomics of model cereals. Genome Res. 15: 1643–1650.
- Ramírez-Barahona, S., H. Sauquet and S. Magallón (2020) The delayed and geographically heterogeneous diversification of flowering plant families. Nat. Ecol. Evol. 4: 1232–1238.
- Rensink, W.A. and C.R. Buell (2004) Arabidopsis to rice. Applying knowledge from a weed to enhance our understanding of a crop species. Plant Physiol. 135: 622–629.
- The 1001 Genomes Consortium (2016) 1,135 genomes reveal the global pattern of polymorphism in Arabidopsis thaliana. Cell 166: 481–491.
- The Arabidopsis Genome Initiative (2000) Analysis of the genome sequence of the flowering plant Arabidopsis thaliana. Nature 408: 796–815.
- Sanger, F., S. Nicklen and A.R. Coulson (1977) DNA sequencing with chain-terminating inhibitors. Proc. Natl. Acad. Sci. USA 74: 5463–5467.
- Shirasawa, K., K. Isuzugawa, M. Ikenaga, Y. Saito, T. Yamamoto, H. Hirakawa and S. Isobe (2017) The genome sequence of sweet cherry (Prunus avium) for use in genomics-assisted breeding. DNA Res. 24: 499–508.
- Smith, L.M., J.Z. Sanders, R.J. Kaiser, P. Hughes, C. Dodd, C.R. Connell, C. Heiner, S.B. Kent and L.E. Hood (1986) Fluorescence detection in automated DNA sequence analysis. Nature 321: 674–679.
- Wang, W., R. Mauleon, Z. Hu, D. Chebotarov, S. Tai, Z. Wu, M. Li, T. Zheng, R.R. Fuentes, F. Zhang et al. (2018) Genomic variation in 3,010 diverse accessions of Asian cultivated rice. Nature 557: 43–49.
- Wenger, A.M., P. Peluso, W.J. Rowell, P.C. Chang, R.J. Hall, G.T. Concepcion, J. Ebler, A. Fungtammasan, A. Kolesnikov, N.D. Olson et al. (2019) Accurate circular consensus long-read sequencing improves variant detection and assembly of a human genome. Nat. Biotechnol. 37: 1155–1162.
- Yanagi, T., K. Shirasawa, M. Terachi and S. Isobe (2017) Sequence analysis of cultivated strawberry (Fragaria × ananassa Duch.) using microdissected single somatic chromosomes. Plant Methods 13: 91.
- Yu, J., S. Hu, J. Wang, G.K. Wong, S. Li, B. Liu, Y. Deng, L. Dai, Y. Zhou, X. Zhang et al. (2002) A draft sequence of the rice genome (Oryza sativa L. ssp. indica). Science 296: 79–92.
- Yuan, Y., C.Y. Chung and T.F. Chan (2020) Advances in optical mapping for genomic research. Comput. Struct. Biotechnol. J. 18: 2051–2062.
- Zheng, G.X., B.T. Lau, M. Schnall-Levin, M. Jarosz, J.M. Bell, C.M. Hindson, S. Kyriazopoulou-Panagiotopoulou, D.A. Masquelier, L. Merrill, J.M. Terry et al. (2016) Haplotyping germline and cancer genomes with high-throughput linked-read sequencing. Nat. Biotechnol. 34: 303–311.
