Abstract
Lisianthus (Eustoma grandiflorum) is an important floricultural crop cultivated worldwide. Despite its commercial importance, few DNA markers are available for molecular genetic research. In this study, we constructed a genetic linkage map and to detect quantitative trait loci (QTLs) for important agronomic traits of lisianthus. To develop simple sequence repeat (SSR) markers, we used 454-pyrosequencing technology to obtain genomic shotgun sequences and subsequently identified 8263 putative SSRs. A total of 3990 primer pairs were designed in silico and 1189 unique primer pairs were extracted through a BLAST search. Amplification was successful for more than 1000 primer pairs, and ultimately 278 SSR markers exhibited polymorphism between the two lisianthus accessions evaluated. Based on these markers, a genetic linkage map was constructed using a breeding population derived from crosses between the two accessions, for which flowering time differed (>140 days when grown under 20°C). We detected one QTL associated with flowering time (phenotypic variance, 27%; LOD value, 3.7). The SSR marker located at this QTL may account for variation in flowering time among accessions (i.e., three accessions whose nodes of the first flower were over 30 had late-flowering alleles of this QTL).
Introduction
The genus, Eustoma, belongs to the Gentianaceae family and is native to southern North America and northern South America. Eustoma consists of two (sub) species, a large-flowered Eustoma grandiflorum (Raf.) Shinn [syn. E. russellianum (Hook.) G. Don ex Sweer] and a small-flowered E. exaltatum (Turner 2014). The two species are closely related and crossable, and the wild populations produce less showy flowers with only five corolla lobes. Cultivated forms of E. grandiflorum exhibit a variety of colors and an increased number of corolla lobes owing to selective breeding in recent decades. Forms with spectacular flowers are grown worldwide and are commercially relevant as cut flowers. In response to the commercial success of E. grandiflorum, studies on traits, such as corolla color, floral morphology, and heat tolerance of the rosette, have been conducted (Ishimori and Kawabata 2014, Ohkawa et al. 1991, Pergola et al. 1992, Shimizu et al. 2011). Approaches for genetic modification of E. grandiflorum have been explored, which are undeniably useful for functional analysis (Azuma et al. 2016, Chanoca et al. 2015, Nakano 2017, Nielsen et al. 2002). However, no genomic DNA markers or linkage maps are available for genetic research and breeding of this species. Moreover, conflicting reports on the ploidy level and chromosome number in Eustoma have been published (Barba-Gonzalez et al. 2015, Griesbach and Bhat 1990, Rork 1949), which complicate genetic analysis. It was initially reported that the chromosome number of root tip cells of E. grandiflorum was 2n = 8x = 72 (Rork 1949). In contrast, the chromosome number of E. grandiflorum (‘Blue Poppy’) was reported to be 2n = 2x = 36 (Griesbach and Bhat 1990). Recently, Barba-Gonzalez et al. (2015) determined the basic chromosome number of one accession of E. exaltatum to be 2n = 2x = 72 based on fluorescence in situ hybridization of 45S rDNA.
For linkage map construction and quantitative trait locus (QTL) mapping, the development of simple sequence repeat (SSR) markers, also known as microsatellite markers, is fundamental because of their abundant alleles and codominant inheritance (Tang et al. 2003, Weber and May 1989). Although single-nucleotide polymorphism (SNP) genotyping is a powerful tool for linkage map construction, SSRs are also useful for identifying genes for marker-assisted breeding (Inghelandt et al. 2010, Neeraja et al. 2007). Both SSRs and SNPs have the advantages of genetic diversity studies and show a high frequency of polymorphism (Coates et al. 2009, Gramazio et al. 2017, Inghelandt et al. 2010). The traditional approach of screening SSR-enriched libraries may be inefficient for the identification of SSRs compared to next-generation sequencing technology, which considerably expedites SSR marker development (Kaur et al. 2011, Yang et al. 2014, Zhu et al. 2012).
In many crops, the control of flowering time is well studied because it influences agronomically important characteristics, such as harvesting date, quality, and yield (Iwata et al. 2012, Kitamoto et al. 2017, Zhang et al. 2012, 2019). Many flowering-related genes in Arabidopsis have been identified and grouped into multiple pathways, such as photoperiod, thermosensory, vernalization, age-dependent, and light-signaling gibberellin pathways (Kinoshita and Richter 2020). In Eustoma, long days and high temperatures promote flowering (Islam et al. 2005, Zaccai and Edri 2002), and vernalization accelerates flowering time (Harbaugh et al. 1992, Ohkawa et al. 1991). Treatment with gibberellic acid (GA3) does not affect flower bud initiation, but promotes stem elongation in rosetted seedlings of E. grandiflorum (Hisamatsu et al. 1999). In contrast to the data on the analysis of flowering of Eustoma in cultivation, little information is available on differences in flowering time among accessions and genetic markers that can help distinguish between such differences. The gene EgFT, the FT homolog of E. grandiflorum, acts similarly to Arabidopsis FT in regulating the flowering transition by activating floral meristem identity genes (Li et al. 2015, Nakano et al. 2011). However, to clarify the mechanism for regulation of flowering time in Eustoma, further genetic analysis and cultivation under strictly controlled environmental conditions are needed.
In this report, a series of analyses was conducted to develop a linkage map for Eustoma. In advance of obtaining sequences, we analyzed the DNA contents of various accessions and chose the most appropriate one. Next, we obtained genomic shotgun sequences using a GS-FLX pyrosequencing platform and screened SSRs using a bioinformatics protocol. In addition, we screened a panel of accessions that varied in flowering time, and QTL analysis was conducted using the constructed linkage map.
Materials and Methods
Plant material
For genome size analysis, the accessions ‘Alpus’, ‘Ayanoyuki’, ‘Blue Poppy’, ‘Borero White’, ‘Casino Queen’, ‘Deep Purple’, ‘Doremi Wine Red’, ‘Double Mini Lavender’, ‘Double Mini White’, ‘Exrosa White’, ‘Genjinosakura’, ‘Genjinoyuki’, ‘Genjiwakazakura’, ‘Glory Pink’, ‘Glory White’, ‘Hakusen’, ‘Hory Creamy White’, ‘Hory Red’, ‘Hory Small Lady’, ‘Hory Small Sky’, ‘Hory White No. 1’, ‘Hory White No. 2’, ‘Hory White No. 3’, ‘Ichibanboshi’, ‘Kairyowakamurasaki’, ‘Ichibanboshi’, ‘Kairyowakamurasaki’, ‘King of Orchid’, ‘Ladyfriend’, ‘Linelook’, ‘Maikuro’, ‘Maite Pink’, ‘Miss Lilac, ‘Miss Pearl’, ‘Moulin Rouge’, ‘New Small Lady’, ‘Oita 14’, ‘Oita 16’, ‘Oita 17’, ‘Oita 18’, ‘Paikuro’, ‘Pastel Suzuki’, ‘Piccorosa Snow’, ‘Pure White’, ‘Purple Star’, ‘Reina White’, ‘Robera Pink’, ‘Saike’, ‘Sailor Light Blue’, ‘Sailor Small Pink’, ‘Sailor White’, ‘Shien’, ‘Shihai’, ‘Shikongenji’, ‘Shikongenji’, ‘Shisen’, ‘Skyfriend’, ‘Summit Pink’, ‘T4A’, ‘Tenryukomachi’, ‘Tenryuotome’, ‘Tenryuwhite’, ‘Tiramisu’, ‘Tohaku’, ‘Tosen’, ‘Totou’, ‘Voyage White’, ‘Wakamurasaki’, ‘Wakasagi’, and ‘Yukitemari’ were cultivated. Plants were grown from seeds following the method described by Ushio et al. (2014). Each seedling at the two-leaf-pair stage was transplanted to a 10.5-cm plastic pot containing fertilized growing medium (Kureha Engeibaido, Kureha Chemical Industry Co., Ltd., Tokyo, Japan).
Two accessions, ‘T4A’ as the maternal parent and selfed progeny of ‘Illumiblue’ (Ill-s) as the paternal parent, were crossed to generate an F2 mapping population consisting of 80 individuals (hereafter termed T4A × Ill-s). For detection of QTLs associated with flowering time, we recorded the period from transplanting to blooming to validate the flowering time of the F2 mapping population. The plants were grown in a greenhouse maintained at 20°C and a 24 h photoperiod with continuous illumination provided by low-intensity incandescent bulbs (2 μmol·m–2·s–1 photosynthetic photon flux density [PPFD] at the plant level) in 2012. For validation of the putative QTL, we grew F2 populations in different seasons, with plantings on August 16 and October 11, 2016. The plants were initially grown in a ventilated greenhouse at 28°C and then heated at 15°C after December 21 (in the event that the nighttime temperature decreased below 15°C). In each season, a 13 h photoperiod (from 06:00 to 19:00) was applied with low-intensity incandescent bulbs (2 μmol·m–2·s–1 PPFD at the plant level). As an additional experiment for validation of the putative QTL, we evaluated the flowering time (recorded as the node of the first flower) for 17 cultivars (‘Bolero White’, ‘Bridal Snow’, ‘Candimarine’, ‘Cocktail Blue’, ‘Excalibur Pure White’, ‘Exrosa White’, ‘Final Rose’, ‘Haruichiban’, ‘Haruurara’, ‘Illumiwhite’, ‘King of Snow’, ‘Mariage’, ‘Peneabiapink’, ‘Piccorose Snow’, ‘Sirius White 386’, ‘Tsukushinoyuki’, and ‘Yukibotan’). Plants were grown in a greenhouse maintained at 20°C and a 9 h photoperiod together with natural sunlight.
For genome size analysis, samples were stained with a solution containing 10 mM Tris, 50 mM sodium citrate, 2 mM MgCl2, 0.1% (v/v) Triton X-100, and 2 mg/L 4ʹ,6-diamidino-2-phenylindole at pH 7.5. The DNA index calculation relies on the position of the G0/G1 peak in the sample in relation to the G0/G1 peak of control diploid cells derived from Ipomoea nil ‘Murasaki’ (experiment 1) or ‘Tokyokokei’ (experiment 2). The genome size of the Eustoma accessions was calculated using the following formula: 750 (Mb) × DNA index relative to Ipomoea nil. The number of individuals examined was one (experiment 1) and 2–5 (experiment 2).
DNA extraction and library preparation for GS-FLX sequencing
The E. grandiflorum cultivar ‘Shihai’ was used for genome sequencing analysis. Nuclear genomic DNA was extracted from young leaves using a slight modification of the method described by Zhang et al. (1995). DNA was sheared by nebulization, used for 454 library preparation, and shotgun sequenced with a Roche/454 Genome Sequencer (GS)-FLX Titanium platform (Roche Diagnostics, Branford, CT, USA). The sequences were submitted to the International Nucleotide Sequence Database Collaboration (PRJDB10307).
De novo assembly, SSR mining, and primer design
To remove redundant reads, de novo DNA sequence assembly (or alignment of reads) was performed using Newbler ver. 2.7. For the identification of SSRs, MISA software (http://pgrc.ipk-gatersleben.de/misa/) was used. We designated the minimum number of desired repeats as nine for dinucleotides, six for trinucleotides, five for tetranucleotides, four for pentanucleotides, and four for hexanucleotides. The SSRs juxtaposed to each other without an intervening spacer and the SSRs lacking a flanking DNA sequence were filtered out.
High-throughput primers were designed using Primer3 ver. 2.2.3 (https://primer3.sourceforge.net/) with the following criteria: primer length of 18–28 bases, optimum primer length of 20 bases, annealing temperature 57–65°C, and PCR product size 100–300 bp. To extract unique primer pairs, BLAST 2.2.24+ was used to query each primer pair against the resulting alignment of GS-FLX reads. The search criteria were coverage ≥90% and identity ≥90%.
SSR marker screening
Eustoma ‘T4A’ (Miyoshi Seed Co., Japan) and ‘Illumiblue’ (JT Co., Japan) were used for SSR screening for marker development. Genomic DNA was isolated from young leaves using the DNeasy Plant Mini Kit (Qiagen). Initial screening for polymorphisms was performed with the 2182 “EGU” primer set, of which at least one primer showed no other BLAST hits against the assembled nucleotide sequence (Supplemental Fig. 1). Each PCR was performed in a 10 μL reaction volume containing 5 μL 2× GoTaq PCR MasterMix (Promega), 4 μL of each primer (0.5 μM), and 1 μL genomic DNA (4 ng). The SSRs were amplified using a thermal cycler (Applied Biosystems) with the following protocol: 5 min initial denaturation at 95°C, then 35 cycles of 95°C for 30 s, 55°C for 30 s, elongation at 72°C for 30 s, and a final extension at 72°C for 10 min. The PCR products were separated using electrophoresis at 180 V for 120 min in a 3% agarose gel. We also screened for polymorphisms using fluorescent fragment analysis. Each PCR was performed using the M13-tailed primer method (Schuelke 2000) with minor modifications. The SSR forward primers were modified by 5-concatenation with the T7 promoter sequence (AATACGACTCACTATAG). We labeled the T7 promoter sequence primers with FAM fluorescent dye (T7-P-FAM) and the reverse primer was extended with a pigtail (GTTTCTT) sequence for amplification stabilization (Brownstein et al. 1996). PCR amplification was conducted in a volume of 10 μL containing 1 ng genomic DNA, 0.4 pmol of the T7-P-tailed primer, 1.6 pmol of T7-P-FAM, 1.6 pmol of each unlabeled reverse primer, and 5 μL of 2× GoTaq Colorless Master Mix (Promega, USA). Amplification was performed as follows: 94°C for 5 min, followed by 30 cycles at 94°C for 30 s, 56°C for 90 s, and 72°C for 90 s, followed by 8 cycles at 94°C for 30 s, 53°C for 90 s, and 72°C for 90 s, with a final extension at 72°C for 10 min. Markers showing polymorphisms were genotyped using a Multiplex PCR Kit (Qiagen) for the F2 populations. The allele sizes amplified using this primer method contained approximately 18 bp of the tailed sequences. Amplified PCR products were separated and detected using an ABI PRISM 3730 Genetic Analyzer (Applied Biosystems, USA). The sizes of the amplified bands were determined using a DNA internal standard (400HD-ROX, Applied Biosystems) and Gene Mapper software (Life Technologies Co.). The 278 markers identified in this study and variants between the two accessions T4A and Ill-s were fixed with “EGF”. The SSR motif-containing sequences, from which the EGF primers were designed, are shown in Supplemental Table 1. The 259 Eustoma SSR motif-containing markers used for the construction of a linkage map were also fixed with “EGS”.
Construction of mapping population and genetic linkage map
Young leaves of the F2 mapping population were sampled for DNA extraction, and polymorphic markers between the parents were used for mapping the progeny. To construct the genetic linkage map, we used the JoinMap ver. 4.0 (Kyazma, The Netherlands). The Kosambi map function was used to calculate genetic distances between markers, and the ML (maximum likelihood) method was used as the mapping algorithm. Marker data were assigned to the linkage groups (LGs) using a minimum logarithm of odds (LOD) score of 4. The LGs were displayed using MapChart ver. 2.2 software (Voorrips 2002).
QTL analysis
The T4A × Ill-s population was used for the analysis of QTLs associated with flowering time. QTL analysis was conducted using the linkage map constructed with an early flowering E. grandiflorum accession (T4A) and a late-flowering E. exaltatum accession (Ill-s). QTL analysis was conducted using MapQTL ver. 6.0 software (van Ooijen 2002). Phenotypic evaluation of flowering time was performed on the revised duration from planting to flowering; the earliest individual was scored as zero, and various values were obtained for the 80 individuals of the F2 population. The QTL analysis was performed using interval mapping for all traits with 1000 cycles of the permutation test to determine the empirical genome-wide significance level for the LOD score. The phenotypic variance explained by each QTL was calculated using MapQTL ver. 6.0 software.
QTL validation
We analyzed the genotypes for the candidate QTL locus EGGS00213 for individuals in the T4A × Ill-s F2 population that showed extreme early- and late-flowering phenotypes (n = 11–16). A different T4A × Ill-s F2 population was used than that for the QTL analysis. We also analyzed the genotype for EGGS00213 of 17 cultivars that differed in flowering time.
Results
Genome size analysis
To select suitable Eustoma accessions for genome sequencing and construction of a genetic linkage map, we analyzed the differences in DNA content among multiple accessions. The DNA content of almost all accessions was 1.8 times that of Ipomoea nil on average. We found that genome sizes of most accessions ranged between 1.2 Gb and 1.5 Gb. For example, ‘Blue Poppy’, which was previously used to generate polyploid plants (Griesbach and Bhat 1990), and ‘Shihai’, which is among the oldest cultivars in cultivation in Japan (Fukuta 2016), exhibited 1.33 Gb and 1.32 Gb, respectively. In contrast, Oita 14 and Oita 16 exhibited notably smaller genome sizes than all other accessions (Fig. 1A). The genome size of one individual of ‘Glory Pink’ surprisingly exhibited 2.81 Gb (data not shown), whereas the sizes of two different individuals exhibited 1.33 Gb, which suggested that genome duplication occurs very rarely in Eustoma.
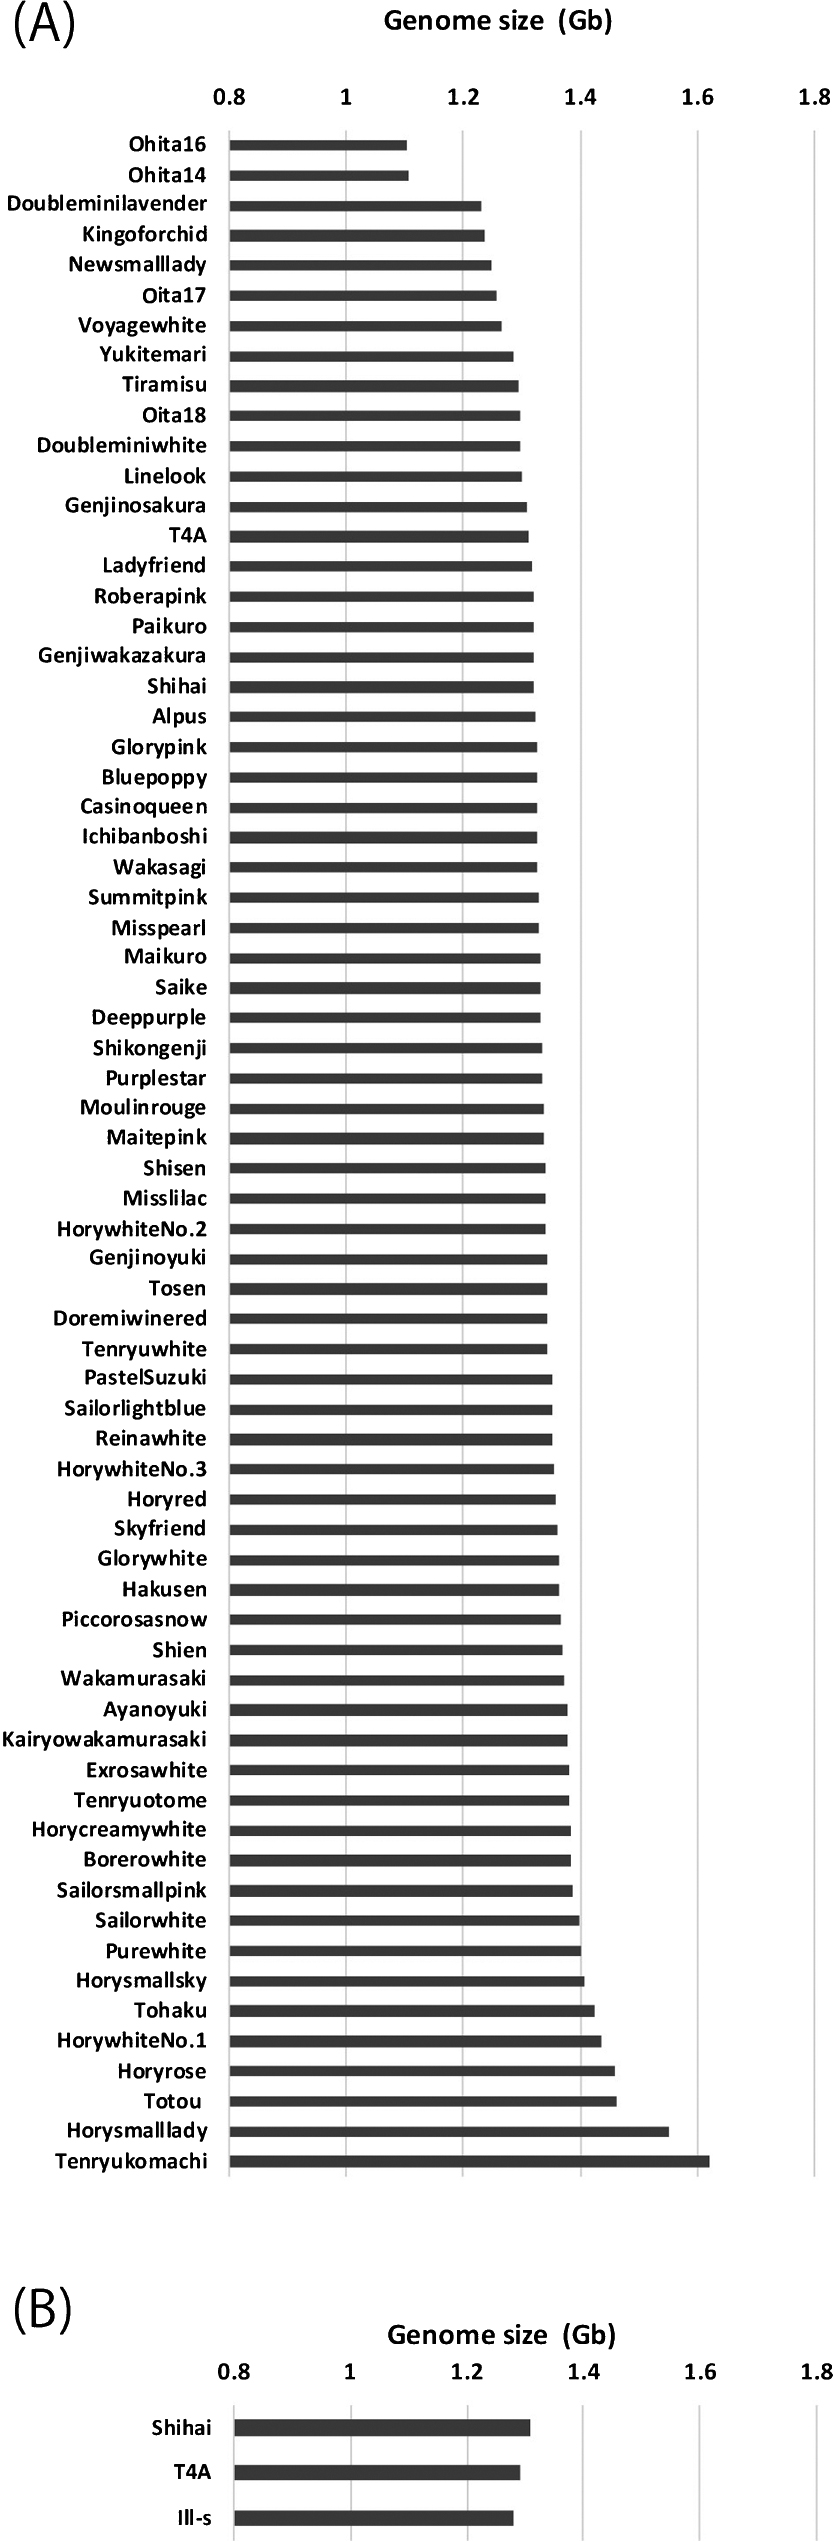
We expressed the DNA indices of ‘Shihai’, ‘T4A’, and ‘Ill-s’ as a ratio of the diploid Ipomoea nil ‘Tokyokokei’ used as a DNA standard (in experiment 2). The draft genome sequence of diploid Ipomoea nil ‘Tokyokokei’ has been previously reported and the genome size was approximately 750 Mb (Hoshino et al. 2016). The predicted genome sizes of ‘Shihai’, ‘T4A’, and ‘Ill-s’ were consistently ca. 1.3 Gb (Fig. 1B).
Sequencing and de novo sequence assembly
The sources of the genomic shotgun sequences were obtained from the model accession ‘Shihai’, which is the oldest cultivar in Japan and has a moderate genome size. A total of 555,017,416 bp (555 Mb) raw data, comprising 1,415,511 reads, was generated. To remove duplicated reads, de novo sequence assembly was conducted using Newbler software. As a result, 728,980 unigenes, consisting of 48,636 contigs (at least 100 bp in length) and 680,344 singletons, were obtained (Table 1). The unigene length ranged from 100 to 19,843 bp and the mean contig length was 434.9 bp.
Table 1.
Results of sequencing and de novo assembly
| Genome sequencing by Roche 454 GS FLX |
|
| Total reads |
1,415,511 |
| Total bases |
555,017,416 |
| Genome assembly by Newbler |
|
| #contigs (>=100 bp) |
48,636 |
| Total bases |
21,153,566 |
| N50 contig size |
339 |
| Average contig size |
434.9 |
| Maximum contig size |
19,843 |
| #singleton reads |
680,344 |
The constructed unigenes were used as inputs for an SSR search using the criteria described in Materials and Methods. We identified 8263 SSRs equal to or longer than 18 bp. Approximately half of all contigs comprised a dinucleotide repeat sequence (Supplemental Fig. 2). Four high-frequency motifs are listed in Table 2. The SSRs were included in the non-redundant 7514 contigs. Primers were designed after ensuring that SSRs were located between flanking regions of sufficient length and provide space for primer design. We identified 3990 primer sets (hereafter termed EGGS) before excluding non-unique primer pairs using a BLAST search against the nucleotide sequence of contigs. Ultimately, we designated 2182 primer pairs with the prefix “EGU”, with at least one primer showing no other BLAST hit.
Table 2.
List of top four frequent repeats
| Unit size |
motif |
loci |
| 2 |
AT/AT |
1384 |
| TA/TA |
753 |
| CA/TG |
540 |
| AC/GT |
519 |
| 3 |
ATC/GAT |
302 |
| ACA/TGT |
251 |
| AGA/TCT |
242 |
| GAA/TTC |
212 |
| 4 |
CATA/TATG |
155 |
| ATAC/GTAT |
103 |
| AAAT/ATTT |
61 |
| ACAT/ATGT |
60 |
| 5 |
AACAT/ATGTT |
65 |
| AAAAT/ATTTT |
29 |
| ATGTC/GACAT |
29 |
| AATAA/TTATT |
27 |
| 6 |
CATATA/TATATG |
18 |
| TACATA/TATGTA |
15 |
| ATATAC/GTATAT |
10 |
| TCAGAA/TTCTGA |
10 |
The accessions ‘T4A’ and selfed progeny of ‘Illumiblue’, which show distinct mean flowering times, were used for SSR screening for marker development. A total of 278 codominant primer pairs, designated with the prefix “EGF”, were selected from the EGU primers as polymorphic markers between the parents. Based on the results of a chi-square test, 20, 6, and 6 markers in the groups of EGF markers showed distorted segregation at the 5%, 1%, and 0.1% significance levels, respectively.
Construction of the genetic linkage map
We constructed a linkage map using a minimum LOD score of 4. The map consisted of 269 loci expanded to 40 linkage groups (LGs) (Fig. 2). Nine loci belonging to EGF markers were ungrouped in this study. We designated the 269 primer pairs with the prefix “EGGS”.
The total map length was 1592.6 cM, with an average distance of 5.9 cM. The length of individual LGs ranged from 151.3 cM (LG TI_1) to 1.3 cM (LG TI_40), with an average length of 39.8 cM. The highest number of loci per LG was 15 in LG TI_9, and the lowest was 2 in TI_37 and TI_38. The largest distance between loci was 35.3 cM, in LG TI_2 between EGGS00096 and EGGS00329 (Fig. 2). The average locus interval ranged from 12.0 (LG TI_3) to 0.3 (LG TI_40). The 237 loci segregated according to the expected 1:2:1 ratio.
Mapping of QTLs associated with flowering time
To identify QTLs associated with flowering time on the T4A × Ill-s genetic linkage map (hereafter the T4A × Ill-s map), we evaluated the flowering date of the two parental accessions and the F2 progeny. When grown at 20°C, T4A plants flowered for 87 days after planting (DAP) on average. The progeny of Illumiblue exhibited a late-flowering phenotype, three individuals flowered at 235–260 DAP and other individuals did not achieve flowering at 261 DAP. We determined the genotypes for approximately 259 loci of the 80 F2 progeny, for which flowering time ranged from 94 to 234 DAP (Fig. 3A).
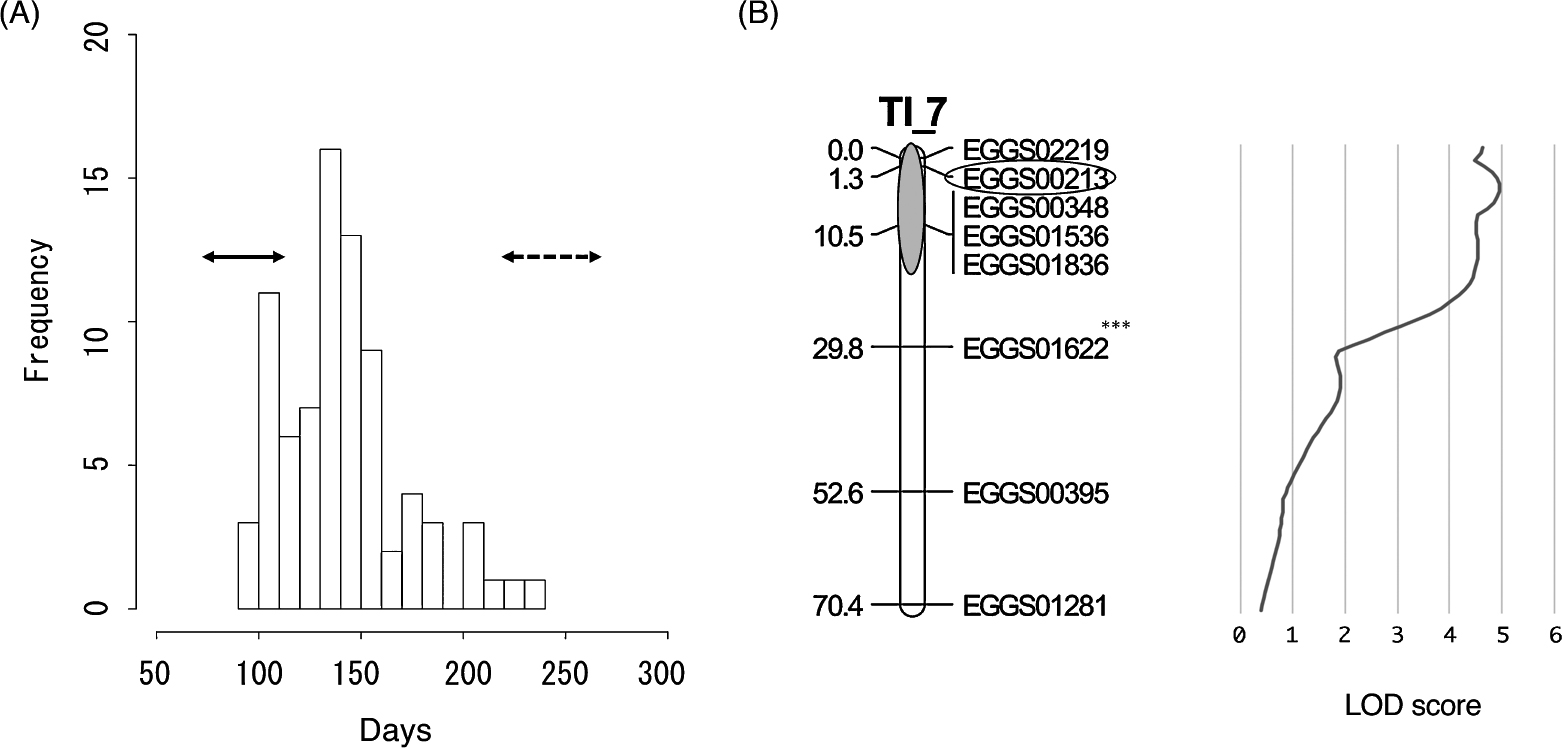
The QTL analysis identified a major QTL for the flowering time that was mapped to LG TI_7 on the T4A × Ill-s map. The QTL peak was 5.3 cM from the upper-end position (Fig. 3B). No other QTL with an LOD score higher than 3.7 was detected, which was the minimum LOD score after 1000 permutation tests. The closest marker to the QTL that showed a major effect was EGGS00213 (Fig. 3B). The mean flowering duration in 22 F2 lines homozygous for the T4A allele at the EGGS00213 locus was 120.2 days, versus 146.4 days in the 43 heterozygous individuals and 161.1 days in 15 individuals homozygous for the Ill-s allele. The mean flowering time of individuals harboring the T4A allele was significantly different from that of individuals harboring the Ill-s allele (p < 0.001) and their heterozygote (p < 0.01). EGGS00213 accounted for 27% of the total phenotypic variance. The polymorphism of EGGS00213 for T4A and Ill-s is shown in Table 3.
Table 3.
Information on the polymorphic SSR marker linked to the PFE1 locus for two
Eustoma accessions
| Locus |
Left Primer sequence |
Right Primer sequence |
Repeat motif |
The size of amplified flagment (bp) |
| EGGS00213 |
ACATCCCAACTCAACAAGTGC |
CATTTGGCTGATGACCCTCT |
AAAAC |
T4A |
Ill-s |
| 258 |
263 |
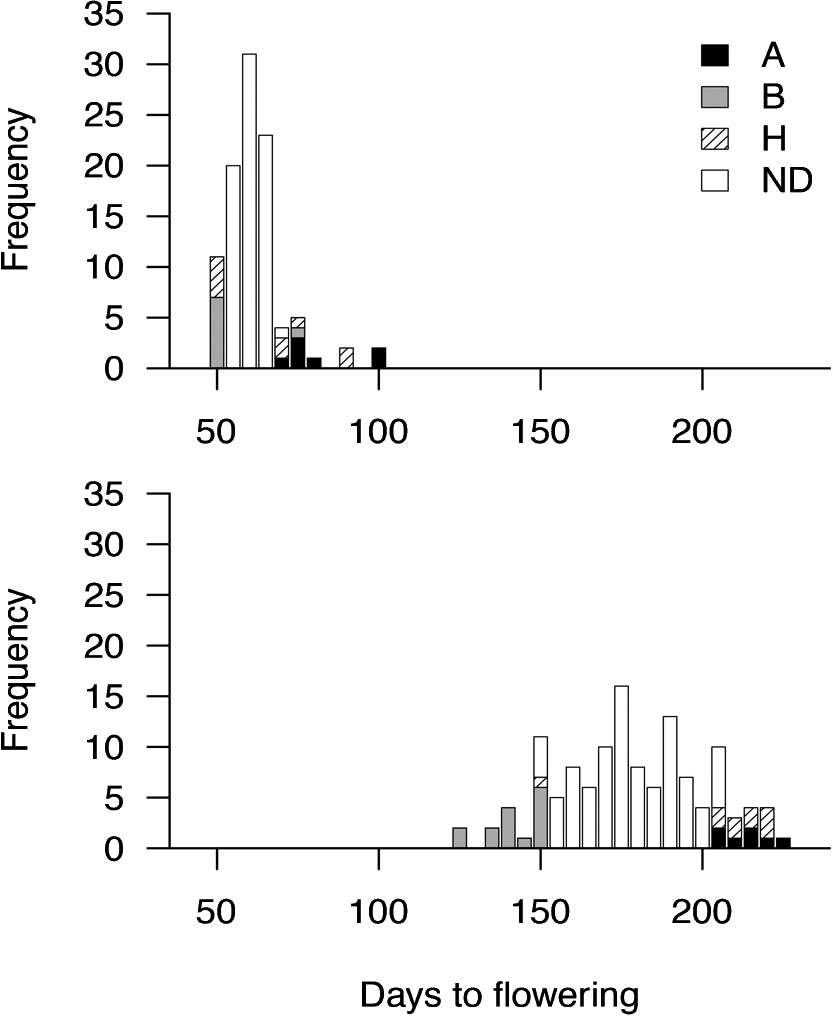
To validate the effects of the identified QTL on flowering time, we conducted two experiments. First, a repetitive evaluation of flowering time for an F2 population was conducted. Variation in flowering time was influenced by season (Fig. 4). For example, when planted in the hot season, T4A flowered at 51 DAP on average and Ill-s flowered at 121 DAP. When planted in the cool season, T4A flowered at 118 DAP on average and Ill-s flowered at 263 DAP. Flowering time for F2 progenies ranged from 47 to 100 DAP in the hot season and from 125 to 222 DAP in the cool season (Fig. 4). Genotypic analysis of EGGS0213, closest to the QTL, revealed that individuals exhibiting an extreme early flowering phenotype showed a high frequency of T4A-type genotypes in both seasons (Fig. 4), whereas individuals exhibiting an extreme late-flowering phenotype tended to show a high frequency of Ill-s-type genotypes. The mean flowering time of individuals harboring the T4A allele was significantly different from that of individuals harboring the Ill-s allele and their heterozygotes in the hot season (p < 0.05) and cool season (p < 0.001).
Second, we analyzed the EGGS00213 genotype of 17 cultivars that differed in flowering time. The node of the first flower was assessed as flowering time. The cultivars carrying the Ill-s allele at the EGGS00213 locus flowered substantially later than the cultivars carrying the T4A allele (Fig. 5). The node of the first flower of cultivars harboring the T4A allele was 22.9 ± 5.0, and for those carrying the Ill-s allele was 30.3 ± 5.8, except for Illumiwhite, which continued to bear leaves. The node of the first flower of heterozygotes was 20.5 ± 4.4, which was statistically different from that harboring the homozygote allele Ill-s (p < 0.05). These results demonstrated that EGGS00213 could be used to discriminate distinct flowering times in Eustoma. Lastly, we designated this novel QTL for flowering time as the perpetual flowering of Eustoma (PFE1).
Discussion
Structure and diversity of the Eustoma genome
We constructed the first genetic linkage map for Eustoma. Marker-assisted selection is a powerful tool for the early selection of progeny and for breeding management. Although almost all commercial cultivars of lisianthus are derived from E. grandiflorum, an intraspecific genetic map, which has not yet been developed for E. grandiflorum, is relatively less advanced because of limited genetic diversity and low polymorphism. Therefore, the construction of intersubspecific genetic maps using E. grandiflorum and E. exaltatum is an effective method for genetic analysis in Eustoma, similar to other plant species.
In this study, we constructed a linkage map using a population derived from the progeny of ‘T4A’, (E. grandiflorum) and ‘Ill-s’, which shows some characteristics of E. exaltatum such as small petals. To date, the ploidy level and chromosome number of Eustoma have been controversial (Barba-Gonzalez et al. 2015, Griesbach and Bhat 1990, Rork 1949). The present finding that the genotypic ratio of each marker was consistent with a 1:2:1 ratio suggested that the ploidy level of Eustoma is diploid. The genetic linkage map constructed from the progeny between ‘T4A’ and ‘Ill-s’ included 40 LGs. Some LGs did not include a sufficient number of markers; therefore, to obtain sufficient evidence to conclude that the basic chromosome number of Eustoma is 36, further development of polymorphic markers based on SSRs and SNPs, and linkage analysis with an increased number of markers is needed. The study for characterizing aneuploidies might also be required since the genome sizes of some accessions deviated from the standard.
Consistent with the results of Lindsay et al. (2004), the genome size of most accessions analyzed was predicted to be 1.3–1.4 Gb. The cultivars currently grown produce large, showy corollas and display attractive flower colors, but these traits have been enhanced from those of the wild Eustoma species. Therefore, we chose the early selected cultivar ‘Shihai’ as a representative genotype for genome sequencing.
We ultimately detected 278 SSR markers that exhibited polymorphism between ‘T4A’ and ‘Ill-s’ and their progeny. The accessions ‘T4A’ and ‘Ill-s’ exhibited certain characteristics typical of E. grandiflorum and E. exaltatum, respectively. The predicted genome sizes of ‘T4A’ and ‘Ill-s’ were not divergent from that of ‘Shihai’, which was commercially available before E. grandiflorum breeding efforts focused on F1 hybrid seed production in Japan. Considering these results, ‘Shihai’ is appropriate for genome sequencing analysis and marker development. We anticipated that E. grandiflorum ‘T4A’, which has comparatively large corolla lobes, shows more similar genomic traits to ‘Shihai’ than to ‘Ill-s’. In particular, the length of fragments amplified with SSR markers when ‘T4A’ genomic DNA was used as the template was consistent with the predicted size from the sequence information for ‘Shihai’ (data not shown). In contrast, the length of fragments amplified from ‘Ill-s’ genomic DNA was frequently inconsistent. Thus, it is considered that the SSR markers identified in the present study could provide insight into the discovery of genetic diversity in Eustoma.
QTL analysis for flowering time
Early flowering cultivars of lisianthus allow growers in Japan to achieve flower forcing during cultivation without the requirement for high-cost temperature control. In contrast, late-flowering cultivars have been utilized to achieve both a luxuriant stem height and short-duration crop through forcing in the Netherlands. In the present study, we detected a novel QTL for flowering time, PFE1. The accession ‘T4A’ and selfed progeny of ‘Illumiblue’ showed distinct differences in characteristics such as mean flowering time and abundance of flowers. This phenotypic diversity suggests that the two accessions may show numerous genetic polymorphisms, and thus, evaluation of genetic differences in the F2 population would provide insight into QTLs associated with flowering traits in Eustoma.
The EGF markers were reproducibly genotyped in the F2 population, and EGGS00213 cosegregated with flowering time in the F2 population. We verified that the EGGS00213 marker at the locus PFE1 could discriminate for the trait of flowering time (Fig. 4). Repeated experiments resulted in similar results; individuals exhibiting an extremely early flowering phenotype showed a high frequency of T4A-type genotypes. These findings indicate that EGGS00213 could be used as a marker for flowering time in any season and geographic area to some degree. The EGGS00213 marker, however, only explained up to 27% of the total variance in flowering time. This suggests that additional genetic factors to PFE1 control flowering time in Eustoma.
The genotypes of 17 Eustoma cultivars could be classified as T4A-type, Ill-s type, or heterozygous alleles using the EGGS00213 marker. The cultivars that showed a T4A or Ill-s genotype tended to present early- and late-flowering phenotypes, respectively. The genotypes were consistent with the timing of flowering apart from two or more exceptions (i.e., Tsukushinoyuki). Possible reasons for this discordance are that other genetic factor(s) control flowering time in addition to PFE1, or that the EGGS00213 marker is not physically close to PFE1. Further screening of genetic variants focusing on the identification of markers associated with flowering time can enable efficient breeding in Eustoma, and the development of these additional markers can contribute to the breeding of a variety of cultivars with diverse blooming times.
Author Contribution Statement
NF planned the research and maintained each Eustoma accession. KK1 and HY performed the genome size analysis. KK1, TI, MK, RI, HN, YK, HK, and KK2 performed NGS data processing. KK1, MY, and TH performed SSR marker analysis and QTL analysis. KK1 and MY wrote the manuscript.
Acknowledgments
We are grateful to Miyoshi Co., Takii Seed Co., and Oita prefecture for providing seeds of Eustoma ‘T series’, ‘Blue Poppy’, and ‘Oita series’, respectively. We thank J. Koshizuka, K. Matsumoto, and M. Nakamura for their technical assistance.
Literature Cited
- Azuma, M., R. Morimoto, M. Hirose, Y. Morita, A. Hoshino, S. Iida, Y. Oshima, N. Mitsuda, M. Ohme-Takagi and K. Shiratake (2016) A petal-specific InMYB1 promoter from Japanese morning glory: A useful tool for molecular breeding of floricultural crops. Plant Biotechnol. J. 14: 354–363.
- Barba-Gonzalez, R., E. Tapia-Campos, T.Y. Lara-Bañuelos, V. Cepeda-Cornejo, P. Dupre and G. Arratia-Ramirez (2015) Interspecific hybridization advances in the genus Eustoma. Acta Hortic. 1097: 93–100.
- Brownstein, M.J., J.D. Carpten and J.R. Smith (1996) Modulation of non-templated nucleotide addition by Taq DNA polymerase: Primer modifications that facilitate genotyping. Biotechniques 20: 1004–1010.
- Chanoca, A., N. Kovinich, B. Burkel, S. Stecha, A. Bohorquez-Restrepo, T. Ueda, K.W. Eliceiri, E. Grotewold and M.S. Otegui (2015) Anthocyanin vacuolar inclusions form by a microautophagy mechanism. Plant Cell 27: 2545–2559.
- Coates, B.S., D.V. Sumerford, N.J. Miller, K.S. Kim, T.W. Sappington, B.D. Siegfried and L.C. Lewis (2009) Comparative performance of single nucleotide polymorphism and microsatellite markers for population genetic analysis. J. Hered. 100: 556–564.
- Fukuta, N. (2016) Hanano hinshu kairyo no nihonshi, Yushokan, Tokyo, p. 289 (in Japanese).
- Gramazio, P., J. Prohens, D. Borràs, M. Plazas, F.J. Herraiz and S. Vilanova (2017) Comparison of transcriptome-derived simple sequence repeat (SSR) and single nucleotide polymorphism (SNP) markers for genetic fingerprinting, diversity evaluation, and establishment of relationships in eggplants. Euphytica 213: 264.
- Griesbach, R.J. and R.N. Bhat (1990) Colchicine-induced polyploidy in Eustoma grandiflorum. HortScience 25: 1284–1286.
- Harbaugh, B.K., M.S. Roh, R.H. Lawson and B. Pemberton (1992) Rosetting of Lisianthus cultivars exposed to high temperature. HortScience 27: 885–887.
- Hisamatsu, T., M. Koshioka, N. Oyama and L.N. Mander (1999) The relationship between endogenous gibberellins and rosetting in Eustoma grandiflorum. J. Japan. Soc. Hort. Sci. 68: 527–533.
- Hoshino, A., V. Jayakumar, E. Nitasaka, A. Toyoda, H. Noguchi, T. Itoh, T. Shin-I, Y. Minakuchi, Y. Koda, A. Nagano et al. (2016) Genome sequence and analysis of the Japanese morning glory Ipomoea nil. Nat. Commun. 7: 13295.
- Inghelandt, D.V., A.E. Melchinger, C. Lebreton and B. Stich (2010) Population structure and genetic diversity in a commercial maize breeding program assessed with SSR and SNP markers. Theor. Appl. Genet. 120: 1289–1299.
- Ishimori, M. and S. Kawabata (2014) Conservation and diversification of floral homeotic MADS-box genes in Eustoma grandiflorum. J. Japan. Soc. Hort. Sci. 83: 172–180.
- Islam, N., G.G. Patil and H.R. Gislerød (2005) Effect of photoperiod and light integral on flowering and growth of Eustoma grandiflorum (Raf.) Shinn. Sci. Hortic. 103: 441– 451.
- Iwata, H., A. Gaston, A. Remay, T. Thouroude, J. Jeauffre, K. Kawamura, L.H. Oyant, T. Araki, B. Denoyes and F. Foucher (2012) The TFL1 homologue KSN is a regulator of continuous flowering in rose and strawberry. Plant J. 69: 116–125.
- Kaur, S., N.O. Cogan, L.W. Pembleton, M. Shinozuka, K.W. Savin, M. Materne and J.W. Forster (2011) Transcriptome sequencing of lentil based on second-generation technology permits large-scale unigene assembly and SSR marker discovery. BMC Genomics 12: 265.
- Kinoshita, A. and R. Richter (2020) Genetic and molecular basis of floral induction in Arabidopsis thaliana. J. Exp. Bot. 71: 2490–2504.
- Kitamoto, N., K. Nishikawa, Y. Tanimura, S. Urushibara, T. Matsuura, S. Yokoi, Y. Takahata and S. Yui (2017) Development of late-bolting F1 hybrids of Chinese cabbage (Brassica rapa L.) allowing early spring cultivation without heating. Euphytica 213: 292.
- Li, K.H., T.H. Chung, C.J. Hou and C.H. Yang (2015) Functional analysis of the FT homolog from Eustoma grandiflorum reveals its role in regulating A and C functional MADS box genes to control floral transition and flower formation. Plant Mol. Biol. Rep. 33: 770–782.
- Lindsay, G.C., M.E. Hopping and I.E.W. O’Brien (2004) Detection of protoplast-derived DNA tetraploid Lisianthus (Eustoma grandiflorum) plants by leaf and flower characteristics and by flow cytometry. Plant Cell Tissue Organ Cult. 38: 53–55.
- Nakano, Y. (2017) Effect of acetosyringone on Agrobacterium-mediated transformation of Eustoma grandiflorum leaf disks. Jpn. Agric. Res. Q. 51: 351–355.
- Nakano, Y., H. Kawashima, T. Kinoshita, H. Yoshikawa and T. Hisamatsu (2011) Characterization of FLC, SOC1 and FT homologs in Eustoma grandiflorum: effects of vernalization and post-vernalization conditions on flowering and gene expression. Physiol. Plant. 141: 383–393.
- Neeraja, C.N., R. Maghirang-Rodriguez, A. Pamplona, S. Heuer, B.C.Y. Collard, E.M. Septiningsih, G. Vergara, D. Sanchez, K. Xu, A.M. Ismail et al. (2007) A marker-assisted backcross approach for developing submergence-tolerant rice cultivars. Theor. Appl. Genet. 115: 767–776.
- Nielsen, K., S.C. Deroles, K.R. Markham, M.J. Brandley, E. Podivinsky and D. Manson (2002) Antisense flavonol synthase alters copigmentation and flower color in lisianthus. Mol. Breed. 9: 217–229.
- Ohkawa, K., A. Kano, K. Kanematsu and M. Korenaga (1991) Effects of air temperature and time on rosette formation in seedlings of Eustoma grandiflorum (Raf.) Shinn. Sci. Hortic. 48: 171–176.
- Pergola, G., N. Oggiano and P. Curir (1992) Effects of seed and seedling temperature conditioning on planting, bolting, and flowering in Eustoma russellianum. Acta Hortic. 314: 173– 177.
- Rork, C.L. (1949) The chromosome number of Gentianaceae. Am. J. Bot. 36: 657–701.
- Schuelke, M. (2000) An economic method for the fluorescent labeling of PCR fragments. Nat. Biotechnol. 18: 233–234.
- Shimizu, K., N. Ohnishi, N. Morikawa, A. Ishigami, S. Otake, I.O. Rabah, Y. Sakata and F. Hashimoto (2011) A 94-bp deletion of anthocyanidin synthase gene in acyanic flower lines of lisianthus [Eustoma grandiflorum (Raf.) Shinn.]. J. Japan. Soc. Hort. Sci. 80: 434–442.
- Tang, S., V.K. Kishore and S.J. Knapp (2003) PCR-multiplexes for a genome-wide framework of simple sequence repeat marker loci in cultivated sunflower. Theor. Appl. Genet. 107: 6–19.
- Turner, B.L. (2014) Taxonomic overview of Eustomia (Gentianaceae). Phytologia 96: 7–11.
- Ushio, A., H. Hara and N. Fukuta (2014) Promotive effect of CO2 enrichment on plant growth and flowering of Eustoma grandiflorum (Raf.) Shinn. under a winter culture regime. J. Japan. Soc. Hort. Sci. 83: 59–63.
- Van Ooijen, J.W. (2002) MapQTL® 6, Software for the mapping of quantitative trait loci in experimental populations of diploid species. Kyazma, B.V. (ed.) Wageningen, The Netherlands.
- Voorrips, R.E. (2002) MapChart: software for the graphical presentation of linkage maps and QTLs. J. Hered. 93: 77–78.
- Weber, J.L. and P.E. May (1989) Abundant class of human DNA polymorphism which can be typed using the polymerase chain reaction. Am. J. Hum. Genet. 44: 388–396.
- Yang, T., J.Y. Jiang, M. Burlyaeva, J.G. Hu, C.J. Coyne, S. Kumar, R. Redden, X.L. Sun, F. Wang, J.W. Chang et al. (2014) Large-scale microsatellite development in grasspea (Lathyrus sativus L.) an orphan legume of the arid areas. BMC Plant Biol. 14: 65.
- Zaccai, M. and N. Edri (2002) Floral transition in lisianthus (Eustoma grandiflorum). Sci. Hortic. 95: 333–340.
- Zhang, H.-B., X. Zhao, X. Ding, A.H. Paterson and R.A. Wing (1995) Preparation of megabase‐size DNA from plant nuclei. Plant J. 7: 175–184.
- Zhang, Z.-H., K. Wang, L. Guo, Y.J. Zhu, Y.-Y. Fan, S.-H. Cheng and J.Y. Zhuang (2012) Pleiotropism of the photoperiod-insensitive allele of Hd1 on heading date, plant height and yield traits in rice. PLoS ONE 7: e52538.
- Zhang, Z.-H., Y.J. Zhu, S.L. Wang, Y.Y. Fan and J.Y. Zhuang (2019) Importance of the interaction between heading date genes Hd1 and Ghd7 for controlling yield traits in rice. Int. J. Mol. Sci. 20: 516–528.
- Zhu, H., D. Senalik, B.H. McCown, E.L. Zeldin, J. Speers, J. Hyman, N. Bassil, K. Hummer, P.W. Simon and J.E. Zalapa (2012) Mining and validation of pyrosequenced simple sequence repeats (SSRs) from American cranberry (Vaccinium macrocarpon Ait.). Theor. Appl. Genet. 124: 87–96.


