Abstract
In soybean [Glycine max (L.) Merrill], the genetic analysis of seed yield is important to aid in the breeding of high-yielding cultivars. Seed yield is a complex trait, and the number of quantitative trait loci (QTL) involved in seed yield is high. The aims of this study were to identify QTL associated with seed yield and validate their effects on seed yield using near-isogenic lines. The QTL analysis was conducted using a recombinant inbred line population derived from a cross between Japanese cultivars ‘Toyoharuka’ and ‘Toyomusume’, and eight seed yield-associated QTL were identified. There were significant positive correlations between seed yield and the number of favorable alleles at QTL associated with seed yield in the recombinant inbred lines for three years. The effects of qSY8-1, a QTL promoting greater seed yield, was validated in the Toyoharuka background. In a two-year yield trial, the 100-seed weight and seed yield of Toyoharuka-NIL, the near-isogenic line having the Toyomusume allele at qSY8-1, were significantly greater than those of Toyoharuka (106% and 107%, respectively) without any change for days to flowering and maturity. Our results suggest that qSY8-1 was not associated with maturity genes, and contributed to the 100-seed weight.
Introduction
Soybean [Glycine max (L.) Merrill] is an important protein and oil crop. The genetic analysis of seed yield is important to aid in the breeding of high-yielding cultivars. Seed yield is a complex trait. The number of bi-parental quantitative trait loci (QTL) for seed yield in the soybean database SoyBase (Grant et al. 2010, https://www.soybase.org/) was 165 in June 2020. Many QTL have been detected only in a single population, and the effects of each QTL are small in many cases. In soybean, seed yield consists of three main components: pod number, seed number per pod, and 100-seed weight. The genetic factors that affect these yield components in soybean have been reported (Fujii et al. 2018, Hoeck et al. 2003, Hyten et al. 2004, Kato et al. 2014, Yan et al. 2014). In particular, numerous QTL associated with 100-seed weight have been reported, and over 250 QTL are registered in the SoyBase.
Lodging tolerance is an important trait that affects yield in soybean (Cooper 1971, Weber and Fehr 1966, Woods and Swearingin 1977). In our previous study, a major QTL for lodging score on chromosome (Chr) 19, qLS19-1, was identified using recombinant inbred lines (RILs) from a cross between ‘Toyoharuka’ and ‘Toyomusume’ (Yamaguchi et al. 2014). The Toyoharuka allele at qLS19-1 had positive effects on lodging tolerance (Yamaguchi et al. 2014). Using the same RIL population, Ohnishi et al. (2011) detected a QTL for tolerance to seed coat discoloration induced by chilling temperature, and Ikeda et al. (2009) detected a QTL for chilling tolerance at the flowering stage. Both QTL are located in the proximal region of the I locus, and the Toyoharuka allele, which was designate Ic allele, had positive effects on chilling tolerance. These two loci would be useful to improve seed quality and seed yield with reducing lodging. The aims of this study were to identify QTL associated with seed yield using a RIL population derived from a cross between Toyoharuka and Toyomusume, and to validate their effects on seed yield using near-isogenic lines. We also discuss the additional use of qLS19-1 and Ic alleles with seed yield QTL detected in this study for further soybean breeding program.
Materials and Methods
Plant materials
An RIL population (192 lines) was bred using the single-seed descent method from a Toyoharuka × Toyomusume cross (Ikeda et al. 2009, Ohnishi et al. 2011). The parent cultivars and RILs were bred at the Tokachi Agricultural Experiment Station, Memuro, Hokkaido, Japan. They all have the determinate growth habit phenotype. The generations of the RIL population were F8 in 2009, F9 in 2011, and F10 in 2012. Toyoharuka-NIL, the near-isogenic line for qSY8-1 (Table 1) derived from Toyoharuka (recurrent parent) × Toyomusume (donor parent of qSY8-1), was bred by the backcrossing method using the Ic marker, the marker closest to this QTL, as described previously (Yamaguchi et al. 2019). The generations of Toyoharuka-NIL were BC4F4 and BC4F5 in 2010 and 2011, respectively.
Table 1.
Correlation coefficients between seed yields or 100-seed weights of the recombinant inbred soybean lines for each pair of trial years
| Trait |
Year |
Seed yield |
|
100-seed weight |
| 2009 |
2011 |
2012 |
2009 |
2011 |
2012 |
| Seed yield |
2009 |
– |
|
|
|
0.188* |
– |
– |
| 2011 |
0.490*** |
– |
|
|
– |
0.120 |
– |
| 2012 |
0.409*** |
0.526*** |
– |
|
– |
– |
0.164* |
| 100-seed weight |
2009 |
0.188* |
– |
– |
|
– |
|
|
| 2011 |
– |
0.120 |
– |
|
0.642*** |
– |
|
| 2012 |
– |
– |
0.164* |
|
0.520*** |
0.636*** |
– |
* Significant at P < 0.05.
*** Significant at P < 0.001.
The field tests in 2009 and 2011 were performed at Tokachi Agricultural Experiment Station, located at latitude 42°89ʹ N and longitude 140°07ʹ E. The field test in 2012 was performed at the Central Agricultural Experiment Station, located at latitude 43°05ʹ N and longitude 141°75ʹ E. The 192 RILs were planted on 18 May in 2009, 18 May in 2011, and 22 May in 2012. Each plot consisted of one (in 2011 and 2012) or two rows (in 2009). Each RIL was planted in a plot consisting of 1.5-m rows spaced 60-cm apart, with a plant interval of 6.7 (in 2009) and 10 cm (in 2011 and 2012), resulting in plant population densities of 25.0 (in 2009) and 16.7 (in 2011 and 2012) plants m–2. The order of the RILs was randomized in each year to eliminate confounding effects from neighboring RILs. The 24 (in 2009) or 12 (in 2011 and 2012) plants in each plot were harvested by hand. Pearson’s correlation coefficient was determined between seed yields or 100-seed weights for each pair of years.
The broad-sense heritability values for seed yield and 100-seed weight were calculated using data from 2009. The environmental variance was calculated on the basis of the parental traits (four replicates). The phenotypic variance was calculated on the basis of the 170 RILs’ traits. The broad-sense heritability was calculated as follows:
Broad-sense heritability = 1 – (Environmental variance)/(Phenotypic variance).
Molecular marker analysis and linkage mapping
DNA extraction and PCR analyses of the markers were performed as described previously (Hwang et al. 2009, Sayama et al. 2010). The F6 RIL plants were used for genotyping with simple sequence repeat (SSR) markers. Polymorphisms in SSR markers were analyzed using the SSR genotyping panel system (Sayama et al. 2011). The previously reported linkage map (Yamaguchi et al. 2014) was reconstructed using 149 co-dominant markers. The computer program AntMap Ver. 1.2 (Iwata and Ninomiya 2006) was used to determine molecular linkage groups and the positions of the polymorphic markers. AntMap seeks the linear order of loci that minimizes the sum of adjacent recombination fractions or that maximizes the log likelihood of locus order.
QTL analysis for seed yield and 100-seed weight
A QTL analysis was performed using the composite interval mapping method (Zeng 1994) in QTL Cartographer version 2.5 (Wang et al. 2007). The logarithm of the odds (LOD) threshold value at the 5% probability level was calculated using 500 permutations. We defined QTL detected in different years at a similar position and having a genetic distance between QTL peaks of less than 10 cM on a Chr, as the same QTL.
Pearson’s correlation coefficient was determined between seed yield and the number of favorable alleles at each QTL associated with seed yield in the RILs in each year. In the high-yielding RILs, the percentage of favorable alleles was calculated as follows:
Rate of the favorable alleles (%) = (Number of the favorable alleles)/(Number of the favorable and unfavorable alleles) × 100.
The percentage of genomic regions originating from Toyomusume was calculated using the 149 polymorphic markers as follows:
Genomic regions originating from Toyomusume (%) = (Number of Toyomusume alleles)/(number of Toyoharuka and Toyomusume alleles) × 100.
Yield trials of Toyoharuka-NIL
The yield trials of Toyoharuka-NIL were conducted at the Tokachi Agricultural Experiment Station in 2010 and 2011. Parental cultivar Toyoharuka was used as the control. Seeds were planted on 18 May in 2010 and 17 May in 2011. Each plot consisted of three rows with lengths of 3.5 m. The plot area was 6.3 m2. These were spaced 60-cm apart with a 20-cm inter-hill having two plants per hill. This resulted in a plant population density of 16.7 plants m–2. A randomized complete block design with three replicates was used. The time of flowering was defined as the time at which more than 50% of the plants in the plot were flowering. The time of maturity was defined as the time when more than 80% of the plants defoliated and turned yellow, with pods rattling when shaken. At the time of maturity, a lodging score from 0, indicating no lodging, to 4, indicating completely lodged, was recorded for each plot. The 72 plants in each plot were harvested by hand, and total above-ground yield (including pod, stem, branch, and seed) and seed yield were recorded for each plot. Seed yield was adjusted to 15% moisture.
A combined analysis of variance was performed using the mixed model procedure of the JMP 10 statistical package (SAS Institute 2012). Statistical significance was evaluated at P ≤ 0.05, unless otherwise stated. Years and replications within year were considered random effects, whereas cultivars were considered fixed effects.
Results
Evaluation of seed yield and 100-seed weight in the RIL population
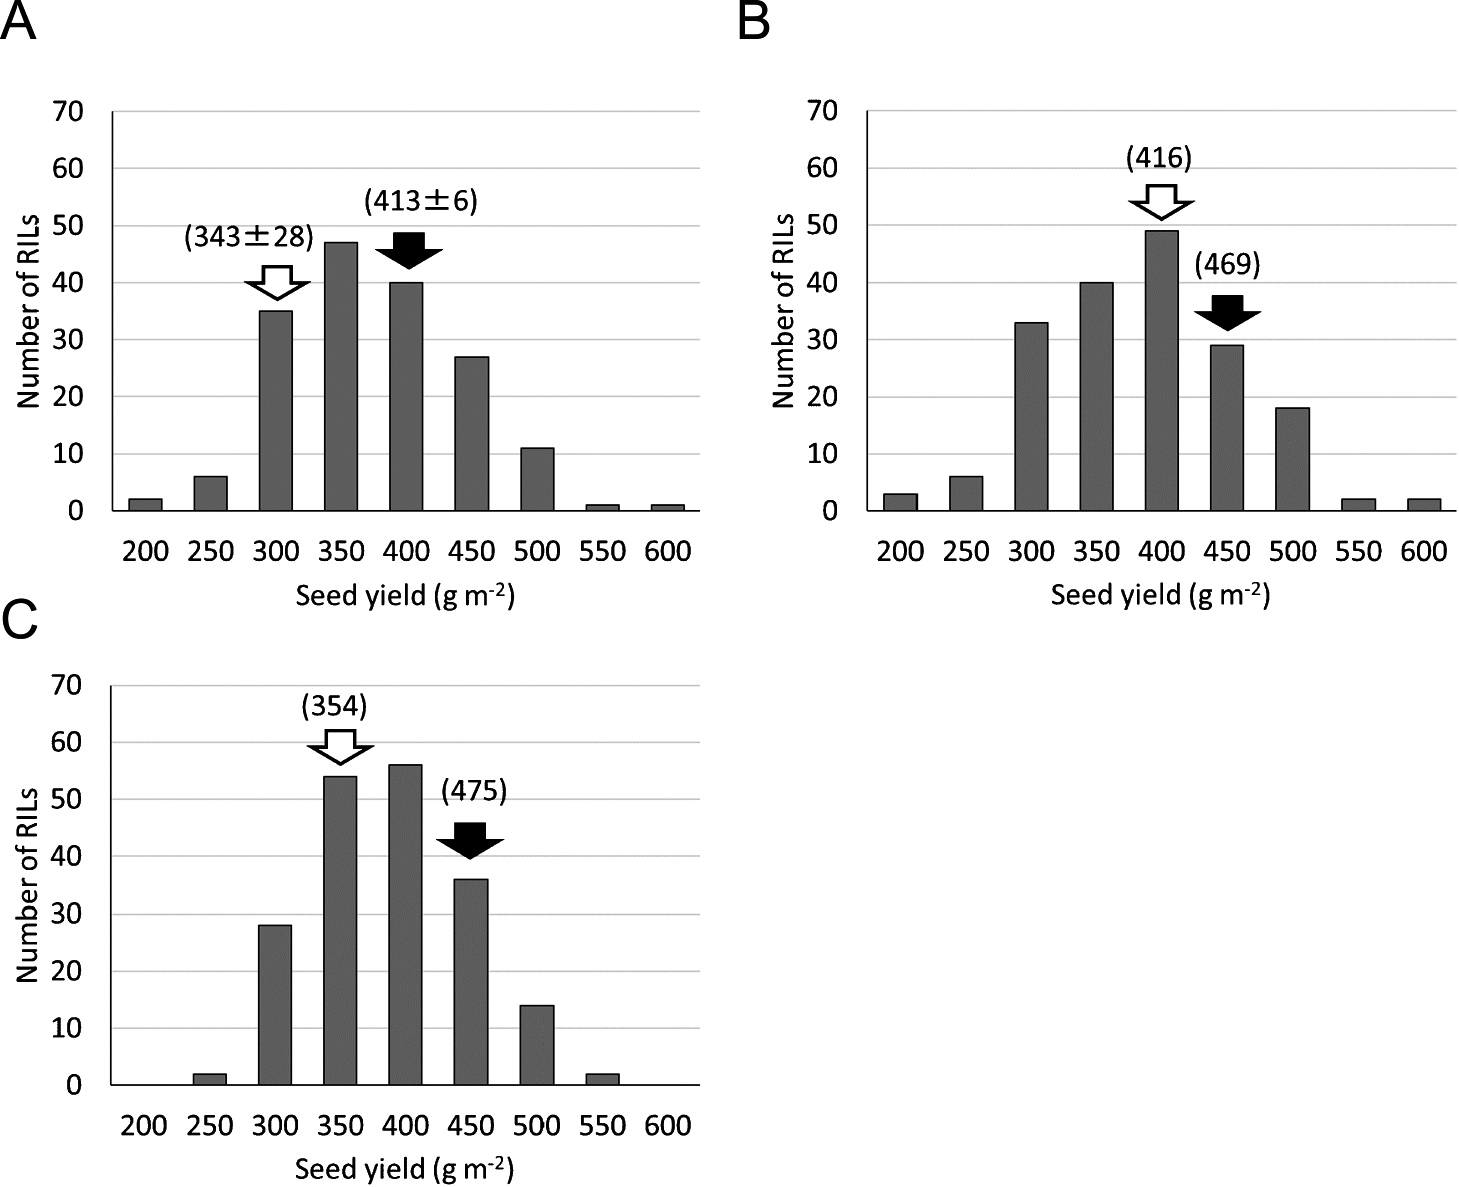
There were significant positive correlations between seed yield of the RILs in each pair of years (Table 1). The seed yields were normally distributed, and transgressive segregation occurred in each year (Fig. 1). This result indicated that it is possible to select lines producing yield greater than the parental cultivars from this population. The 100-seed weights, one yield component, were also evaluated in the RILs. There were significant positive correlations between 100-seed weights of the RILs in each pair of years (Table 1). However, there were only weak positive correlations between the seed yield and 100-seed weight in each year (Table 1). The broad-sense heritability values for seed yield and 100-seed weight were calculated as 0.91 and 0.85, respectively, indicating their high heritability levels.
QTL analysis of seed yield and 100-seed weight
The resulting genetic linkage map comprised 23 molecular linkage groups and covered 1,335 cM. Chr-8, -12 and -19 were divided into two linkage groups each, because Toyoharuka was very closely related to Toyomusume based on a clustering analysis (Hwang et al. 2008), and no polymorphic markers were found in some regions. The average number of marker loci in each molecular linkage group was 6.5, and the average distance between markers was 9.0 cM.
The results of the QTL analysis of seed yield are shown in Table 2 and Supplemental Fig. 1. In total, eight QTL were detected. The relationships between the closest marker to each QTL and seed yield in the RILs are shown in Supplemental Table 1. A QTL analysis of 100-seed weight was also performed, and 13 QTL were detected (Table 3). Only three QTL associated with 100-seed weight, qSW5-1, qSW8-1, and qSW11-1, were identified near QTL for seed yield (Tables 2, 3). This result was corroborated by a weak correlation between seed yield and 100-seed weight (Table 1). The Toyomusume alleles at qSW5-1 and qSW8-1 promoted heavier seeds, resulting in greater seed yields (Tables 2, 3). In contrast, the Toyoharuka allele at qSW11-1 promoted heavier seeds, but resulted in a low yield (Tables 2, 3).
Table 2.
Quantitative trait locus (QTL) analysis of seed yield in the recombinant inbred soybean lines
| Chra |
Year |
Location |
Position (cM) |
Nearest marker |
LODb |
R2 c (%) |
Favorable allele |
Additive effectd (g m–2) |
QTL name |
| 5 |
2011 |
Tokachi |
3.0 |
Sat_267 |
6.9 |
14.7 |
Toyomusume |
27.9 |
qSY5-1 |
|
2012 |
Central |
19.5 |
Sat_271 |
3.3 |
6.4 |
Toyomusume |
15.2 |
qSY5-2 |
| 8-1 |
2009 |
Tokachi |
44.2 |
Ic |
9.0 |
17.7 |
Toyomusume |
26.9 |
qSY8-1 |
|
2011 |
Tokachi |
40.2 |
Ic |
4.3 |
9.0 |
Toyomusume |
22.9 |
qSY8-1 |
| 11 |
2012 |
Central |
26.9 |
Satt519 |
7.0 |
15.2 |
Toyomusume |
23.3 |
qSY11-1 |
| 13 |
2009 |
Tokachi |
43.8 |
Sct_033 |
3.5 |
7.5 |
Toyoharuka |
19.4 |
qSY13-1 |
|
2011 |
Tokachi |
76.8 |
Sat_197 |
6.9 |
15.7 |
Toyoharuka |
28.9 |
qSY13-2 |
| 14 |
2009 |
Tokachi |
23.4 |
BARCSOYSSR_14_0370 |
4.0 |
7.3 |
Toyomusume |
18.9 |
qSY14-1 |
|
2012 |
Central |
23.4 |
BARCSOYSSR_14_0370 |
3.4 |
6.4 |
Toyomusume |
15.2 |
qSY14-1 |
| 18 |
2009 |
Tokachi |
6.7 |
Satt594 |
3.6 |
6.7 |
Toyomusume |
18.2 |
qSY18-1 |
a Chr, chromosome. Chr-8 was divided into two linkage groups.
b LOD, logarithm of odds determined by composite interval mapping. The LOD threshold value at the 5% probability level was 3.1 in 2009, and 3.2 in 2011 and 2012. The LOD threshold value at the 1% probability level was 4.4 in 2009, 4.1 in 2011, and 3.9 in 2012.
c Percentage phenotypic variance explained by the QTL.
d Effect of the favorable allele promoting a greater seed yield on the QTL (g m−2).
Table 3.
Quantitative trait locus (QTL) analysis of 100-seed weight in the recombinant inbred soybean lines
| Chra |
Year |
Location |
Position (cM) |
Nearest marker |
LODb |
R2 c (%) |
Favorable allele |
Additive effectd (g) |
QTL name |
| 2 |
2011 |
Tokachi |
114.7 |
Sat_237 |
3.3 |
1.0 |
Toyomusume |
0.3 |
qSW2-1 |
| 5 |
2011 |
Tokachi |
12.5 |
Satt200 |
3.6 |
3.0 |
Toyomusume |
0.5 |
qSW5-1 |
| 8-1 |
2009 |
Tokachi |
45.2 |
Ic |
8.2 |
4.5 |
Toyomusume |
0.7 |
qSW8-1 |
| 9 |
2009 |
Tokachi |
1.0 |
GMES5734 |
8.1 |
4.4 |
Toyoharuka |
0.5 |
qSW9-1 |
| 9 |
2009 |
Tokachi |
23.2 |
Satt264 |
8.0 |
3.4 |
Toyomusume |
0.4 |
qSW9-2 |
| 10 |
2009 |
Tokachi |
7.0 |
Gm10.1.1 |
8.8 |
9.0 |
Toyomusume |
0.8 |
qSW10-1 |
|
2012 |
Central |
7.9 |
Gm10.1.1 |
4.0 |
7.3 |
Toyomusume |
0.7 |
qSW10-1 |
| 11 |
2011 |
Tokachi |
17.9 |
GMES0027 |
4.3 |
9.7 |
Toyoharuka |
0.9 |
qSW11-1 |
|
2009 |
Tokachi |
21.9 |
GMES0027 |
9.8 |
8.6 |
Toyoharuka |
0.7 |
qSW11-1 |
|
2012 |
Central |
29.9 |
Satt519 |
9.5 |
22.4 |
Toyoharuka |
1.4 |
qSW11-1 |
| 12-2 |
2009 |
Tokachi |
1.0 |
Sat_206 |
3.5 |
2.3 |
Toyomusume |
0.4 |
qSW12-1 |
| 13 |
2009 |
Tokachi |
57.8 |
Sat_313 |
7.2 |
3.6 |
Toyoharuka |
0.6 |
qSW13-1 |
| 14 |
2012 |
Central |
69.2 |
Satt556 |
3.7 |
7.5 |
Toyoharuka |
0.8 |
qSW14-1 |
|
2011 |
Tokachi |
92.0 |
Sat_424, Satt726 |
4.5 |
4.7 |
Toyoharuka |
0.6 |
qSW14-2 |
| 19-1 |
2011 |
Tokachi |
19.5 |
Sat_301 |
3.3 |
2.2 |
Toyoharuka |
0.5 |
qSW19-1 |
| 19-2 |
2011 |
Tokachi |
20.8 |
BARCSOYSSR_19_1286 |
4.2 |
5.3 |
Toyoharuka |
0.6 |
qSW19-2 |
a Chr, chromosome. Chr-8, 12, and -19 were divided into two linkage groups for each.
b LOD, logarithm of odds determined by composite interval mapping. The LOD threshold value at the 5% probability level was 7.1 in 2009, 3.3 in 2011, and 3.2 in 2012. The LOD threshold value at the 1% probability level was 8.3 in 2009, and 3.9 in 2011 and 2012.
c Percentage phenotypic variance explained by the QTL.
d Effect of the favorable allele promoting a heavier seed on the QTL (g).
There were significant positive correlations between seed yield and the number of favorable alleles at QTL associated with seed yield in the RILs for three years (Fig. 2). The 12 RILs produced higher yields than their parental cultivars in each year (Table 4), and they were considered as stable high-yielding RILs. In the high-yielding RILs, the rate of the favorable alleles at qSY14-1 (36%) was low compared to the other QTL (64–92%) (Table 4). This result indicates that the effect of qSY14-1 may be low or unstable in the high-yielding RILs. In contrast, the high rates of the favorable alleles at qSY5-1 and qSY11-1 suggest that these QTL may be useful for high-yielding breeding.
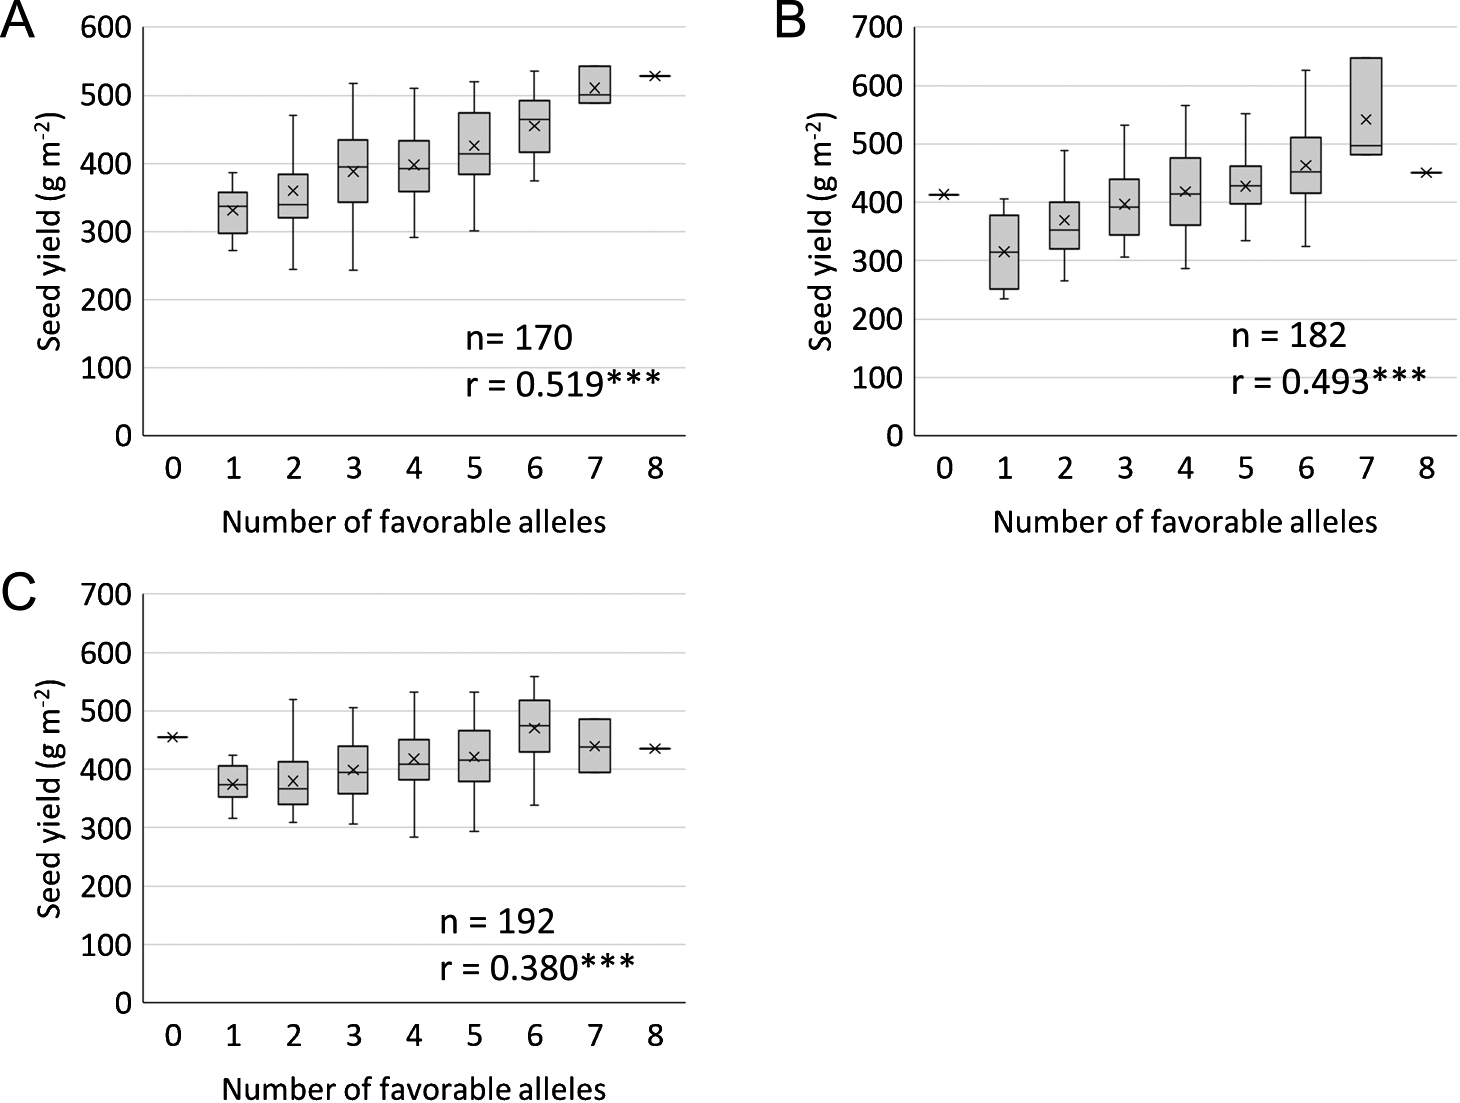
Table 4.
The 12 recombinant inbred lines (RILs) producing higher yields than their parental cultivars in each year
| Cultivar/line |
Alleles at QTL associated with seed
yielda |
qLS19-1 alleleb |
Genomic regions originating from Toyomusume (%)c |
Seed yield (g m–2) |
| qSY5-1 |
qSY5-2 |
qSY8-1 |
qSY11-1 |
qSY13-1 |
qSY13-2 |
qSY14-1 |
qSY18-1 |
Number of favorable alleles |
2009 |
2011 |
2012 |
Average |
| Toyoharuka |
U |
U |
U |
U |
F |
F |
U |
U |
2 |
F |
0 |
354 |
416 |
343 |
371 |
| Toyomusume |
F |
F |
F |
F |
U |
U |
F |
F |
6 |
U |
100 |
475 |
469 |
413 |
452 |
| RIL-109 |
F |
U |
F |
F |
F |
F |
F |
F |
7 |
U |
60 |
486 |
647 |
543 |
559 |
| RIL-57 |
F |
F |
F |
F |
U |
F |
U |
F |
6 |
U |
65 |
559 |
626 |
485 |
557 |
| RIL-100 |
F |
F |
U |
F |
F |
F |
F |
U |
6 |
U |
57 |
518 |
503 |
535 |
519 |
| RIL-112 |
F |
F |
F |
F |
F |
U |
U |
F |
6 |
U |
63 |
525 |
540 |
477 |
514 |
| RIL-167 |
F |
F |
F |
U |
F |
U |
F |
F |
6 |
U |
61 |
550 |
475 |
477 |
501 |
| RIL-42 |
F |
F |
F |
F |
U |
U |
F |
F |
6 |
U |
71 |
517 |
509 |
462 |
496 |
| RIL-181 |
F |
F |
U |
F |
F |
F |
U |
F |
6 |
F |
43 |
489 |
548 |
416 |
484 |
| RIL-96 |
S |
F |
F |
F |
F |
U |
U |
F |
5 |
U |
57 |
480 |
552 |
520 |
517 |
| RIL-29 |
F |
F |
U |
F |
F |
F |
S |
U |
5 |
F |
33 |
496 |
478 |
414 |
463 |
| RIL-34 |
F |
S |
S |
F |
U |
F |
U |
F |
4 |
F |
42 |
500 |
516 |
495 |
504 |
| RIL-86 |
F |
U |
U |
F |
F |
F |
U |
U |
4 |
F |
47 |
527 |
565 |
421 |
504 |
| RIL-18 |
U |
U |
F |
F |
U |
F |
U |
U |
3 |
F |
42 |
482 |
532 |
518 |
511 |
| Rate of the favorable alleles (%) |
91 |
73 |
64 |
92 |
67 |
67 |
36 |
67 |
|
42 |
|
|
|
|
|
a The closest markers to the peak positions of each QTL were used. F, the favorable allele. U, the unfavorable allele. S, segregation. Rate of the favorable alleles (%) = (Number of the favorable alleles)/(Number of the favorable and unfavorable alleles) × 100.
b The Toyoharuka allele at qLS19-1 has positive effects on lodging tolerance (Yamaguchi et al. 2014).
c Genomic regions originating from Toyomusume (%) = (Number of Toyomusume alleles)/(Number of Toyoharuka and Toyomusume alleles) × 100. The 149 polymorphic markers were used for calculation.
The qSW8-1 was detected in the proximal region of qSY8-1 (Tables 2, 3). To confirm the effects of qSY8-1, Toyoharuka-NIL was developed. In a two-year yield trial, main stem length, total above-ground yield, seed yield, and 100-seed weight were significantly different between Toyoharuka and Toyoharuka-NIL (Table 5). The 100-seed weight and seed yield of Toyoharuka-NIL were significantly greater than those of Toyoharuka (106% and 107%, respectively) (Table 5). Main stem length of Toyoharuka-NIL was significantly greater than that of Toyoharuka (Table 5). Days to flowering, days to maturity, and lodging score were not significantly different between Toyoharuka and Toyoharuka-NIL (Table 5). Thus, the effects of qSY8-1 were validated in the Toyoharuka background, and qSY8-1 contributes to the 100-seed weight.
Table 5.
Yield trials of the near-isogenic line for
qSY8-1 (means in 2010 and 2011)
| Cultivar/line |
qSY8-1 allele |
Days to flowering (days) |
Days to maturing (days) |
Main stem length (cm) |
Lodging scorea |
100-seed weight (g) |
Total above-ground yield (t ha–1) |
Seed yield (t ha–1) |
| Toyoharuka |
Toyoharuka |
58 |
132 |
64 |
0.3 |
38.2 |
6.61 |
3.68 |
| Toyoharuka-NIL |
Toyomusume |
58 |
133 |
72 |
1.0 |
40.6 |
7.16 |
3.94 |
|
|
nsb |
ns |
* |
ns |
** |
* |
* |
a Lodging score: 0 (no lodging)–4 (completely lodged).
b ns, not significant.
* Significant at P < 0.05.
** Significant at P < 0.01.
Discussion
Seven QTL associated with seed yield, except qSY8-1, detected in this study appear to be located in the proximal regions of previously reported loci (Supplemental Table 2). Six QTL associated with 100-seed weight located near qSY8-1 have been reported (Han et al. 2012, Hoeck et al. 2003, Kim et al. 2010, Kulkarni et al. 2017, Orf et al. 1999, Yang et al. 2011). However, their effects on seed yield have been not validated in yield trials. The Toyomusume allele at qSY8-1 had positive effects on seed yield and 100-seed weight compared with the Toyoharuka allele in the Toyoharuka background (Table 5). Main stem length and total above-ground yield of Toyoharuka-NIL were significantly greater than those of Toyoharuka although there were no differences in days to flowering and maturity between them (Table 5). These results indicate that the vegetative growth of Toyoharuka-NIL may be more vigorous than that of Toyoharuka. Therefore, we hypothesize that the vigorous plant growth in Toyoharuka-NIL may improve the source ability for bigger seed size. In our previous study, the near-isogenic line for qSY8-1 was bred from Toyoharuka (having unfavorable allele at qSY8-1) × Toyomizuki (recurrent parental cultivar) by the backcrossing method (Yamaguchi et al. 2019). In a three-year yield trial, the Toyoharuka allele at qSY8-1 did not have negative effects on seed yield and 100-seed weight compared with the Toyomizuki allele (Yamaguchi et al. 2019). Evaluations of qSY8-1 in different backgrounds and more environments are needed to characterize the QTL’s stability.
The qSY8-1 was detected in the proximal region of the I locus, which controls seed coat pigmentation in soybean (Table 2). In our previous study, the Toyoharuka allele at the I locus had positive effects on tolerance to seed coat discoloration induced by chilling temperature compared to the Toyomusume allele (Ohnishi et al. 2011, Yamaguchi et al. 2019). Thus, marker-assisted selection for the Toyomusume allele at qSY8-1 may be advantageous for high-yielding but disadvantageous for tolerance to seed coat discoloration in breeding programs. We could not confirm whether qSY8-1 was closely linked to the I locus or pleiotropism of the I locus. Fine mapping and gene isolation for qSY8-1 may clarify the relationship between them in the future.
Days to flowering and maturity, as well as the seed filling period, affect the seed yield of soybean (Cober and Morrison 2010, Yamada et al. 2012). In total, 11 maturity genes, E1–E11, controlling flowering time and maturity, have been identified in soybean (Cober et al. 2010, Grant et al. 2010, Kong et al. 2014, Samanfar et al. 2017, Wang et al. 2019). The QTL controlling maturity or the reproductive stage have been identified in the proximal regions of qSY11-1 and qSY18-1 (Komatsu et al. 2012, Wang et al. 2015, Yao et al. 2015). Ikeda et al. (2009) also detected a QTL for maturity in the proximal region of qSY11-1 in the RIL population from a Toyoharuka × Toyomusume cross. Therefore, qSY11-1 may be pleiotropic. Both qSY8-1 and maturity gene E10 (Samanfar et al. 2017) were identified on Chr-8, but the physical distance between qSY8-1 and E10 was estimated to be over 38 megabases (Mb) (qSY8-1, 5.7 to 8.2 Mb; E10, 46.6 Mb). In fact, days to flowering and maturity for Toyoharuka-NIL having the Toyomusume allele at qSY8-1 were similar to those for Toyoharuka (Table 5). Thus, qSY8-1 was not associated with maturity genes.
In the high-yielding RILs, the percentage of genomic regions originating from Toyomusume varied from 33% to 71% (Table 4). A few high-yielding RILs had only two or three favorable alleles at QTL associated with seed yield (Table 4). These results indicated that more QTL associated with seed yield exist in Toyoharuka and Toyomusume. To detect more of these QTL, it is necessary to increase the recombination events in the population with large size population, and to develop a new experimental population segregated undetected QTL.
There were significant positive correlations between seed yield and the number of favorable alleles at QTL associated with seed yield (Fig. 2). In the high-yielding RILs, 7 out of 12 RILs had 6 or 7 favorable alleles at QTL associated with seed yield (Table 4). Thus, pyramiding the six favorable alleles or more may be effective for producing high-yielding soybean lines. Soybean plants with higher above-ground weights are easily lodged (Shimada et al. 2002). The effect of qSY8-1 originated from Toyomusume indicated that the higher above-ground weights would be useful to enhance yield. The chromosomal location of qLS19-1, the QTL for lodging tolerance (Yamaguchi et al. 2014), is different from seed yield QTL detected in this study. Therefore, to confirm the pyramiding effects on seed yield, it is necessary to develop and evaluate the pyramiding lines having favorable alleles at QTL associated with seed yield and qLS19-1 in the future.
Author Contribution Statement
NY designed research. NY and FK conducted the field experiments. FT, YS, MS, and MI conducted the DNA marker experiments. NY, FT, YS, and FK analyzed the data. NY wrote the manuscript. All authors read and approved the manuscript.
Acknowledgments
This study was supported by grants from the Takano Science Research Foundation, the Ministry of Agriculture, Forestry and Fisheries of Japan (Genomics-based Technology for Agricultural Improvement, SFC1001) and a Grand-in-Aid for Scientific Research (KAKENHI-18K05589). We thank Lesley Benyon, PhD, from Edanz Group (https://en-author-services.edanzgroup.com/) for editing a draft of this manuscript.
Literature Cited
- Cober, E.R., S.J. Molnar, M. Charette and H.D. Voldeng (2010) A new locus for early maturity in soybean. Crop Sci. 50: 524–527.
- Cober, E.R. and M.J. Morrison (2010) Regulation of seed yield and agronomic characters by photoperiod sensitivity and growth habit genes in soybean. Theor. Appl. Genet. 120: 1005–1012.
- Cooper, R.L. (1971) Influence of soybean production practices on lodging and seed yield in highly productive environments. Agron. J. 63: 490–493.
- Fujii, K., T. Sayama, K. Takagi, K. Kosuge, K. Okano, A. Kaga and M. Ishimoto (2018) Identification and dissection of single seed weight QTLs by analysis of seed yield components in soybean. Breed. Sci. 68: 177–187.
- Grant, D., R.T. Nelson, S.B. Cannon and R.C. Shoemaker (2010) SoyBase, the USDA-ARS soybean genetics and genomics database. Nucleic Acids Res. 38 (Database issue): D843–D846. (https://www.soybase.org/)
- Han, Y., D. Li, D. Zhu, H. Li, X. Li, W. Teng and W. Li (2012) QTL analysis of soybean seed weight across multi-genetic backgrounds and environments. Theor. Appl. Genet. 125: 671–683.
- Hoeck, J.A., W.R. Fehr, R.C. Shoemaker, G.A. Welke, S.L. Johnson and S.R. Cianzio (2003) Molecular marker analysis of seed size in soybean. Crop Sci. 43: 68–74.
- Hwang, T.Y., Y. Nakamoto, I. Kono, H. Enoki, H. Funatsuki, K. Kitamura and M. Ishimoto (2008) Genetic diversity of cultivated and wild soybeans including Japanese elite cultivars as revealed by length polymorphism of SSR markers. Breed. Sci. 58: 315–323.
- Hwang, T.Y., T. Sayama, M. Takahashi, Y. Takada, Y. Nakamoto, H. Funatsuki, H. Hisano, S. Sasamoto, S. Sato, S. Tabata et al. (2009) High-density integrated linkage map based on SSR markers in soybean. DNA Res. 16: 213–225.
- Hyten, D.L., V.R. Pantalone, C.E. Sams, A.M. Saxton, D. Landau-Ellis, T.R. Stefaniak and M.E. Schmidt (2004) Seed quality QTL in a prominent soybean population. Theor. Appl. Genet. 109: 552–561.
- Ikeda, T., S. Ohnishi, M. Senda, T. Miyoshi, M. Ishimoto, K. Kitamura and H. Funatsuki (2009) A novel major quantitative trait locus controlling seed development at low temperature in soybean (Glycine max). Theor. Appl. Genet. 118: 1477–1488.
- Iwata, H. and S. Ninomiya (2006) AntMap: constructing genetic linkage maps using an ant colony optimization algorithm. Breed. Sci. 56: 371–377.
- Kato, S., T. Sayama, K. Fujii, S. Yumoto, Y. Kono, T.Y. Hwang, A. Kikuchi, Y. Takada, Y. Tanaka, T. Shiraiwa et al. (2014) A major and stable QTL associated with seed weight in soybean across multiple environments and genetic backgrounds. Theor. Appl. Genet. 127: 1365–1374.
- Kim, H.K., Y.C. Kim, S.T. Kim, B.G. Son, Y.W. Choi, J.S. Kang, Y. Park, Y.S. Cho and I.S. Choi (2010) Analysis of quantitative trait loci (QTLs) for seed size and fatty acid composition using recombinant inbred lines in soybean. J. Life Sci. 20: 1186–1192.
- Komatsu, K., T.Y. Hwang, M. Takahashi, T. Sayama, H. Funatsuki, N. Oki and M. Ishimoto (2012) Identification of QTL controlling post-flowering period in soybean. Breed. Sci. 61: 646–652.
- Kong, F., H. Nan, D. Cao, Y. Li, F. Wu, J. Wang, S. Lu, X. Yuan, E.R. Cober, J. Abe et al. (2014) A new dominant gene E9 conditions early flowering and maturity in soybean. Crop Sci. 54: 2529–2535.
- Kulkarni, K.P., S. Aeskova, D.H. Lee, K. Bilyeu, J.T. Song and J.D. Lee (2017) Mapping QTLs for 100-seed weight in an interspecific soybean cross of Williams 82 (Glycine max) and PI 366121 (Glycine soja). Crop Pasture Sci. 68: 148–155.
- Ohnishi, S., H. Funatsuki, A. Kasai, T. Kurauchi, N. Yamaguchi, T. Takeuchi, H. Yamazaki, H. Kurosaki, S. Shirai, T. Miyoshi et al. (2011) Variation of GmIRCHS (Glycine max inverted-repeat CHS pseudogene) is related to tolerance of low temperature-induced seed coat discoloration in yellow soybean. Theor. Appl. Genet. 122: 633–642.
- Orf, J.H., K. Chase, T. Jarvik, L.M. Mansur, P.B. Cregan, F.R. Adler and K.G. Lark (1999) Genetics of soybean agronomic traits: I. Comparison of three related recombinant inbred populations. Crop Sci. 39: 1642–1651.
- Samanfar, B., S.J. Molnar, M. Charette, A. Schoenrock, F. Dehne, A. Golshani, F. Belzile and E.R. Cober (2017) Mapping and identification of a potential candidate gene for a novel maturity locus, E10, in soybean. Theor. Appl. Genet. 130: 377–390.
- SAS Institute (2012) JMP 10 for Windows. SAS Inst., Cary, NC.
- Sayama, T., T.Y. Hwang, H. Yamazaki, N. Yamaguchi, K. Komatsu, M. Takahashi, C. Suzuki, T. Miyoshi, Y. Tanaka, Z. Xia et al. (2010) Mapping and comparison of quantitative trait loci for soybean branching phenotype in two locations. Breed. Sci. 60: 380–389.
- Sayama, T., T.Y. Hwang, K. Komatsu, Y. Takada, M. Takahashi, S. Kato, H. Sasama, A. Higashi, Y. Nakamoto, H. Funatsuki et al. (2011) Development and application of a whole-genome simple sequence repeat panel for high-throughput genotyping in soybean. DNA Res. 18: 107–115.
- Shimada, H., Y. Kono, Y. Takada, T. Sakai and S. Shimada (2002) Evaluation of root lodging resistance in soybean (Glycine max (L.) Merr.) cultivars by measurement of pushing resistance and top weight moment. Breed. Res. 4: 185–191 (in Japanese with English summary).
- Wang, F., H. Nan, L. Chen, C. Fang, H. Zhang, T. Su, S. Li, Q. Cheng, L. Dong, B. Liu et al. (2019) A new dominant locus, E11, controls early flowering time and maturity in soybean. Mol. Breed. 39: 70.
- Wang, S., C.J. Basten and Z.B. Zeng (2007) Windows QTL Cartographer 2.5. Department of Statistics, North Carolina State University, Raleigh, NC. https://brcwebportal.cos.ncsu.edu/qtlcart/WQTLCart.htm
- Wang, Y., L. Cheng, J. Leng, C. Wu, G. Shao, W. Hou and T. Han (2015) Genetic analysis and quantitative trait locus identification of the reproductive to vegetative growth period ratio in soybean (Glycine max (L.) Merr.). Euphytica 201: 275–284.
- Weber, C.R. and W.R. Fehr (1966) Seed yield losses from lodging and combine harvesting in soybeans. Agron. J. 58: 287–289.
- Woods, S.J. and M.L. Swearingin (1977) Influence of simulated early lodging upon soybean seed yield and its components. Agron. J. 69: 239–242.
- Yamada, T., M. Hajika, N. Yamada, K. Hirata, A. Okabe, N. Oki, K. Takahashi, K. Seki, K. Okano, Y. Fujita et al. (2012) Effects on flowering and seed yield of dominant alleles at maturity loci E2 and E3 in a Japanese cultivar, Enrei. Breed. Sci. 61: 653–660.
- Yamaguchi, N., T. Sayama, H. Yamazaki, T. Miyoshi, M. Ishimoto and H. Funatsuki (2014) Quantitative trait loci associated with lodging tolerance in soybean cultivar ‘Toyoharuka’. Breed. Sci. 64: 300–308.
- Yamaguchi, N., S. Hagihara and D. Hirai (2019) Field assessment of a major QTL associated with tolerance to cold-induced seed coat discoloration in soybean. Breed. Sci. 69: 521–528.
- Yan, L., Y.H. Li, C.Y. Yang, S.X. Ren, R.Z. Chang, M.C. Zhang and L.J. Qiu (2014) Identification and validation of an over-dominant QTL controlling soybean seed weight using populations derived from Glycine max × Glycine soja. Plant Breed. 133: 632–637.
- Yang, K., J.K. Moon, N. Jeong, H.K. Chun, S.T. Kang, K. Back and S.C. Jeong (2011) Novel major quantitative trait loci regulating the content of isoflavone in soybean seeds. Genes Genom. 33: 685–692.
- Yao, D., Z.Z. Liu, J. Zhang, S.Y. Liu, J. Qu, S.Y. Guan, L.D. Pan, D. Wang, J.W. Liu and P.W. Wang (2015) Analysis of quantitative trait loci for main plant traits in soybean. Genet. Mol. Res. 14: 6101–6109.
- Zeng, Z.B. (1994) Precision mapping of quantitative trait loci. Genetics 136: 1457–1468.