Abstract
The timing of heading is largely affected by environmental conditions. In wheat, Vrn-1 and Ppd-1 have been identified as the major genes involved in vernalization requirement and photoperiod sensitivity, respectively. To compare the effects of Vrn-1 and Ppd-1 alleles on heading time under different environments, we genotyped Vrn-1 and Ppd-1 homoeologues and measured the heading time at Morioka, Tsukuba and Chikugo in Japan for two growing seasons. A total of 128 Japanese and six foreign varieties, classified into four populations based on the 519 genome-wide SNPs, were used for analysis. Varieties with the spring alleles (Vrn-D1a or Vrn-D1b) at the Vrn-D1 locus and insensitive allele (Hapl-I) at the Ppd-D1 locus were found in earlier heading varieties. The effects of Vrn-D1 and Ppd-D1 on heading time were stronger than those of the other Vrn-1 and Ppd-1 homoeologues. Analysis of variance revealed that heading time was significantly affected by the genotype-environment interactions. Some Vrn-1 and Ppd-1 alleles conferred earlier or later heading in specific environments, indicating that the effect of both alleles on the timing of heading depends on the environment. Information on Vrn-1 and Ppd-1 alleles, together with heading time in various environments, provide useful information for wheat breeding.
Introduction
The timing of flowering is one of the most important traits for local adaptation and is controlled by environmental cues, such as temperature and day length. Earlier flowering can escape high temperatures and drought stress during anthesis and grain filling (Bennett et al. 2012, Bentley et al. 2013). Effects of genetic factors controlling flowering time depend on plant growth conditions (environmental conditions). Understanding genotype-environment (G × E) interactions is important for wheat breeding because they often affect grain yield in wheat (Eltaher et al. 2021, Nehe et al. 2019). Thus, a study of G × E can lead to the successful evaluation of wheat varieties for stability in yield performance across environments.
Heading time, which is closely correlated with flowering time, is an important trait for breeding, since heading time can affect the yield of temperate cereals such as wheat (Mizuno et al. 2021). Vernalization requirement, photoperiod sensitivity, and narrow-sense earliness (earliness per se) are factors that determine the timing of heading in wheat. Vernalization requirement is controlled by VERNALIZATION genes, Vrn-1 (Yan et al. 2003), Vrn-2 (Yan et al. 2004a), Vrn-3 (Yan et al. 2006) and Vrn-D4 (Kippes et al. 2015). Vrn-1 encodes an APETALA1/FRUITFULL-like (AP1/FUL-like) MADS-box transcription factor (Yan et al. 2003). One or more dominant alleles at Vrn-1 homoeoloci confer a spring growth habit (vernalization insensitive), whereas plants without any spring-type alleles at Vrn-1 homoeoloci show a winter growth habit (vernalization sensitive). The insertions and deletions within the promoter or a deletion within intron 1 were causal mutations of dominant alleles at the Vrn-A1 locus (Chen et al. 2013, Fu et al. 2005, Yan et al. 2004b). On the one hand, the spring type of Vrn-B1 and Vrn-D1 alleles has been mostly due to the insertion and deletion in the intron 1 region (Fu et al. 2005, Yan et al. 2004b, Zhang et al. 2012). Natural variations in VRN3, the wheat ortholog of the Arabidopsis FT (FLOWERING LOCUS T), have been found in the B genome (Chen et al. 2013, Yan et al. 2006). The dominant allele, which conferred a spring habitat, contains a 5.3 kb insertion of a retrotransposon in the promoter region. On the other hand, the combination of mutations in all three VRN-2 homoeologues that conferred spring growth habit has not been observed in the examined varieties of common wheat (Kippes et al. 2016). Photoperiod sensitivity is controlled by the Photoperiod-1 (Ppd-1) gene, which encodes a protein with a sequence similarity to Arabidopsis PSEUDO RESPONSE REGULATOR 7 (PRR7) (Beales et al. 2007, Turner et al. 2005). Photoperiod-insensitive alleles of Ppd-1 (Ppd-1a) have been identified for each homoeologues on chromosomes 2A, 2B and 2D of common wheat (Beales et al. 2007, Shaw et al. 2012, Wilhelm et al. 2009). Deletions or insertions in the promoter regions of Ppd-A1, Ppd-B1 and Ppd-D1 are associated with photoperiod-insensitivity in wheat (Beales et al. 2007, Nishida et al. 2013, Wilhelm et al. 2009). WPCL1, a clock gene homologue of Arabidopsis thaliana LUX ARRHYTHMO (LUX)/PHYTOCLOCK 1 (PCL1), was identified as a gene conferring an early heading phenotype and controlling the expression pattern and levels of Ppd-1 genes (Mizuno et al. 2012, 2016). In addition to these allelic variations in Vrn-1 and Ppd-1 homoeologues, copy number variations (CNVs) have also been observed in Ppd-B1 and Vrn-A1 (Díaz et al. 2012). Furthermore, many molecular genetic studies have extended our understanding of the wheat flowering regulatory network (Shi et al. 2019).
In barley, Vrn-H1 and Ppd-H1 were identified as the major stabilizing genes of the heading response for regional adaptation (Sato et al. 2020). Vrn-1 and Ppd-1 genes have been frequently identified as the major quantitative trait loci for heading time in wheat (Guedira et al. 2016, Iehisa et al. 2014, Mizuno et al. 2021, Nguyen et al. 2013). The allelic diversity of Vrn-1 and Ppd-1, in addition to heading time, has been well investigated in wheat (Chen et al. 2018, Seki et al. 2011, 2013, Zhang et al. 2015). Recent sequencing-based studies of Ppd-1 genes have also updated the allelic diversity (Chen et al. 2018). However, it remains largely unknown how the alleles of these genes affect heading time in different environments such as years or locations. To understand G × E on timing of heading in wheat, it is important to investigate the effect of Vrn-1 and Ppd-1 alleles in different environments. The aim of this study is to analyze the effect of the interaction between Vrn-1 and Ppd-1 alleles and the environment on the timing of heading and to uncover the effects of temperature on the timing of heading. In this study, we selected 134 representative wheat accessions including modern varieties and materials for breeding research in Japan and investigated the heading time of these varieties at three locations in Japan during two growing seasons and discuss the relationship between the environments and haplotypes of the Vrn-1 and Ppd-1 homoeologues.
Materials and Methods
Plant materials
A total of 134 wheat varieties were selected from recent breeding varieties, important genetic resources, promising lines, and materials for basic research based on their geographical and genealogical information. The variety names and breeding areas of the 134 varieties are listed in Supplemental Table 1.
Measurement of heading time
These varieties were grown in fields at Morioka, Tsukuba and Chikugo in Japan during the 2019–2020 and 2020–2021 growing seasons. The sowing date for each location and season and location information is summarized in Supplemental Table 2. Each experimental plot consisted of a single 80-cm-long row with an 8 cm space between each plant. Ten individuals were grown per replicate, and measurements were taken for two replicates. The heading date was recorded when the tip of the first spike emerged from the flag leaf sheath in half of the plants for each variety. Days to heading (DH) was defined as the days from sowing to heading.
Genotyping by amplicon sequencing
Genome-wide genotyping via amplicon sequencing was performed following the protocol described by Ishikawa et al. (2018). Low-quality reads and adaptors were trimmed using Trimmomatic (v0.36) with the options “SLIDINGWINDOW:4:25” and “MINLEN:40” (Bolger et al. 2014). The trimmed paired-end reads were mapped using BWA-mem (v0.7.15) with -L 10 and -B 10 options (Li and Durbin 2009). SNPs were detected using HaplotypeCaller in GATK 3.7 (DePristo et al. 2011). The minimum read count was set to 5. Heterozygous site (H) was called when two alleles had more than 40% of the total reads each.
Construction of phylogenetic tree and structure analysis
A maximum likelihood (ML) tree was constructed using RAxML-NG (Kozlov et al. 2019) with the “GTR+G+ASC_LEWIS” model and bs-trees option of 1000. The best ML tree was rooted using midpoint rooting and visualized with FigTree 1.4.4 (http://tree.bio.ed.ac.uk/software/figtree/). ADMIXTURE v1.3.0 (Alexander et al. 2009) was used to investigate the population structure of the 134 varieties. The runs of ADMIXTURE analysis were visualized using pong v1.5 (Behr et al. 2016). For each value of K, ten ADMIXTURE analysis runs were performed with different random seeds. The best run was selected according to the highest log-likelihood value. A principal component analysis (PCA) based on covariance was performed using Tassel 5 (Bradbury et al. 2007).
Genotyping of the Vrn-1 and Ppd-1 homoeoloci
Total DNA was extracted from leaves using a DNeasy Plant Maxi Kit (Qiagen, Germany) following the manufacturer’s protocol. We used polymerase chain reaction (PCR) primers (Supplemental Table 3) that had been shown to identify the alleles of Vrn-1 and Ppd-1 homoeologues in previous studies, and we amplified DNA by PCR using a T100 thermal cycler (Bio-Rad Laboratories Inc., Hercules, CA, USA) and GoTaq DNA polymerase (Promega Corp., Madison, WI, USA). The PCR conditions were as follows: denaturation at 95°C for 1 min, followed by 35 cycles of the denaturation at 95°C for 30 s, annealing for 30 s, extension at 72°C for 30 s, and then final extension at 72°C for 5 min. Information on the primer sets used in this study is presented in Supplemental Table 3. The amplicons were separated on a 2.0% agarose gel and visualized using SYBR Safe DNA Gel Stain (Invitrogen, Carlsbad, CA, USA), or separated by a capillary electrophoresis system (LabChip GX Touch HT, PerkinElmer, Inc., Waltham, MA, USA) with a DNA5K/RNA/CZE chip (PerkinElmer). Allele names of the Vrn-1 and Ppd-1 genes were determined according to Chen et al. (2018).
Statistical analysis
Data for the two-seasons (2019–2020 and 2020–2021) from the three locations (Morioka, Tsukuba, and Chikugo) were summarized and statistically analyzed for combined analysis of variance (ANOVA) and additive main effect and multiplicative interaction (AMMI) analysis using the AMMI function in the agricolae package in R software (de Mendiburu and Yaseen 2020). Scatter plots were generated using the ggplot2 package in R software and regression lines were added with the “lm” method (Wickham 2016). Statistically significant differences between groups were determined using two-way ANOVA and Tukey-Kramer’s HSD test in R software (P < 0.05). Meteorological data in Morioka, Tsukuba and Kurume near Chikugo were obtained from the Japan Meteorological Agency (https://www.data.jma.go.jp).
Results
Evaluation of genetic diversity in wheat collection
To evaluate the genome-wide diversity of the 134 wheat varieties, genotyping was performed using amplicon sequencing. A total of 519 SNPs were detected (minor allele frequency (MAF) >0.05 and proportion of missing data <0.2). To investigate the population structure of the 134 wheat varieties, we conducted multiple analyses (ML phylogenetic, PCA and population structure) using these 519 SNPs. Cross-validation error by ADMIXTURE analysis decreased up to K = 4 and K = 5, and then gradually increased as K increased (Supplemental Fig. 1A). There was one type dividing the population at K = 4, whereas there were three types of dividing the population out of ten in the ADMIXTURE analysis at K = 5 (Supplemental Fig. 1B). Thus, these results indicate that the number of clusters at K = 4 was suitable for the 134 wheat varieties (Fig. 1A). The PCA and ML tree also indicated that clustering agreed with that obtained by the ADMIXTURE analysis, although the varieties from Tohoku and spring varieties from Hokkaido clustered differently in the ML tree (Fig. 1B, 1C). At K = 4, the 134 wheat varieties were divided into four populations: spring wheat varieties from Hokkaido and the varieties from Tohoku/Hokuriku areas (Population I), winter wheat varieties from Hokkaido (Population II), varieties from Kanto/Tosan/Tokai areas (Population III), and varieties from Kinki/Chugoku/Shikoku and Kyushu areas (Population IV) (Supplemental Table 4). The foreign varieties belonged to Population I and III.

To examine the allele frequency of Vrn-1 and Ppd-1 homoeologues in the 134 varieties, we performed PCR analysis using the primer sets reported in previous studies (Chen et al. 2018). For Vrn-A1 and Vrn-B1, the Vrn-A1a and Vrn-B1a alleles (spring type) were observed in 15 and 11 varieties, respectively, which belonged to Population I and IV (Table 1). Another spring Vrn-A1b allele was found in one variety, ‘Fielder’ (DITW094), belonging to Population I. For Vrn-D1, 63 varieties (47.0%) had the spring Vrn-D1a allele, and the proportion of the Vrn-D1a allele in Population III and IV was much higher than that in Population I and II. Another spring Vrn-D1b allele was observed in nine varieties, among which eight belonged to Population III and IV. For Ppd-A1, 24 varieties had the Ppd-A1a allele (insensitive allele), which was mainly found in Population I and II. The proportion of the Ppd-A1a allele was much higher (81.8%) in Population II than in the other populations (less than 12.2%). For Ppd-B1, the Ppd-B1a allele (insensitive allele) was found in two varieties, ‘Fukuwase komugi’ (DITW064) and ‘Abukumawase’ (DITW074), belonging to Population III and IV, respectively. Additionally, we found three CNVs of Ppd-B1, which were detected in bread wheat (Díaz et al. 2012). Hapl-II of Ppd-B1 was mainly found in Population I and II, whereas Hapl-V of Ppd-B1 was mainly observed in Population III and IV. For Ppd-D1, the majority of varieties belonging to Population III (17/19 varieties, 89.5%) and Population IV (51/52 varieties, 98.1%) had the Hapl-I of Ppd-D1 (insensitive allele). The varieties belonging to Population I also possessed a much higher proportion of the Hapl-I of Ppd-D1 (27/47 varieties, 65.9%) than that of the varieties belonging to Population II (5/22 varieties, 22.7%). The Hapl-III of Ppd-D1, which conferred late heading, was observed only in four varieties belonging to Population I [‘Hokuei’ (DITW006), ‘Akasabishirazu 1’ (DITW011), ‘Sapporo Harukomugi’ (DITW013) and ‘Harumakikomugi Norin 75’ (DITW014)]. When compared by breeding area, the allele frequencies of Vrn-1 and Ppd-1 differed largely between the northeastern area (Hokkaido and Tohoku/Hokuriku) and the southwestern area (Kanto/Tosan/Tokai, Kinki/Chugoku/Shikoku and Kyusyu) (Supplemental Table 4). All of varieties from Tohoku/Hokuriku and Hokkaido except for the spring-sowing varieties had no spring allele of Vrn-1 homoeologues, whereas most varieties from southwestern area possessed one or more spring allele of Vrn-1 homoeologues spring allele at Vrn-1 homoeoloci. The majority of Japanese varieties had insensitive alleles at Ppd-1 homoeoloci, whereas the spring-sowing varieties from Hokkaido rarely had them.
Table 1.
Allele frequency of
Vrn-1 and
Ppd-1 homoeologues and their mean days to heading in the 134 wheat varieties
| Gene |
Allele |
Population I |
Population II |
Population III |
Population IV |
Total |
Morioka (19–20) |
Tsukuba (19–20) |
Chikugo (19–20) |
Morioka (20–21) |
Tsukuba (20–21) |
Chikugo (20–21) |
| Vrn-A1 |
Vrn-A1a |
11 |
0 |
0 |
4 |
15 |
235.0 |
170.5 |
146.6 |
240.3 |
165.5 |
141.5 |
|
Vrn-A1b |
1 |
0 |
0 |
0 |
1 |
242.5 |
174.5 |
144.0 |
241.5 |
164.0 |
138.0 |
|
vrn-A1 |
29 |
22 |
19 |
48 |
118 |
231.5 |
163.5 |
140.6 |
234.1 |
160.1 |
135.8 |
| Vrn-B1 |
Vrn-B1a |
9 |
0 |
0 |
2 |
11 |
237.8 |
172.3 |
147.9 |
241.7 |
166.9 |
141.5 |
|
vrn-B1 |
25 |
22 |
19 |
49 |
115 |
231.3 |
163.4 |
140.2 |
234.1 |
159.9 |
135.8 |
|
aNA |
7 |
0 |
0 |
1 |
8 |
234.7 |
167.6 |
147.6 |
236.9 |
163.6 |
139.2 |
| Vrn-D1 |
Vrn-D1a |
5 |
3 |
14 |
41 |
63 |
226.4 |
157.5 |
130.1 |
230.9 |
153.6 |
129.4 |
|
Vrn-D1b |
1 |
0 |
2 |
6 |
9 |
227.1 |
156.1 |
131.1 |
228.2 |
153.8 |
128.6 |
|
vrn-D1 |
35 |
19 |
3 |
5 |
62 |
238.2 |
172.5 |
154.2 |
237.5 |
168.8 |
144.8 |
| Ppd-A1 |
Ppd-A1a |
5 |
18 |
0 |
1 |
24 |
238.1 |
170.5 |
151.9 |
237.3 |
166.5 |
142.9 |
|
Ppd-A1b |
36 |
4 |
19 |
51 |
110 |
230.5 |
163.0 |
139.0 |
233.7 |
159.4 |
135.0 |
| Ppd-B1 |
Ppd-B1a |
0 |
0 |
1 |
1 |
2 |
221.5 |
149.8 |
120.8 |
226.0 |
146.8 |
121.8 |
|
Hapl-I |
25 |
16 |
9 |
31 |
81 |
232.8 |
165.2 |
143.3 |
235.5 |
162.1 |
138.4 |
|
Hapl-II |
13 |
5 |
0 |
1 |
19 |
236.1 |
170.2 |
149.1 |
235.9 |
165.6 |
140.3 |
|
Hapl-V |
3 |
1 |
9 |
19 |
32 |
228.0 |
159.7 |
132.8 |
231.2 |
155.3 |
130.2 |
| Ppd-D1 |
Hapl-I |
27 |
5 |
17 |
51 |
100 |
229.2 |
160.5 |
135.3 |
232.2 |
156.8 |
131.9 |
|
Hapl-II |
10 |
17 |
2 |
1 |
30 |
240.5 |
174.9 |
157.5 |
239.8 |
171.3 |
148.3 |
|
Hapl-III |
4 |
0 |
0 |
0 |
4 |
242.3 |
182.1 |
168.6 |
243.7 |
180.1 |
160.3 |
a NA: Not available.
The spring alleles of Vrn-1 and insensitive allele of Ppd-1 are shown in bold.
In total, 34 allele combinations of Vrn-1 and Ppd-1 homoeologues were observed in the 134 varieties (Supplemental Table 5). The frequency of allele combinations varied among the four populations, although they were similar between Population III and IV. The varieties belonging to Population III and IV mainly had vrn-A1/vrn-B1/Vrn-D1a/Ppd-A1b/Hapl-I of Ppd-B1/Hapl-I of Ppd-D1 or vrn-A1/vrn-B1/Vrn-D1a/Ppd-A1b/Hapl-V of Ppd-B1/Hapl-I of Ppd-D1. The higher frequency of the spring allele of Vrn-D1 (Vrn-D1a and Vrn-D1b) and insensitive allele of Ppd-D1 (Hapl-I) was one of the characteristics in Population III and IV. The varieties belonging to Population I and II had the highest frequency of vrn-A1/vrn-B1/vrn-D1/Ppd-A1a/Hapl-I of Ppd-B1/Hapl-II of Ppd-D1 and vrn-A1/vrn-B1/vrn-D1/Ppd-A1b/Hapl-I or Hapl-II of Ppd-B1/Hapl-I of Ppd-D1 allele combinations, respectively.
Evaluation of heading time
To compare the heading time in different environments, DH was surveyed at three locations in Japan (Morioka, Tsukuba and Chikugo) during the 2019–2020 and 2020–2021 seasons (Supplemental Table 1). Seven varieties died in the 2019–2020 season, whereas 37 varieties died in the 2020–2021 seasons at Morioka. No variety died in Tsukuba and Chikugo during the two growing seasons. The DH of all varieties was in the order of Chikugo, Tsukuba, and Morioka. The mean DH in Tsukuba and Chikugo in the 2020–2021 season (160.7 and 136.4) was smaller than that in the 2019–2020 season (164.4 and 141.3), whereas the mean DH in Morioka in the 2019–2020 season (231.9) was smaller than that in the 2020–2021 season (234.5). The correlation coefficients between the two seasons at the three locations were high, with correlation coefficients of 0.897 at Morioka, 0.970 at Tsukuba, and 0.957 at Chikugo (Table 2). For both seasons, a strong positive correlation was also found between the locations (R > 0.91 and P < 0.001). There were significant differences in DH depending on the locations, growing seasons, and populations (Fig. 2). The varieties belonging to Population III and IV headed significantly earlier than those belonging to Population I and II. In the 2019–2020 season, significant differences in DH between Population III and IV were observed in Tsukuba and Chikugo.
Table 2.
Correlation coefficients of heading time among the six environments
|
Tsukuba (19–20) |
Chikugo (19–20) |
Morioka (20–21) |
Tsukuba (20–21) |
Chikugo (20–21) |
| Morioka (19–20) |
0.952* |
0.948* |
0.897* |
0.942* |
0.908* |
| Tsukuba (19–20) |
|
0.958* |
0.924* |
0.970* |
0.945* |
| Chikugo (19–20) |
|
|
0.881* |
0.971* |
0.957* |
| Morioka (20–21) |
|
|
|
0.925* |
0.919* |
| Tsukuba (20–21) |
|
|
|
|
0.973* |
We then compared the DH among the varieties with different alleles of Vrn-1 and Ppd-1 homoeologues. Of the three Vrn-1 homoeologues, a significant difference in DH consistently at three locations was observed only among the alleles of Vrn-D1 (Supplemental Fig. 2). The spring alleles (Vrn-D1a or Vrn-D1b) at the Vrn-D1 locus conferred significantly earlier heading than the winter alleles (vrn-D1). There were significant differences in DH among the alleles of the three Ppd-1 homoeologues. The insensitive alleles of Ppd-B1 (Ppd-B1a and Hapl-V) and Ppd-D1 (Hapl-I) conferred significantly earlier heading than the sensitive alleles of Ppd-B1 (Hapl-I and Hapl-II) and Ppd-D1 (Hapl-II and Hapl-III). In contrast, the varieties with the sensitive allele of Ppd-A1 (Ppd-A1b) headed significantly earlier than those with the insensitive allele of Ppd-A1 (Ppd-A1a) (Supplemental Fig. 3). There were little significant differences in DH among the genotypes of Vrn-A1 and Vrn-B1 (Supplemental Figs. 2, 3). However, we confirmed Vrn-A1a, Vrn-B1a and Ppd-A1a conferred early heading by taking the genotypes of the other loci into consideration (Supplemental Table 5).
To confirm the effect of the allele combination of Vrn-1 and Ppd-1, we first performed a two-way ANOVA. Significant interactions between vernalization requirement and photoperiod sensitivity, which were determined by the genotypes of Vrn-1 and Ppd-1, were observed at Morioka and Tsukuba in the 2020–2021 season (Supplemental Table 6). Since many allele combinations had only a few varieties or one variety, it was difficult to compare them. Therefore, we focused on the allele combinations of Vrn-D1 and Ppd-B1, where the number of varieties is large. Among the varieties with Vrn-D1a, the varieties with Hapl-I of Ppd-B1 showed slightly earlier heading in all environments than those with Hapl-V of Ppd-B1 (Supplemental Fig. 5). Of the six environments, the varieties with Hapl-I of Ppd-B1 headed significantly earlier than those with Hapl-V of Ppd-B1 only at Tsukuba for the 2019–2020 season (P < 0.05, independent samples t-test). On the contrary, among the varieties with Vrn-D1b or vrn-D1, the varieties with Hapl-V of Ppd-B1 headed earlier than those with Ppd-B1.
Effects of Vrn-1 and Ppd-1 haplotypes on heading time in different environment
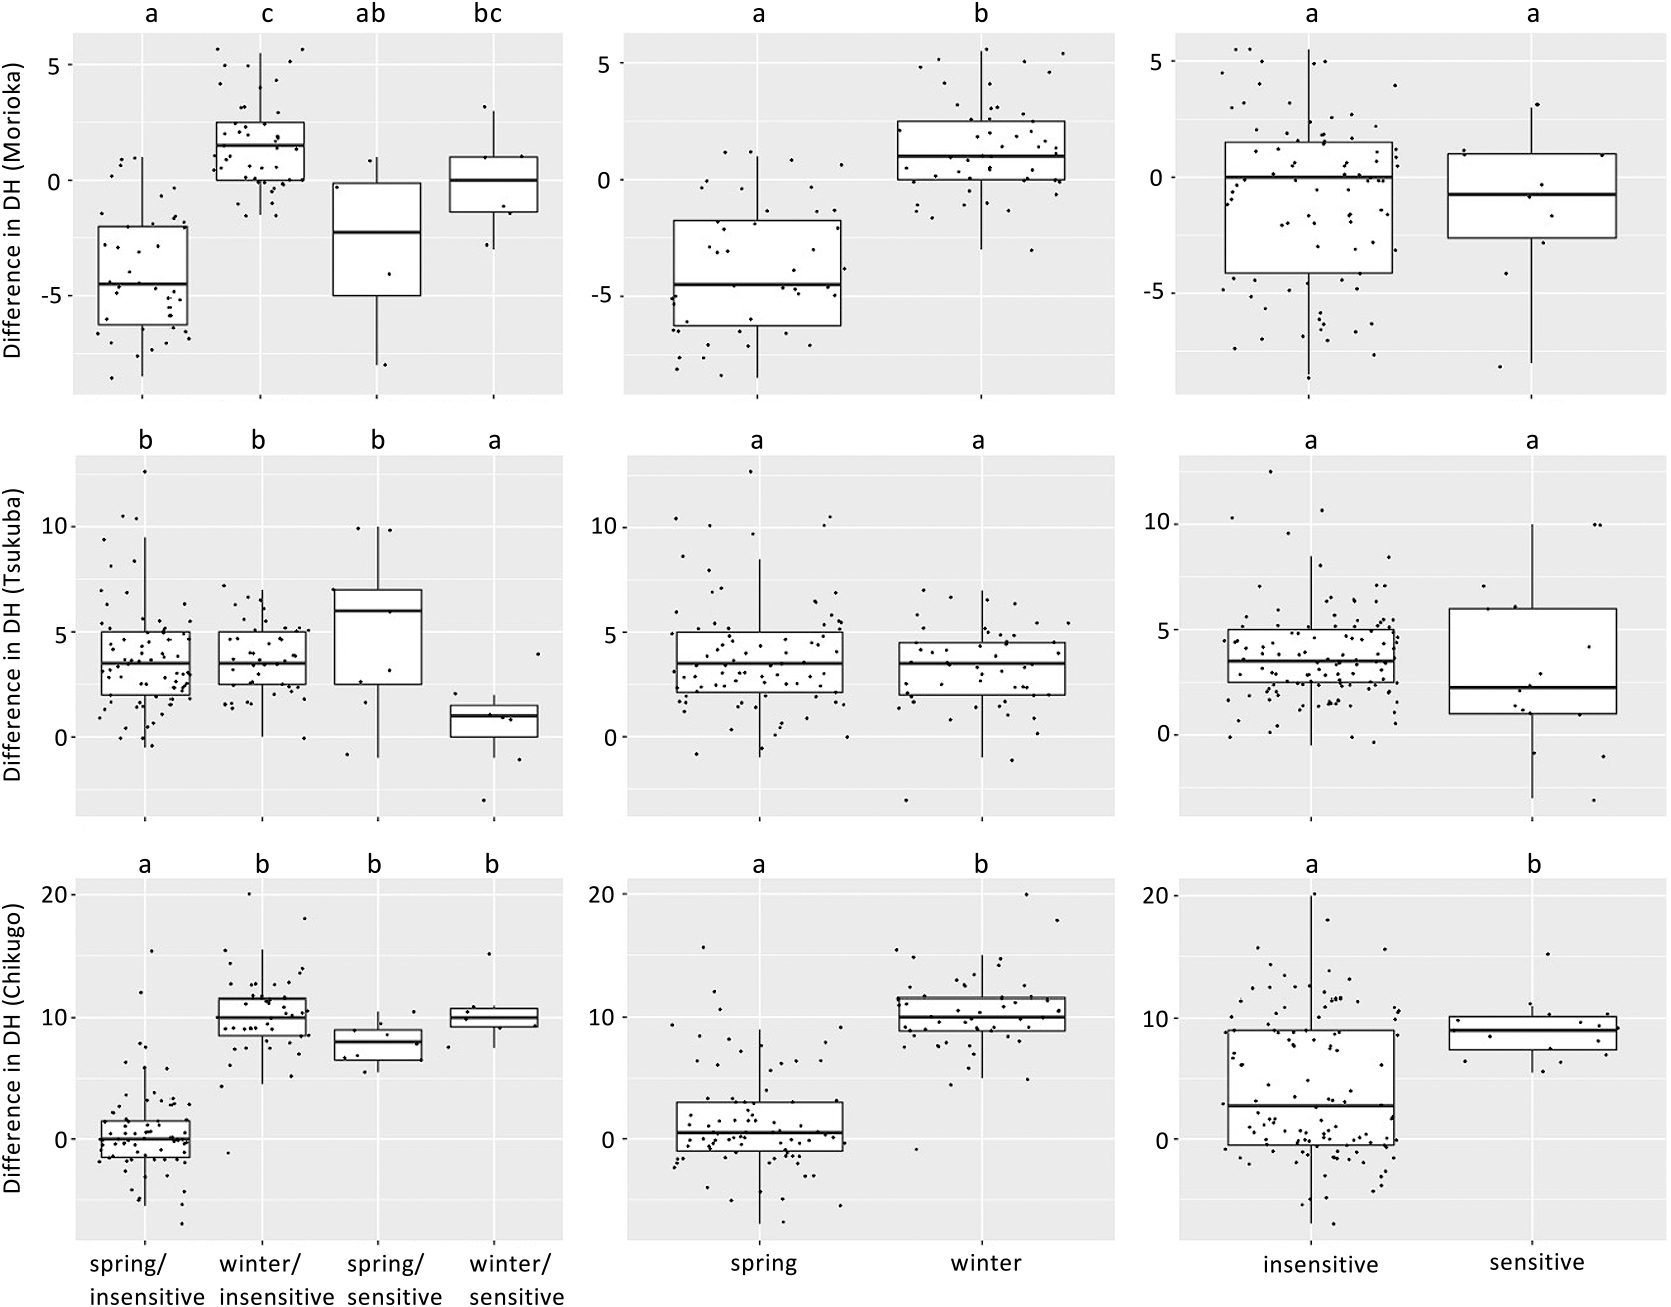
To investigate whether the effects of Vrn-1 and Ppd-1 haplotypes were altered by different environments, we compared DH between two seasons and among three locations by focusing on the haplotypes of Vrn-1 and Ppd-1 homoeologues. The ANOVA of the AMMI model revealed that DH was significantly (P < 0.01) affected by environment, genotype, and genotype-environment interaction (Table 3). Environments, genotypes and G × E interactions explained 93.2%, 6.0% and 0.7% of the total sum of squares, respectively. The first two interaction principal component analyses (IPCA1 and IPCA2) explained 72.2% and 11.2% of the G × E interaction variation, respectively. The AMMI2 biplot (Fig. 3) indicates that the 134 varieties were clearly divided into clusters according to the combination of differences in vernalization requirement and photoperiod sensitivity, which were determined by the alleles of Vrn-1 and Ppd-1 homoeologues. In particular, the varieties showing spring/insensitive and winter/insensitive phenotypes were clearly divided by IPCA1. In Morioka, the varieties with spring allele of Vrn-1 tended to head earlier in the 2020–2021 season than in the 2019–2020 season, compared to the varieties without spring alleles of Vrn-1 (Fig. 4). In contrast, the difference in the alleles of Ppd-1 homoeologues did not significantly affect the difference in DH between the two seasons. In Chikugo, the varieties without spring allele of Vrn-1 and insensitive allele of Ppd-1 tended to head later in the 2019–2020 season than in the 2019–2020 season compared with the varieties with spring allele of Vrn-1 and insensitive allele of Ppd-1 (Fig. 4). The varieties with spring allele of Vrn-1 and insensitive allele of Ppd-1 showed less DH differences between the two growing seasons compared with the other varieties. Unlike Morioka and Chikugo, the differences in DH between the two growing seasons in varieties without spring allele of Vrn-1 and insensitive allele of Ppd-1 were less than those in the other varieties in Tsukuba. The Vrn-D1 alleles, rather than the allele combination of Vrn-1 and Ppd-1 homoeologues, had a large effect on the inter-seasonal differences in DH in Morioka and Chikugo (Supplemental Fig. 5). There were little clear differences among the other allele combinations, although there were combinations with only a few varieties (data not shown).
Table 3.
Additive main effect and multiplicative interaction (AMMI) analysis of variance across six environments
|
Degree of freedom |
Sum of square |
Mean sum of square |
F value |
% of total sum of square |
% of G × E |
| Genotype |
133 |
148135.0 |
1114.0 |
474.2* |
6.0 |
|
| Environment |
5 |
2287198.0 |
457440.0 |
7514.3* |
93.2 |
|
| Replication |
6 |
365.0 |
61.0 |
25.9* |
0.02 |
|
| Interaction |
627 |
18044.0 |
29.0 |
12.3* |
0.7 |
|
| Residuals |
725 |
1703.0 |
2.0 |
|
|
|
| IPCA1 |
137 |
11906.1 |
86.9 |
37.0* |
|
72.2 |
| IPCA2 |
135 |
1841.7 |
13.6 |
5.8* |
|
11.2 |
| IPCA3 |
133 |
1403.7 |
10.6 |
4.5* |
|
8.5 |
| IPCA4 |
131 |
849.3 |
6.5 |
2.8* |
|
5.2 |
| IPCA5 |
129 |
487.7 |
3.8 |
1.6* |
|
3 |

To study whether differences in DH between environments were dependent on haplotypes of Vrn-1 and Ppd-1 homoeologues, we compared the heading time between growing seasons in each location and between locations for each growing season by focusing on the haplotypes of Vrn-1 and Ppd-1 homoeologues. The haplotypes that showed a difference in DH between the two seasons differed at the three locations (Supplemental Figs. 4–6). In Morioka and Chikugo, DH differences between the two growing seasons differed significantly among the alleles of Vrn-D1 and Ppd-D1. In Tsukuba, on the contrary, DH differences between the two growing seasons showed no significant differences among the alleles of Vrn-D1 and Ppd-D1. Comparing DH among the three locations for each growing season, some alleles of Vrn-1 and Ppd-1 homoeologues showed different DH trends from the other alleles (Supplemental Figs. 7, 8). For example, the varieties with Hapl-III of Ppd-D1 headed earlier in Morioka in the 2019–2020 season compared to Tsukuba and Chikugo in the 2019–2020 season. There were clear differences in the daily mean temperature during cultivation between the two seasons at the three locations (Fig. 5, Supplemental Fig. 9). All three locations experienced colder temperatures in December and January of the 2019–2020 season, but warmer temperatures in March and April of the 2020–2021 season. In Morioka, the number of days below 0°C during the 2019–2020 and 2020–2021 seasons was 32 and 55 days, respectively. Furthermore, the total amount of snowfall from December to February during the 2019–2020 and 2020–2021 seasons was 107 cm and 173 cm, respectively. The average monthly temperatures from December to April during the 2019–2020 and 2020–2021 seasons were 1.3/0.2/1.0/4.8/7.3°C and 0.2/–2.8/–0.2/5.7/9.3°C in Morioka, 6.7/5.4/6.3/9.4/11.5°C and 5.2/3.1/6.3/11.1/13.5°C in Tsukuba and 9.1/8.5/8.7/11.8/13.8°C and 7.1/6.1/9.3/13.4/16.6°C in Chikugo, respectively (Supplemental Fig. 9).

Discussion
Environments can largely affect the timing of heading, and the timing of heading is considered an important trait for local adaptation. In wheat, Vrn-1 and Ppd-1 have been identified as the major genes for vernalization requirement and photoperiod sensitivity, respectively. In this study, we investigated whether the effect of Vrn-1 and Ppd-1 haplotypes on the timing of heading depends on the environment using 134 varieties, including 128 Japanese and six foreign varieties. Based on the genome-wide 519 SNPs, the ADMIXTURE analysis indicated that the 134 varieties were largely divided into four populations, named Population I, II, III and IV (Fig. 1A). The ML tree and PCA plot also supported this classification (Fig. 1B, 1C). Most varieties from the northeastern region (Hokkaido and Tohoku) were included in Population I and II. On the one hand, most of the varieties from the southwestern region (from Kanto to Kyushu) belonged to Population III and IV. The foreign varieties from the USA and Hungary, ‘Fielder’ (DITW094) and ‘GK Szemes’ (DITW101), belonged to Population I. On the other hand, the varieties from China, ‘Sumai 3’ (DITW088) and ‘Chinese Spring’ (DITW096), and Italy, ‘Ardito’ (DITW093), belonged to Population III. Many genetic resources, including foreign varieties (mainly from North America and Europe), have been introduced during breeding in northern areas of Japan, whereas limited genetic resources have been used in southwestern Japan. The clustering in this study reflected the history of wheat breeding in Japan, in agreement with a study by Kobayashi et al. (2016), which investigated the genetic diversity of Japanese wheat core collection based on genome-wide SNPs using genotyping-by-sequencing (GBS). Compared to the study by Kobayashi et al. (2016), this study included more modern varieties, and the phylogenetic relationship reflects recent breeding processes. For example, three varieties, ‘Biwahonami’ (DITW065), ‘Kanto 143’ (DITW118) and ‘Hakei W 1320’ (DITW134), from southwestern Japan, belonged to Population II (Fig. 1A, Supplemental Table 1), indicating that these varieties possess the genetic background of the winter wheat variety in Hokkaido. The winter wheat variety ‘Kitahonami’ (DITW001), belonging to Population II, is a leading variety in Hokkaido and is used as a breeding material because of its desirable traits such as yield and quality (Yanagisawa et al. 2007). Actually, ‘Kitahonami’ is used in the pedigree of these varieties.
We then examined the allele frequency of Vrn-1 and Ppd-1 homoeologues and heading time at three locations for two growing seasons using these 134 varieties. The varieties belonging to Population III and IV headed significantly earlier than those belonging to Population I and II (Fig. 2). The varieties belonging to Population III and IV frequently had Vrn-D1a/Vrn-D1b and Hapl-I of Ppd-D1, whereas the frequencies of these alleles were low in Population I and II (Table 1). Since either Vrn-D1a/Vrn-D1b or Hapl-I of Ppd-D1 did not confer early heading (Supplemental Table 5, Supplemental Fig. 5), both Vrn-D1a/Vrn-D1b and Hapl-I of Ppd-D1 were essential for early heading. In the west of Kanto, early maturing wheat varieties must avoid preharvest sprouting and Fusarium head blight during the rainy season. Thus, early varieties with both Vrn-D1a/Vrn-D1b and Hapl-I of Ppd-D1 were selected in the west of Kanto. On the other hand, the varieties from Tohoku/Hokuriku and winter varieties from Hokkaido possessed no spring alleles of Vrn-1 (Supplemental Table 4), which showed less tolerance to large amounts of snow and low temperatures. Thus, the preferred haplotypes of Ppd-1 and Vrn-1 have been selected in each region of Japan to adapt to the environment and reflected well on the population structure and breeding area. For Ppd-B1, CNVs, as well as mutations in the promoter region, have been known to confer photoperiod insensitivity (Díaz et al. 2012, Nishida et al. 2013). Ppd-B1a and Hapl-V of Ppd-B1 conferred early heading at three locations. Ppd-B1a is less preferred than Hapl-V even in west of the Kanto region (Supplemental Table 4). This is possibly because the varieties with Ppd-B1a started floral development and stem elongation earlier than the other insensitive alleles of Ppd-1 (Tanio and Kato 2007). By taking the genotypes of the other loci into consideration, it was shown that Ppd-A1a, Vrn-A1a and Vrn-B1a also contributed to early heading (Supplemental Table 5). Since the number of these varieties is small, we need to analyze on a larger scale to confirm the detailed effect of these genotypes on timing of heading. There were large DH variations even within the varieties with same haplotype of Vrn-1 and Ppd-1 (Supplemental Fig. 5, Supplemental Table 5), indicating the other gene or genes that determined differences in timing of heading among Japanese wheat varieties. The genotypes of Ppd-1 in Japanese wheat varieties have been investigated (Seki et al. 2011, 2013), and the information in these studies have generally been used for breeding. In this study, we included recent breeding varieties and investigated the detailed alleles of each gene and their effects on DH in Japanese wheat varieties. This data provides more practical haplotype information for breeding, which allows us to adjust the timing of heading.
Genotype-environment (G × E) interactions affect the timing of heading in durum wheat (Mohammadi et al. 2011). In this study, we also showed that DH was significantly (P < 0.01) affected by the genotype-environment interaction (Table 3). To investigate the interaction between haplotypes and environments on heading time, we compared the DH between environments by focusing on the haplotypes of Vrn-1 and Ppd-1 homoeologues. The AMMI2 biplot (Fig. 3) showed that there were 134 varieties that were clearly divided into clusters according to the varieties showing different vernalization requirements and photoperiod sensitivity, which were determined by the haplotypes of Vrn-1 and Ppd-1 homoeologues. In Morioka, the varieties with spring allele of Vrn-D1 headed earlier in the 2019–2020 season than in the 2020–2021 season compared with the varieties without spring alleles of Vrn-1 (Supplemental Fig. 4). In contrast, the difference in photoperiod sensitivity, which was determined by the alleles of Ppd-1 homoeologues, had little effect on the DH differences between the two growing seasons. Comparing temperature between the two seasons, the 2019–2020 season had higher temperatures during the winter months (December and January) and fewer days with daily mean temperatures below 0°C (Fig. 5). It has long been known that there is a correlation between growth habit and freezing tolerance and that wheat genotypes with a spring growth habit are less freezing tolerant than genotypes with a winter growth habit (Hayes and Aamodt 1927). However, more varieties died in the 2020–2021 season than in the 2019–2020 season due to snow mold rather than freezing. In fact, during the 2019–2020 season, the total amount of snowfall from December to February was 1.62 times higher than that during the 2020–2021 season. All of these varieties had one or more spring alleles of Vrn-1 (Supplemental Table 1). Spring varieties probably delayed heading owing to damage by snow mold. Thus, the DH difference between the two growing seasons in Morioka could be explained by the snow mold tolerance associated with the vernalization requirement. Recent genetic studies have shown that snow mold resistance is closely associated with the Vrn-1 homoeoloci on chromosomes 5A and 5D (Lozada et al. 2019, Nishio et al. 2020). The Vrn-A1b and Vrn-D1b alleles were less susceptible to environmental factors than the Vrn-A1a and Vrn-D1a alleles in Morioka. No varieties with Vrn-A1b and Vrn-D1b died in the two growing seasons in Morioka (Supplemental Table 1). This suggests that varieties with the Vrn-A1b and Vrn-D1b alleles were more resistant to snow mold than those with the Vrn-A1a and Vrn-D1a alleles. In Tsukuba and Chikugo, unlike Morioka, heading was basically earlier in the 2020–2021 season than the 2019–2020 season (Fig. 4), although the 2019–2020 season had higher effective accumulated temperatures until mid-April than the 2020–2021 season. The earlier heading in the 2020–2021 season might be due to higher temperatures from March to April in the 2020–2021 season than the 2019–2020 season. The timing of the temperature increase and the range of the temperature change might explain the different effects of the Vrn-1 and Ppd-1 alleles on the seasonal DH difference among the three locations. In Chikugo, the spring varieties with reduced photoperiod sensitivity (especially with Vrn-D1a/Vrn-D1b and Hapl-I of Ppd-D1) headed earlier in the 2019–2020 season than in the 2020–2021 season, whereas there were no significant inter-seasonal differences in DH between the varieties with different vernalization requirement and between the varieties with different photoperiod sensitivity in Tsukuba (Fig. 4). There is little difference in the timing of the day length change from short day to long day between Tsukuba and Chikugo, and the temperatures in Chikugo are on an average 2°C to 3°C higher than those in Tsukuba (Fig. 5, Supplemental Fig. 9). The latitude of Tsukuba and Chikugo are 36.03 and 33.21, respectively (Supplemental Table 2). Although the difference in day length during winter is about 15 minutes at maximum between Tsukuba and Chikugo, the date when the day changes from short day to long day is the same around March 17 in Tsukuba and Chikugo. Thus, the difference in temperature rather than the difference in day length between Tsukuba and Chikugo might explain the differences in responsiveness to winter warming in the spring and insensitive varieties between Tsukuba and Chikugo. Further analysis is needed to understand the difference between Tsukuba and Chikugo using growth chambers with fine temperature control. The long-term accumulation of data for heading time at various locations, together with meteorological data, will make it possible to predict the timing of heading and to breed wheat varieties that head at the appropriate time, even in fluctuating environments.
Author Contribution Statement
HM, MY, MN, KN, AN, KH, CK and MF conducted the field evaluations. GI performed amplicon sequencing. MC and FK performed genotyping using the PCR markers. HM, MF, KH, MK, MC and FK selected wheat materials for this study and designed the experimental studies in the field. NM analyzed and interpreted the raw data. NM also conceived the draft of the manuscript and wrote the manuscript. FK conceived and designed the study for raw data acquisition and managed all the raw data. FK also revised the manuscript accordingly and provided final confirmation. FK was responsible for all of materials used in this study and of raw data for heading time and genotypes of these materials. NM was responsible for the analysis of all raw data and its interpretation. As FK and NM have equal and separate responsibilities for this manuscript, they are the corresponding authors. All authors have read and approved the final manuscript.
Acknowledgments
This study was supported by a grant from the Ministry of Agriculture, Forestry and Fisheries of Japan [Smart-breeding system for Innovative Agriculture (DIT1002)]. We thank Hidekazu Maejima (Nagano Prefectural Agricultural Experiment Station), Masayoshi Hirooka (Gunma Agricultural Technology Center), Mizuho Arakawa (Aichi Agricultural Research Center), Hitoshi Kiuchi (Hokkaido Research Organization Kitami Agricultural Experiment Station), Shizen Ohnishi (Hokkaido Research Organization Kitami Agricultural Experiment Station), Yusuke Ban (Western Region Agricultural Research Center, NARO) and Kanenori Takata (Western Region Agricultural Research Center, NARO) for providing wheat seeds. We are grateful to Masashi Kasuya (Hokkaido Research Organization Kitami Agricultural Experiment Station) for support in material selection. The authors also thank Miyuki Oda and Megumi Araki (Institute of Crop Science, NARO) for their assistance with data acquisition.
Literature Cited
- Alexander, D.H., J. Novembre and K. Lange (2009) Fast model-based estimation of ancestry in unrelated individuals. Genome Res 19: 1655–1664.
- Beales, J., A. Turner, S. Griffiths, J.W. Snape and D.A. Laurie (2007) A pseudo-response regulator is misexpressed in the photoperiod insensitive Ppd-D1a mutant of wheat (Triticum aestivum L.). Theor Appl Genet 115: 721–733.
- Behr, A.A., K.Z. Liu, G. Liu-Fang, P. Nakka and S. Ramachandran (2016) pong: fast analysis and visualization of latent clusters in population genetic data. Bioinformatics 32: 2817–2823.
- Bennett, D., A. Izanloo, J. Edwards, H. Kuchel, K. Chalmers, M. Tester, M. Reynolds, T. Schnurbusch and P. Langridge (2012) Identification of novel quantitative trait loci for days to ear emergence and flag leaf glaucousness in a bread wheat (Triticum aestivum L.) population adapted to southern Australian conditions. Theor Appl Genet 124: 697–711.
- Bentley, A.R., R. Horsnell, C.P. Werner, A.S. Turner, G.A. Rose, C. Bedard, P. Howell, E.P. Wilhelm, I.J. Mackay, R.M. Howells et al. (2013) Short, natural, and extended photoperiod response in BC2F4 lines of bread wheat with different photoperiod-1 (Ppd-1) alleles. J Exp Bot 64: 1783–1793.
- Bolger, A.M., M. Lohse and B. Usadel (2014) Trimmomatic: a flexible trimmer for Illumina sequence data. Bioinformatics 30: 2114–2120.
- Bradbury, P.J., Z. Zhang, D.E. Kroon, T.M. Casstevens, Y. Ramdoss and E.S. Buckler (2007) TASSEL: software for association mapping of complex traits in diverse samples. Bioinformatics 23: 2633–2635.
- Chen, F., M. Gao, J. Zhang, A. Zuo, X. Shang and D. Cui (2013) Molecular characterization of vernalization and response genes in bread wheat from the Yellow and Huai Valley of China. BMC Plant Biol 13: 199.
- Chen, S., J. Wang, G. Deng, L. Chen, X. Cheng, H. Xu and K. Zhan (2018) Interactive effects of multiple vernalization (Vrn-1)- and photoperiod (Ppd-1)-related genes on the growth habit of bread wheat and their association with heading and flowering time. BMC Plant Biol 18: 374.
- de Mendiburu, F. and M. Yaseen (2020) Agricolae: Statistical procedures for agricultural research. https://cran.r-project.org/package=agricolae.
- DePristo, M.A., E. Banks, R. Poplin, K.V. Garimella, J.R. Maguire, C. Hartl, A.A. Philippakis, G. del Angel, M.A. Rivas, M. Hanna et al. (2011) A framework for variation discovery and genotyping using next-generation DNA sequencing data. Nat Genet 43: 491–498.
- Díaz, A., M. Zikhali, A.S. Turner, P. Isaac and D.A. Laurie (2012) Copy number variation affecting the Photoperiod-B1 and Vernalization-A1 genes is associated with altered flowering time in wheat (Triticum aestivum). PLoS One 7: e33234.
- Eltaher, S., P.S. Baenziger, V. Belamkar, H.A. Emara, A.A. Nower, K.F.M. Salem, A.M. Alqudah and A. Sallam (2021) GWAS revealed effect of genotype × environment interactions for grain yield of Nebraska winter wheat. BMC Genomics 22: 2.
- Fu, D., P. Szucs, L. Yan, M. Helguera, J.S. Skinner, J. von Zitzewitz, P.M. Hayes and J. Dubcovsky (2005) Large deletions within the first intron in VRN-1 are associated with spring growth habit in barley and wheat. Mol Genet Genomics 273: 54–65.
- Guedira, M., M. Xiong, Y.F. Hao, J. Johnson, S. Harrison, D. Marshall and G. Brown-Guedira (2016) Heading date QTL in winter wheat (Triticum aestivum L.) coincide with major developmental genes VERNALIZATION1 and PHOTOPERIOD1. PLoS One 11: e0154242.
- Hayes, H.K. and O.S. Aamodt (1927) Inheritance of winter hardiness and growth habit in crosses of Marquis with Minhardi and Min-turki wheats. J Agric Res 35: 223–236.
- Iehisa, J.C.M., R. Ohno, T. Kimura, H. Enoki, S. Nishimura, Y. Okamoto, S. Nasuda and S. Takumi (2014) A high-density genetic map with array-based markers facilitates structural and quantitative trait locus analyses of the common wheat genome. DNA Res 21: 555–567.
- Ishikawa, G., M. Saito, T. Tanaka, Y. Katayose, H. Kanamori, K. Kurita and T. Nakamura (2018) An efficient approach for the development of genome-specific markers in allohexaploid wheat (Triticum aestivum L.) and its application in the construction of high-density linkage maps of the D genome. DNA Res 25: 317–326.
- Kippes, N., J.M. Debernardi, H.A. Vasquez-Gross, B.A. Akpinar, H. Budak, K. Kato, S. Chao, E. Akhunov and J. Dubcovsky (2015) Identification of the VERNALIZATION 4 gene reveals the origin of spring growth habit in ancient wheats from South Asia. Proc Natl Acad Sci USA 112: E5401–E5410.
- Kippes, N., A. Chen, X. Zhang, A.J. Lukaszewski and J. Dubcovsky (2016) Development and characterization of a spring hexaploid wheat line with no functional VRN2 genes. Theor Appl Genet 129: 1417–1428.
- Kobayashi, F., T. Tanaka, H. Kanamori, J. Wu, Y. Katayose and H. Handa (2016) Characterization of a mini core collection of Japanese wheat varieties using single-nucleotide polymorphisms generated by genotyping-by-sequencing. Breed Sci 66: 213–225.
- Kozlov, A.M., D. Darriba, T. Flouri, B. Morel and A. Stamatakis (2019) RaxML-NG: a fast, scalable and user-friendly tool for maximum likelihood phylogenetic inference. Bioinformatics 35: 4453–4455.
- Li, H. and R. Durbin (2009) Fast and accurate short read alignment with Burrows-Wheeler transform. Bioinformatics 25: 1754–1760.
- Lozada, D., J.V. Godoy, T.D. Murray, B.P. Ward and A.H. Carter (2019) Genetic dissection of snow mold tolerance in US pacific northwest winter wheat through genome-wide association study and genomic selection. Front Plant Sci 10: 1337.
- Mizuno, N., M. Nitta, K. Sato and S. Nasuda (2012) A wheat homologue of PHYTOCLOCK 1 is a candidate gene conferring the early heading phenotype to einkorn wheat. Genes Genet Syst 87: 357–367.
- Mizuno, N., M. Kinoshita, S. Kinoshita, H. Nishida, M. Fujita, K. Kato, K. Murai and S. Nasuda (2016) Loss-of-function mutations in three homoeologous PHYTOCLOCK 1 genes in common wheat are associated with the extra-early flowering phenotype. PLoS One 11: e0165618.
- Mizuno, N., G. Ishikawa, H. Kojima, M. Tougou, C. Kiribuchi-Otobe, M. Fujita and K. Nakamura (2021) Genetic mechanisms determining grain number distribution along the spike and their effect on yield components in wheat. Mol Breed 41: 62.
- Mohammadi, R., M. Armion, D. Sadeghzadeh, A. Amri and M. Nachit (2011) Analysis of genotype-by-environment interaction for agronomic traits of durum wheat in Iran. Plant Prod Sci 14: 15–21.
- Nehe, A., B. Akin, T. Sanal, A.K. Evlice, R. Ünsal, N. Dinçer, L. Demir, H. Geren, I. Sevim, Ş. Orhan et al. (2019) Genotype × environment interaction and genetic gain for grain yield and grain quality traits in Turkish spring wheat released between 1964 and 2010. PLoS One 14: e0219432.
- Nguyen, A.T., J.C. Iehisa, N. Mizuno, M. Nitta, S. Nasuda and S. Takumi (2013) Differential contribution of two Ppd-1 homoeoalleles to early-flowering phenotype in Nepalese and Japanese varieties of common wheat. Breed Sci 63: 374–383.
- Nishida, H., T. Yoshida, K. Kawakami, M. Fujita, B. Long, Y. Akashi, D.A. Laurie and K. Kato (2013) Structural variation in the 5ʹ upstream region of photoperiod-insensitive alleles Ppd-A1a and Ppd-B1a identified in hexaploid wheat (Triticum aestivum L.), and their effect on heading time. Mol Breed 31: 27–37.
- Nishio, Z., N. Iriki, M. Ito, T. Tabiki and T. Murray (2020) Mapping QTL conferring speckled snow mold resistance in winter wheat (Triticum aestivum L.). Breed Sci 70: 246–252.
- Sato, K., M. Ishii, K. Takahagi, K. Inoue, M. Shimizu, Y. Uehara-Yamaguchi, R. Nishii and K. Mochida (2020) Genetic factors associated with heading responses revealed by field evaluation of 274 barley accessions for 20 seasons. iScience 23: 101146.
- Seki, M., M. Chono, H. Matsunaka, M. Fujita, S. Oda, K. Kubo, C. Kiribuchi-Otobe, H. Kojima, H. Nishida and K. Kato (2011) Distribution of photoperiod-insensitive alleles Ppd-B1a and Ppd-D1a and their effect on heading time in Japanese wheat cultivars. Breed Sci 61: 405–412.
- Seki, M., M. Chono, T. Nishimura, M. Sato, Y. Yoshimura, H. Matsunaka, M. Fujita, S. Oda, K. Kubo, C. Kiribuchi-Otobe et al. (2013) Distribution of photoperiod-insensitive allele Ppd-A1a and its effect on heading time in Japanese wheat cultivars. Breed Sci 63: 309–316.
- Shaw, L.M., A.S. Turner and D.A. Laurie (2012) The impact of photoperiod insensitive Ppd-1a mutations on the photoperiod pathway across the three genomes of hexaploid wheat (Triticum aestivum). Plant J 71: 71–84.
- Shi, C., L. Zhao, X. Zhang, G. Lv, Y. Pan and F. Chen (2019) Gene regulatory network and abundant genetic variation play critical roles in heading stage of polyploidy wheat. BMC Plant Biol 19: 6.
- Tanio, M. and K. Kato (2007) Development of near-isogenic lines for photoperiod-insensitive genes, Ppd-B1 and Ppd-D1, carried by Japanese wheat cultivars and their effect on apical development. Breed Sci 57: 65–72.
- Turner, A., J. Beales, S. Faure, R.P. Dunford and D.A. Laurie (2005) The pseudo-response regulator Ppd-H1 provides adaptation to photoperiod in barley. Science 310: 1031–1034.
- Wickham, H. (2016) ggplot2: Elegant Graphics for Data Analysis. Springer-Verlag, New York, NY, p. 276.
- Wilhelm, E.P., A.S. Turner and D.A. Laurie (2009) Photoperiod insensitive Ppd-A1a mutations in tetraploid wheat (Triticum durum Desf.). Theor Appl Genet 118: 285–294.
- Yan, L., A. Loukoianov, G. Tranquilli, M. Helguera, T. Fahima and J. Dubcovsky (2003) Positional cloning of the wheat vernalization gene VRN1. Proc Natl Acad Sci USA 100: 6263–6268.
- Yan, L., A. Loukoianov, A. Blechl, G. Tranquilli, W. Ramakrishna, P. SanMiguel, J.L. Bennetzen, V. Echenique and J. Dubcovsky (2004a) The wheat VRN2 gene is a flowering repressor down-regulated by vernalization. Science 303: 1640–1644.
- Yan, L., M. Helguera, K. Kato, S. Fukuyama, J. Sherman and J. Dubcovsky (2004b) Allelic variation at the VRN-1 promoter region in polyploid wheat. Theor Appl Genet 109: 1677–1686.
- Yan, L., D. Fu, C. Li, A. Blechl, G. Tranquilli, M. Bonafede, A. Sanchez, M. Valarik, S. Yasuda and J. Dubcovsky (2006) The wheat and barley vernalization gene VRN3 is an orthologue of FT. Proc Natl Acad Sci USA 103: 19581–19586.
- Yanagisawa, A., Y. Yoshimura, Y. Amano, S. Kobayashi, T. Nishimura, K. Nakamichi, K. Araki, K. Tanifuji, T. Tabiki, K. Mikami et al. (2007) A new winter wheat variety “Kitahonami”. Bulletin of Hokkaido Prefectural Agricultural Experiment Stations 91: 1–13.
- Zhang, J., Y. Wang, S. Wu, J. Yang, H. Liu and Y. Zhou (2012) A single nucleotide polymorphism at the Vrn-D1 promoter region in common wheat is associated with vernalization response. Theor Appl Genet 125: 1697–1704.
- Zhang, X., M. Gao, S. Wang, F. Chen and D. Cui (2015) Allelic variation at the vernalization and photoperiod sensitivity loci in Chinese winter wheat cultivars (Triticum aestivum L.). Front Plant Sci 6: 470.

