Abstract
Reduced fertilizer usage is one of the objectives of field management in the pursuit of sustainable agriculture. Here, we report on shifts of bacterial communities in paddy rice ecosystems with low (LN), standard (SN), and high (HN) levels of N fertilizer application (0, 30, and 300 kg N ha−1, respectively). The LN field had received no N fertilizer for 5 years prior to the experiment. The LN and HN plants showed a 50% decrease and a 60% increase in biomass compared with the SN plant biomass, respectively. Analyses of 16S rRNA genes suggested shifts of bacterial communities between the LN and SN root microbiomes, which were statistically confirmed by metagenome analyses. The relative abundances of Burkholderia, Bradyrhizobium and Methylosinus were significantly increased in root microbiome of the LN field relative to the SN field. Conversely, the abundance of methanogenic archaea was reduced in the LN field relative to the SN field. The functional genes for methane oxidation (pmo and mmo) and plant association (acdS and iaaMH) were significantly abundant in the LN root microbiome. Quantitative PCR of pmoA/mcrA genes and a 13C methane experiment provided evidence of more active methane oxidation in the rice roots of the LN field. In addition, functional genes for the metabolism of N, S, Fe, and aromatic compounds were more abundant in the LN root microbiome. These results suggest that low-N-fertilizer management is an important factor in shaping the microbial community structure containing key microbes for plant associations and biogeochemical processes in paddy rice ecosystems.
Rice is one of the most important cereal crops in the world and is grown mainly in flooded paddy fields with the implicit or explicit objective of sustainably maintaining soil fertility (25). Biogeochemical processes including the emission of methane, a greenhouse gas, occur actively in paddy rice ecosystems, and the rhizosphere in a paddy field is considered to be a hot spot for the redox transformation of a variety of inorganic substances, including Fe, S and N (21, 25, 28). These processes are principally mediated by microbial communities. Rice roots play a role in that they supply O2 and root organic matter (exudates, dead roots) to the rhizosphere. Microbial community dynamics and structure-function relationships have been intensively studied for methanogens and methanotrophs in flooded rice paddies (7, 10, 21, 25, 33). However, the complex systems of key microbial players and their functions in these biogeochemical processes have been not fully elucidated in paddy rice fields.
Nitrogen is the most important mineral nutrient for crop production, and an adequate supply of N fertilizer is essential for sustaining high yields. However, the production of synthetic N fertilizers requires large amounts of fossil fuel, and their heavy use results in environmental problems. Human alteration of N cycles is therefore held to harm human and ecosystem health (11). Nitrogen fertilization levels are generally thought to affect methane emission from rice fields, although this topic is currently under debate (1, 5, 44, 48). To attain more sustainable agriculture, knowledge-based optimum N fertilization has been proposed in agricultural ecosystems, including paddy fields (22).
Massive parallel sequencing technologies enable us to characterize more comprehensive, whole structures of microbial communities in diverse environments and therefore allow us to assess changes in community composition by environmental factors (29). A technique for bacterial cell enrichment from plant tissues (18) has provided a gateway for the metagenome analysis of plant-associated bacteria (20). By combining these methodologies, we are now able to assess the functional diversities of plant-associated microbiomes by metagenomic analysis, as shown for a diverse range of environments (29).
Here we report global shifts in microbial communities in paddy rice ecosystems under different N fertilizer regimes by analyses of bacterial 16S rRNA genes and community metagenomics. The results of microbial communities revealed that low N fertilization management has considerable impact on the biogeochemical processes and plant nutrient uptake of a wide variety of substances in a paddy field ecosystem.
Materials and Methods
Plant materials
Rice (Oryza sativa L. cv. Nipponbare) seeds were germinated on filter paper (Advantec-Toyo, Tokyo, Japan) at 30°C. After 2 days, the germinated seeds were sown in commercial soil (Mitsui-Toatsu No. 3, Tokyo, Japan) in a 60×30 cm cell tray (1.5 cm cell diameter, 3 cm depth) and grown in a greenhouse under natural light for 4 weeks. A total of 300 seedlings, 100 for each treatment, were transplanted on 20 May 2009 into planting hills arranged in a square pattern of 10×10 plants at 30 cm spacing in experimental paddy fields of Kashimadai Experimental Station (Tohoku University; (38°27″37′ N and 141°5″33′ E). Rice plants were cultivated under waterlogged conditions (water depth, 30 cm). Shoot length, tiller number, and shoot fresh weight were measured at the booting stage (90 days after transplanting).
Fertilization
Rice seedlings were grown in three neighboring fields (approximately 400 m2 each) at different levels of N fertilization (standard N, SN; low N, LN; and high N, HN) (Fig. S1). From 2004 to 2009, the SN paddy field was fertilized with N, P, and K (Temairazu 666; Co-op Chemical, Tokyo, Japan) at a rate of 30 kg ha−1 each (expressed as N, P2O5 and K2O). In the LN field, only P and K were applied using P–K fertilizer No. 46 (Co-op Chemical) at 30 kg ha−1 each (expressed as P2O5 and K2O). The LN paddy field had been managed for rice cultivation using identical field management methods as for the SN field except for the withholding of N fertilizer from 2004 on. In the HN paddy field, for the 2009 growing season, N, P, and K were applied at 30 kg ha−1 each (expressed as N, P2O5 and K2O) as basal fertilizer similar to the SN field. During cultivation, 30 or 60 kg ha−1 of ammonium sulfate (Ube Agri-Materials, Tokyo, Japan) was additionally applied every 2 weeks until 270 kg N ha−1 had been applied. Thus, the HN field was totally subjected to 300 kg ha−1 as N fertilizer.
DNA preparation
Rice plants and bulk soils were sampled from the field at the booting stage on 26 August 2009. The rice plants were carefully washed with tap water until no soil particles remained. Three sets of the composite samples including at least three rice plants were independently prepared for the roots or shoots (approximately 100 g each) in each treatment, and then stored at −80°C until they were used. The composite samples of roots or shoots were homogenized without surface sterilization to prepare shoot- and root-associated bacterial cells containing both epiphytes and endophytes. The bacterial cells were independently extracted and purified using a method for the enrichment of bacterial cells from each set of the plant composite samples (18). DNase treatment was added to the procedure to remove plant DNA. After the final bacterial cell suspension was incubated in the presence of recombinant DNase I (Takara, Otsu, Japan) for 20 min at 37°C, according to the instructions of the manufacturer, the reaction was terminated by the addition of 0.5 M EDTA at a final concentration of 25 mM. Bulk soils were sampled similar to the rice plants (0–15 cm depth and triplicates), and then stored at −80°C until they were used. Total DNA of the enriched bacterial cells and bulk soils was extracted by the method of Ikeda et al. (17, 20). The quality and quantity of DNA were assessed spectrophotometrically from the absorbance at a wavelength of 260 nm (A260) and the A260/A230 and A260/A280 ratios.
Sequence analyses
The construction of PCR clone libraries of rice shoot and roots grown in the LN, SN and HN fields for 16S rRNA genes, their sequencing by the Sanger method, statistics, and phylogenetic analysis were carried out as described previously (17–20). Briefly, 50 ng total bacterial DNA was used as a template in a final reaction volume of 60 μL, including 90 pmol of each primer and 9 U of Ex Taq DNA polymerase (Takara Bio, Otsu, Japan). The universal primers 27F (50-AGAGTTTGATCMTGGCTCAG-30) and 1525R (50-AAGGAGGTGWTCCARCC-30) were used. A partial sequence of the 16S rRNA gene was obtained using the 27F primer. Then the 16S rRNA gene (corresponding to bp 109–665 of the Escherichia coli 16S rRNA gene) was used for sequence analyses. Only for the Sanger method, three replicated samples were combined for each treatment before sequencing.
The DNAs of the enriched bacterial cells from the LN and SN root microbiomes were shotgun-sequenced by means of a 454 GS FLX Titanium pyrosequencer with three replications for statistical analysis. The metagenomic reads in each sample were taxonomically assigned according to the best-hit pairs in BLASTX analysis against the GenBank NR database with an E-value threshold of 10−10. Gene IDs for all hits were collected and phylogenetically placed with an in-house script. For pyrosequencing of 16S rRNA genes of soil- and root-associated bacteria, the 16S rRNA genes were amplified using Bac-27F and MID-518R primers and sequenced on the 454 GS FLX Titanium pyrosequencer. Taxonomy was assigned using the Ribosomal Database Project (RDP) MultiClassifier with a minimum support threshold of 50%. The Fast UniFrac algorithm (13) was used to determine the degree of bacterial diversity between the communities. More detailed information on sequence analyses is given in the Supplementary Materials.
Prediction of functional gene categories from metagenome sequences
The metabolic potentials of each microbiome were also assessed by BLASTX search (E-value <10−5) of the SEED database on the MG-RAST server (35). The metagenomic reads were uploaded to the MG-RAST Web site (http://metagenomics.nmpdr.org/). After we retrieved the target functional gene categories for N2 fixation, methane cycling, and plant hormones, we selected subcategories whose abundance was >2× in the LN roots that in the SN roots (P <0.01). More detailed information on functional gene analysis is given in the Supplementary Materials.
Quantitative PCR
Quantitative PCR was carried out with a Thermal Cycler Dice Real Time System (TaKaRa, Shiga, Japan) with primers mcrA-f and mcrA-r (30) for the mcrA gene (47), or A189f (15) and mb661r (9) for the pmoA gene (26). The PCR conditions were 45 cycles of denaturation at 95°C for 40 s, annealing at 55°C for 30 s, and extension at 72°C for 60 s for mcrA; and 40 cycles of denaturation at 95°C for 30 s, annealing at 65.5°C for 20 s, and extension at 72°C for 40 s for pmoA. Clones of pmoA genes derived from Methylosinus trichosporium strain OB3b (acc. no. U31650) and Methylomonas sp. strain Fw12E-Y (acc. no. AB538965) were used as the standard reference for the quantification of pmoA genes.
Feeding of 13C-labeled methane
Rice roots (Oryza sativa cv. Nipponbare) were sampled from the LN and SN paddy fields and then washed with tap water. The root systems were immediately introduced into the bag assembly (approximately 1 liter) with a sampling port (2). The gas phase in the assembly was replaced by 10% (v/v) 13C-labeled methane (99.9 atom%; Shoko, Tokyo, Japan) in the air. Negative control was conducted with the same assembly without 13C-labeled methane. After static incubation of the root systems in the assembly at 25°C for 26 h in the dark, they were dried at 80°C for 3 days and then powdered in a blender (HBF400; Hamilton Beach, Glen Allen, VA, USA). To estimate the amount of 13C assimilated by methanotrophs in the root systems, the 13C and total carbon contents of the powdered rice root tissues were determined by a mass spectrometer (EA1110-DELTAplus Advantage ConFlo III System; Thermo Fisher Scientific, Bremen, Germany).
Soil analysis
Bulk soil of paddy fields under low N (LN) and standard N (SN) conditions was air-dried, and sieved through a 2-mm-mesh sieve. Total N, NH4+, and NO3− were determined as described (16). Organic substance content and cation exchange capacity (CEC) were determined by Tokachi Federation Cooperatives (Tokachi, Obihiro, Japan).
Nucleotide sequence accession number
Nucleotide sequences of 16S rRNA bacterial genes have been deposited in the DDBJ database as follows: LN shoots (accession numbers AB579015–AB579146), SN shoots (AB579147– AB579297), HN shoots (AB579298–AB579456), LN roots (AB579457–AB579568), SN roots (AB579569–AB579659), and HN roots (AB579660–AB579765). Metagenomic and 16S rRNA sequences obtained by the 454 GS FLX Titanium pyrosequencer have been deposited in the NCBI database under project ID 61421 (DDBJ Sequence Read Archive, DRA000321).
Results
Rice growth
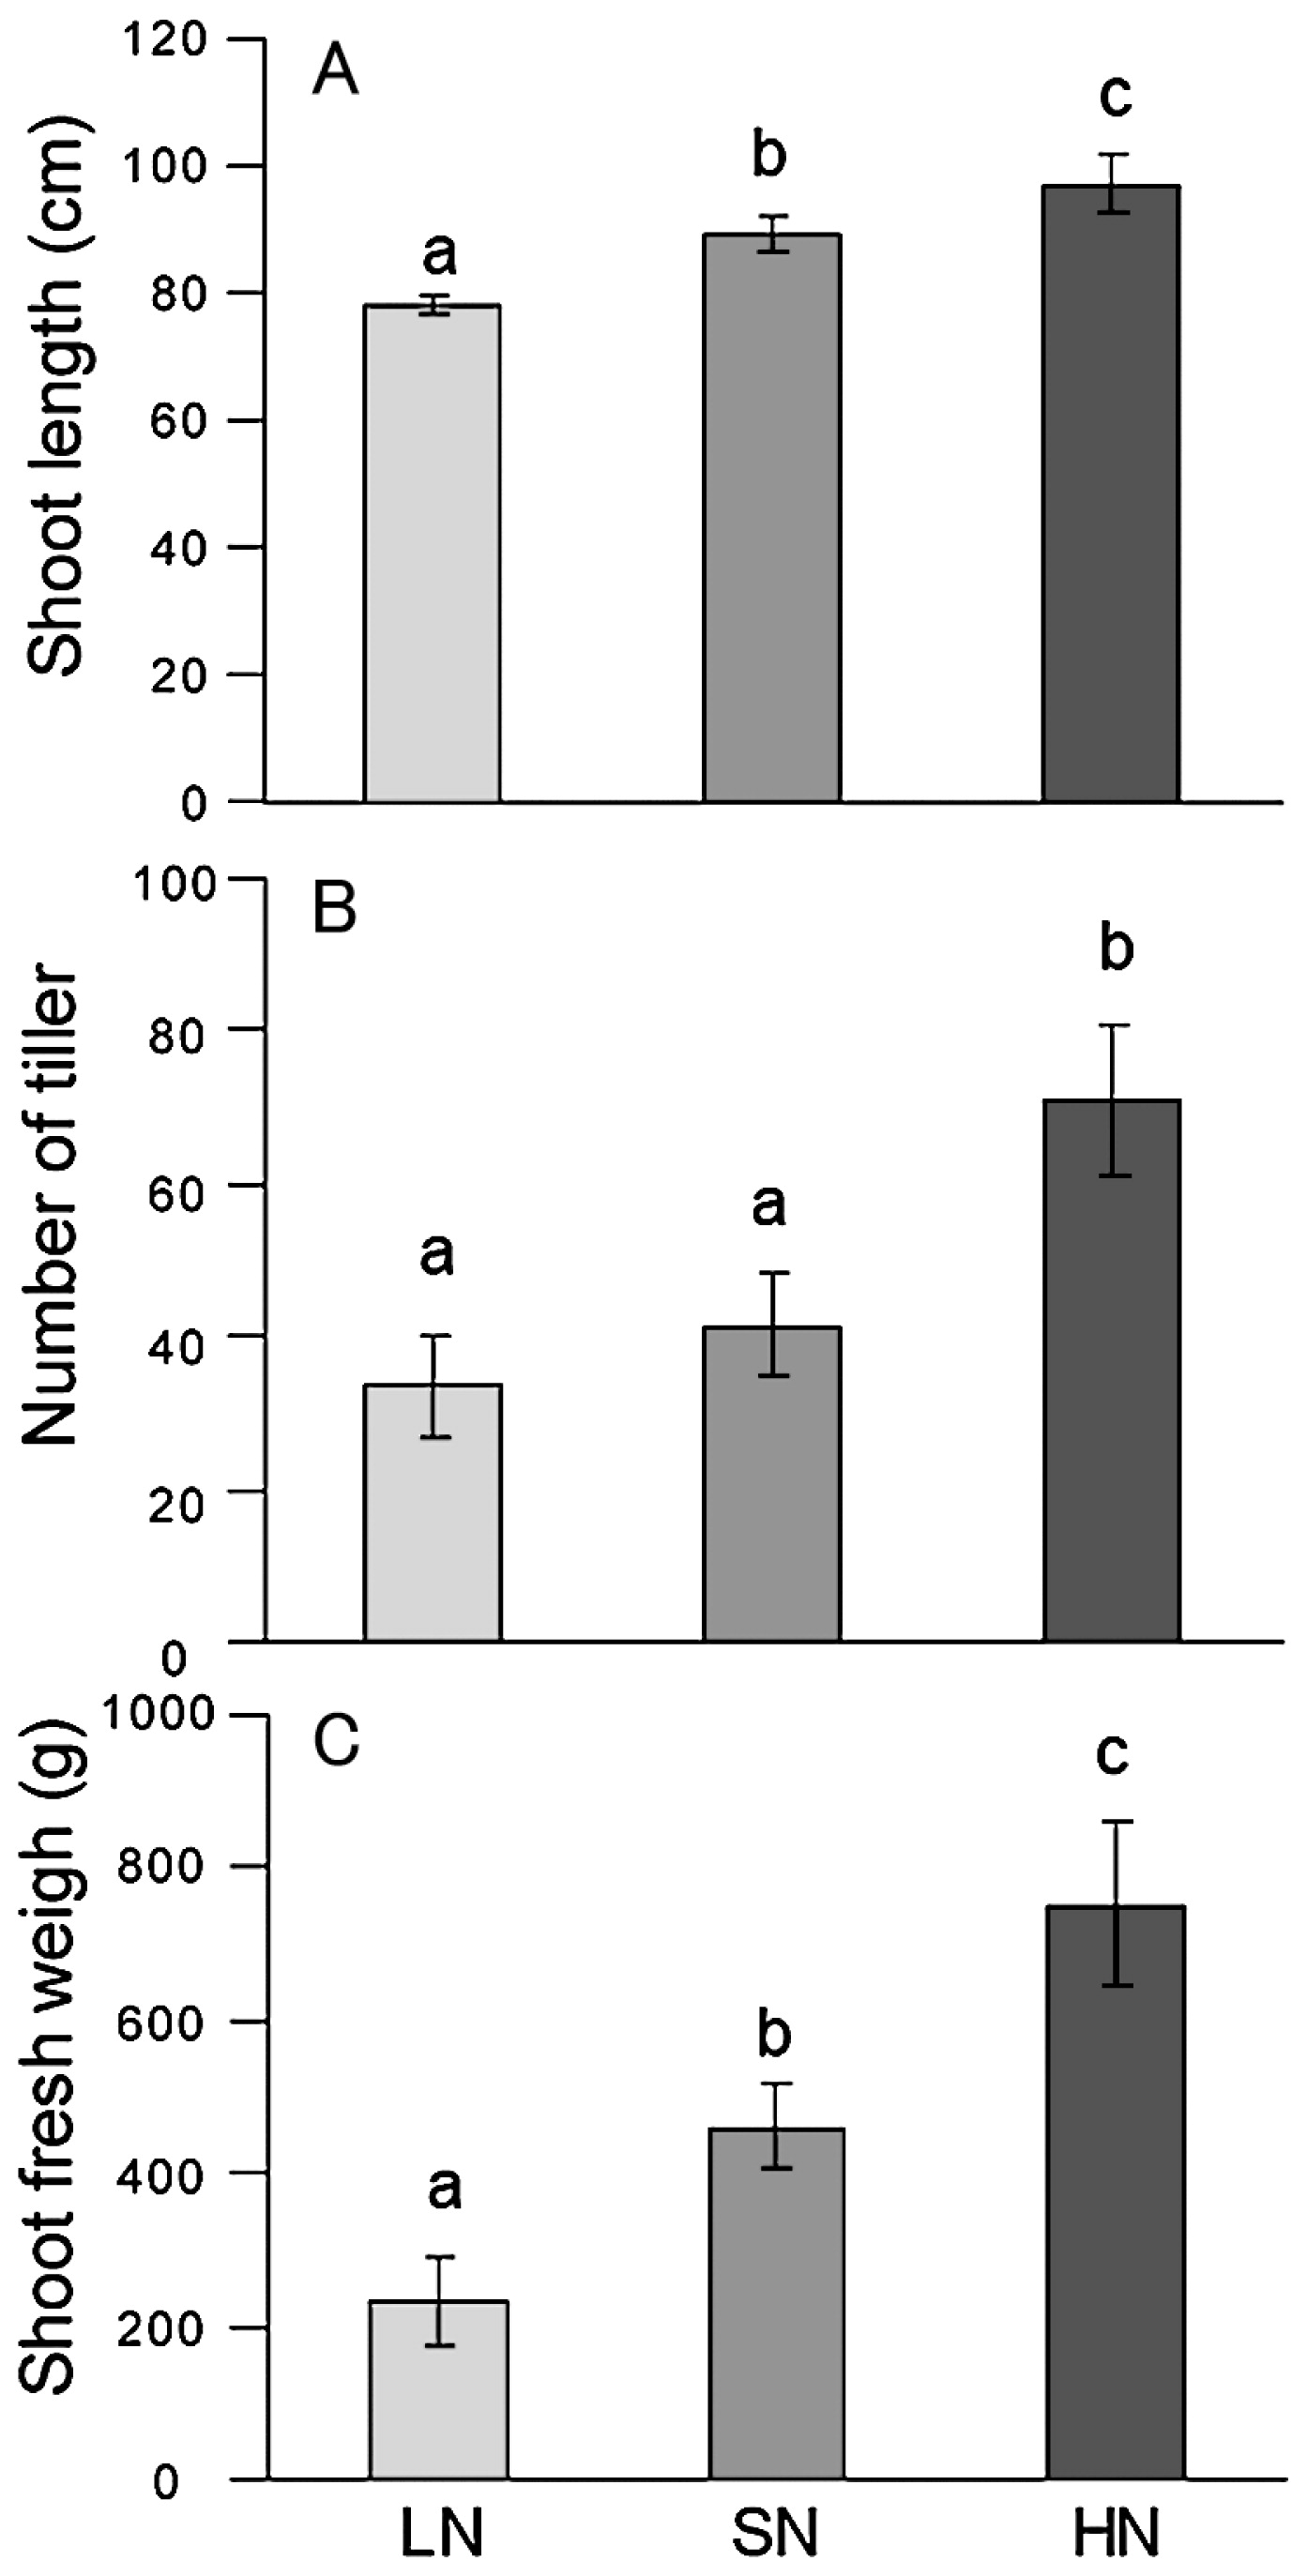
Rice plants were grown in paddy fields with three levels of N fertilizer application—low (LN), standard N (SN) and high (HN)—with application rates of 0, 30, and 300 kg N ha−1, respectively. Prior to the experiments, the LN field had not received N fertilizer for 5 years (Fig. S1). Rice growth positively responded to the amount of N fertilizer application (Fig. 1, Fig. S1). The shoot length, and biomass of the LN plants significantly decreased as compared with the SN plants (Fig. 1). On the other hand, the growth indexes (shoot length, tiller number and shoot fresh weight) of HN plants significantly increased as compared with the SN plants (Fig. 1). Based on the SN plant biomass (shoot fresh weight), LN and HN plants showed a 50% decrease and a 60% increase in plant biomass, respectively. Thus, we examined how the rice-associated bacterial communities responded to N fertilizer levels.
Phylogenetic diversity by clone library analysis
The enriched bacterial cells from rice shoots and roots were subjected to clone library analyses of bacterial 16S rRNA genes. The root microbiome of rice plants from the LN fields had the lowest number of operational taxonomic units (OTUs) and the lowest values of the Shannon and Simpson diversity indexes among all libraries (Table 1). For the shoot microbiomes, the numbers of OTUs and diversity indexes among libraries were similar regardless of the N fertilization level.
Table 1
Statistical analysis of 16S rRNA gene clone libraries derived from rice shoot- and root-associated bacteria
a
| Tissue |
Shoot |
Root |
|
|
|
| N fertilization levelb |
LN |
SN |
HN |
LN |
SN |
HN |
| Statistics |
| No. of sequences |
132 |
151 |
159 |
112 |
91 |
106 |
| Library coverage, Cx (%)c |
71.2 |
69.5 |
75.5 |
82.1 |
61.5 |
70.8 |
| No. of OTUsd |
59 |
71 |
62 |
33 |
44 |
53 |
| Diversity indexes |
| Shannon index (H′) |
3.7 |
3.9 |
3.7 |
2.8 |
3.2 |
3.7 |
| Simpson index (1/D) |
33.1 |
36.7 |
30.7 |
10.1 |
13.8 |
38.9 |
a Abbreviations: OTUs, operational taxonomic units; rRNA, ribosomal RNA. The lower values of number of OTUs and diversity indexes are shaded in grey.
b The LN, SN, and HN indicate N fertilization at low, standard, and high levels (see main text).
c
Cx = 1 − (
nx/N), where
nx is the number of singletons encountered only once in a library and
N is the total number of clones.
d OTUs were defined at 95% sequence identity. Shaded values are the lowest number of OUT and diversity indexes.
In principal coordinate analysis (PCoA), shoot and root microbiomes were differentiated along PC1 (37.5%; Fig. 2A), whereas the effects of the N fertilization level were explained as unidirectional shifts in community structure along PC2 (17.7%) for both microbiomes (Fig. 2A). In particular, the root microbiomes appeared to have distinct community structures in response to different N fertilizer levels (Fig. 2A).
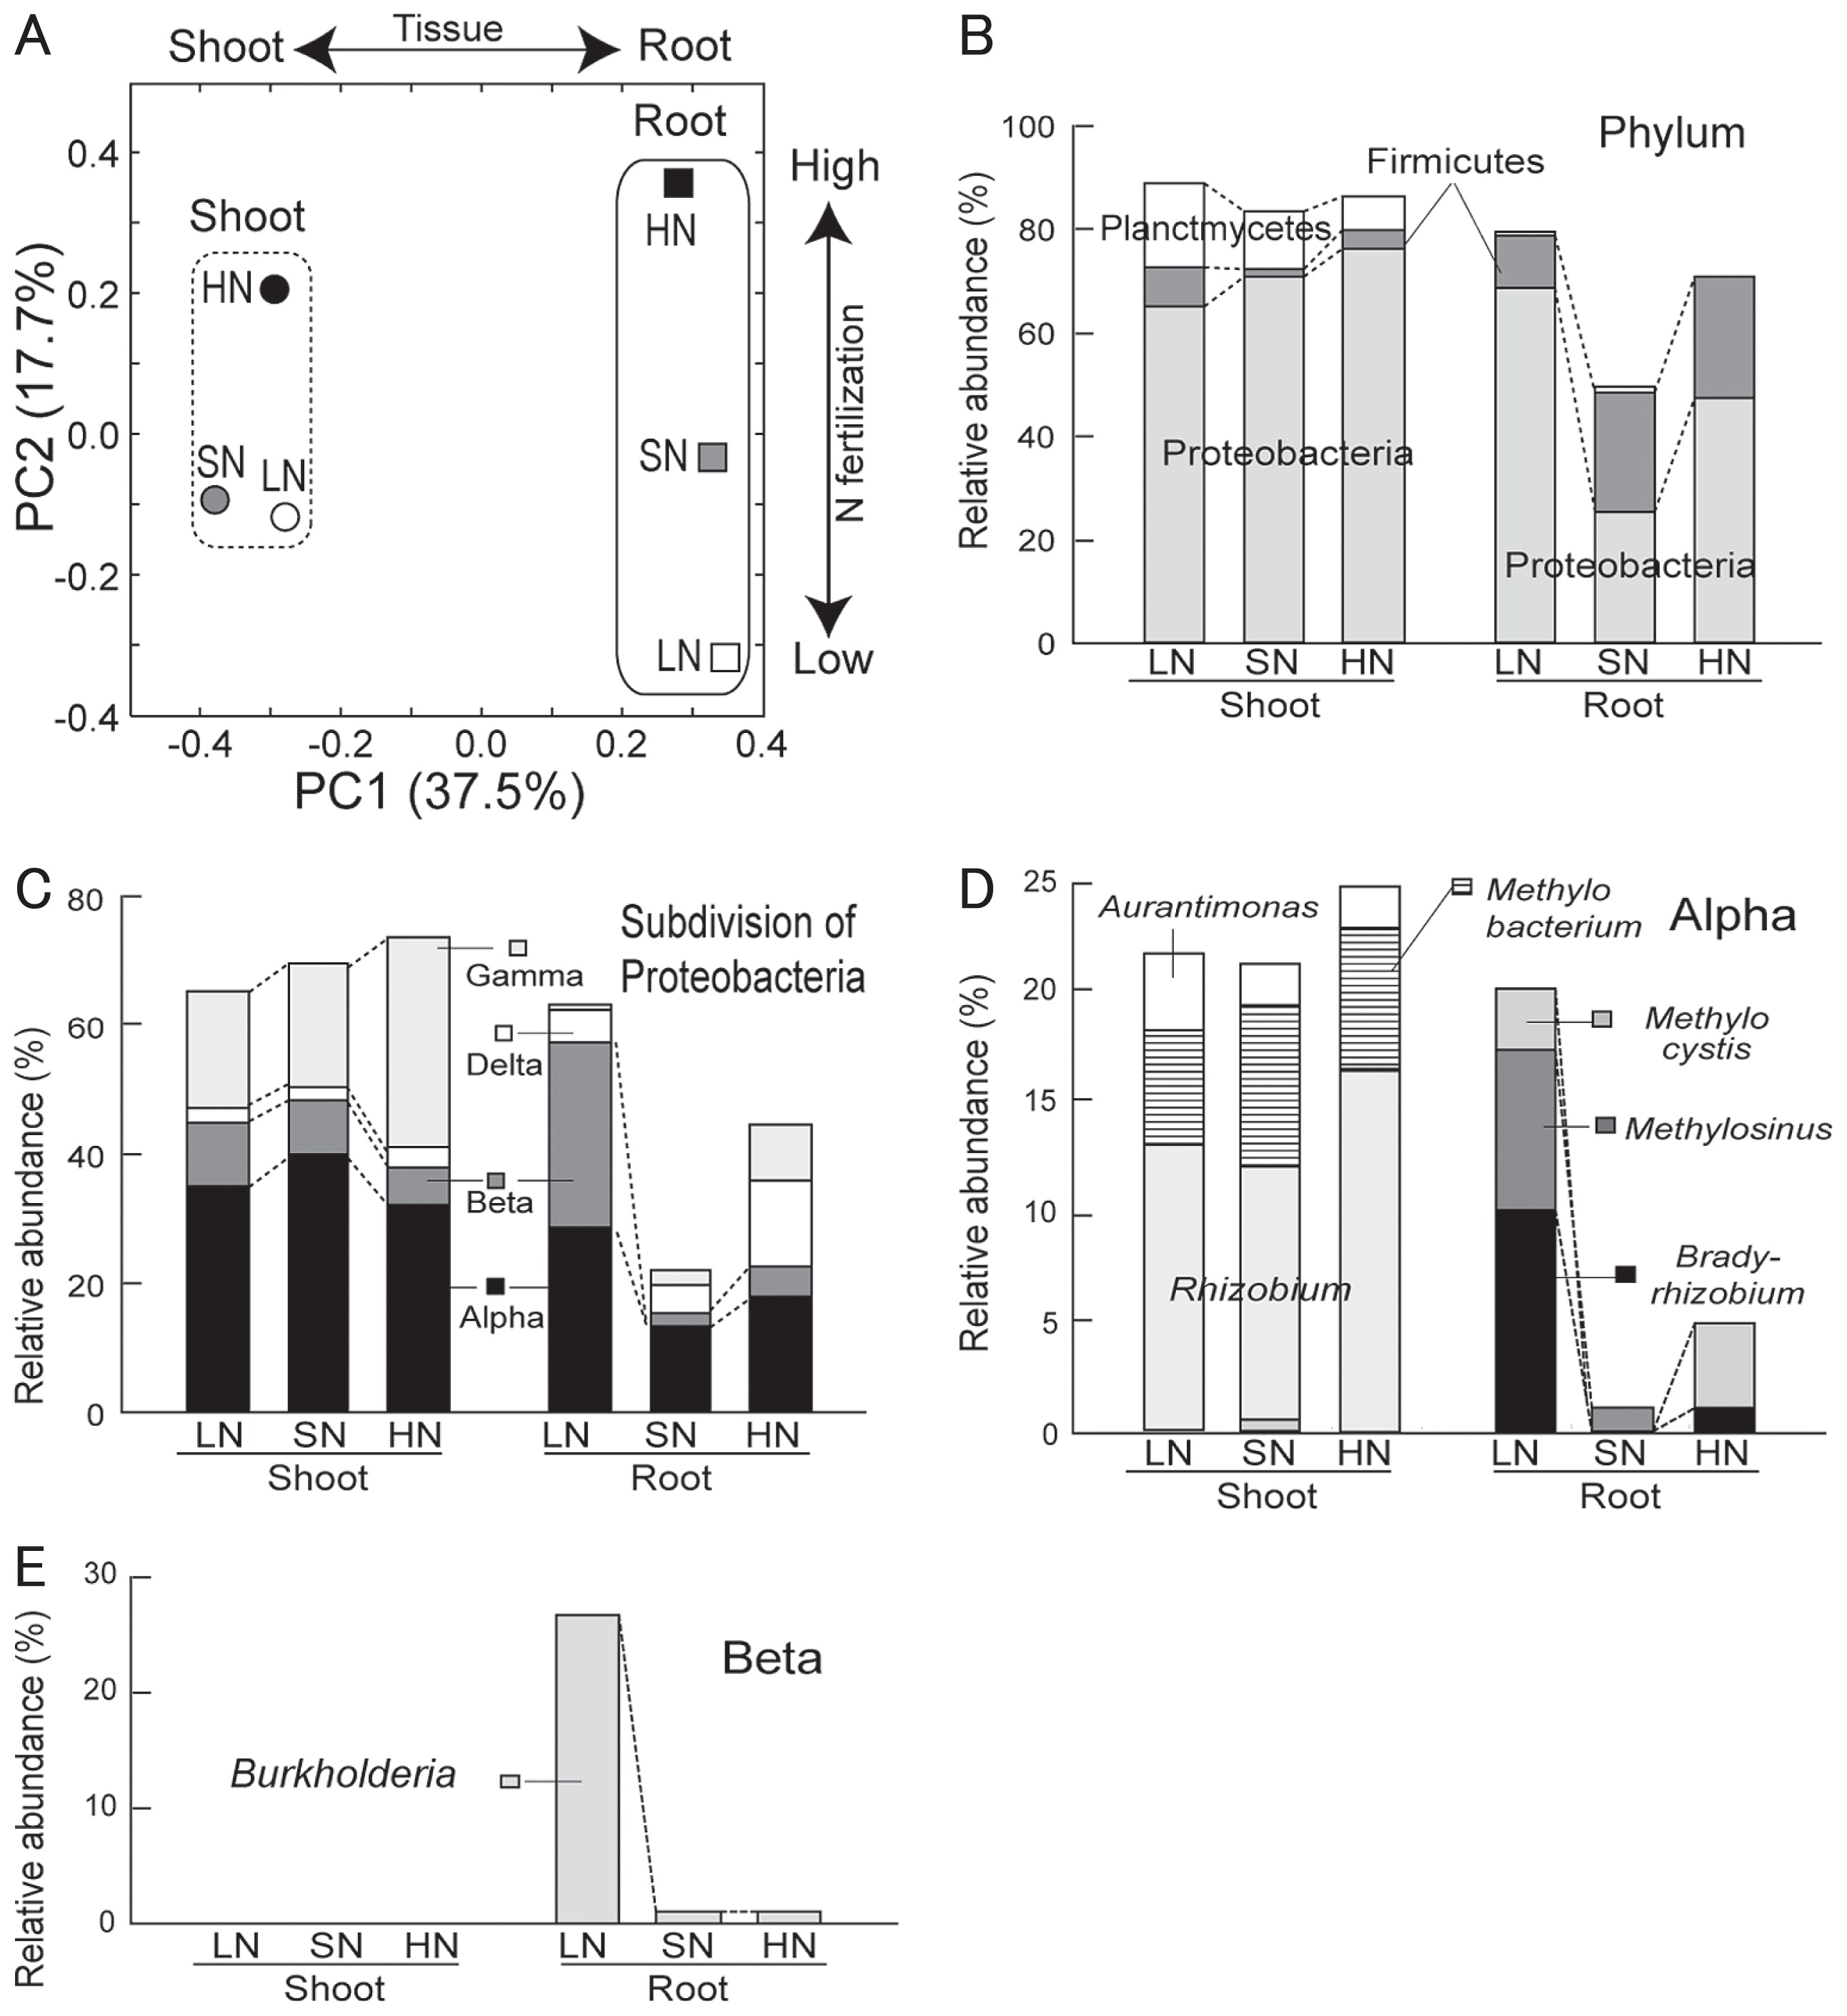
The assessment of phylogenetic composition using RDP Classifier revealed that Proteobacteria were the dominant taxa across all libraries at phylum level (Fig. 2B). In the root microbiomes, the second major phylum was Firmicutes, whereas in the shoot microbiomes, it was Planctomycetes (Fig. 2B). In Proteobacteria, Alpha- and Gammaproteobacteria were stably dominant in the shoots, whereas the abundance of Alpha-, Beta- and Delta-proteobacteria in the roots responded to N levels (Fig. 2C). In particular, Betaproteobacteria were markedly abundant in the LN root microbiomes (Fig. 2C). At genus level, the relative abundances of Bradyrhizobium and Methylosinus (Fig. 2D) and Burkholderia (Fig. 2E) were increased exclusively in the LN root microbiome. In the shoot microbiomes, Rhizobium, Methylobacterium and Aurantimonas were major genera, but their abundance did not respond to the N fertilizer level (Fig. 2D).
Clustering analysis (Fig. 3A) allowed the identification of OTUs responsible for the community shifts in LN fertilization at species level. The results showed that OTUs BP2 (Burkholderia sp.), AP31 (Methylosinus sp.), and AP36 (Bradyrhizobium sp.) were especially abundant in the LN roots (Fig. 3A). When phylogenetic trees were constructed using clone sequences belonging to each OTU, all clones of OTU BP2 were grouped into a tight and distinct cluster including Burkholderia kururiensis KP23T (50) (Fig. 3B). Most of the clones in OTU AP36 fell into two major clusters that were phylogenetically close to photosynthetic stem-nodulating Bradyrhizobium sp. ORS278 (12) and Bradyrhizobium elkanii USDA76T (42) (Fig. 3C). Half of the clones in OTU AP31 were grouped into a cluster including Methylosinus sporium (Fig. S2).
Phylogeny of metagenome sequences
Clone library analysis based on the Sanger method provided a high quality of sequences to elucidate phylogenetic relationships among rice root microbiomes (Figs. 2 and 3). However, it was not subjected to rigorous statistical analysis because relatively low numbers of the sequences (Table 1) were analyzed individually using combined DNA preparations from triplicate DNA samples. To statistically evaluate the phylogenetic compositions and functional aspects of the root microbiomes, metagenomic analyses were conducted by a pyrosequencer for the LN and SN root microbiomes with three replications (Table S1). A BLASTX search against the GenBank NR database assigned the resultant metagenome data of 369,021 reads from the LN roots to superkingdoms as 66.7% Bacteria, 0.9% Archaea, and 0.6% Eukaryota; and of 474,538 reads of the SN roots as 49.3% Bacteria, 3.4% Archaea, and 0.5% Eukaryota based on the total number of reads (Table S1).
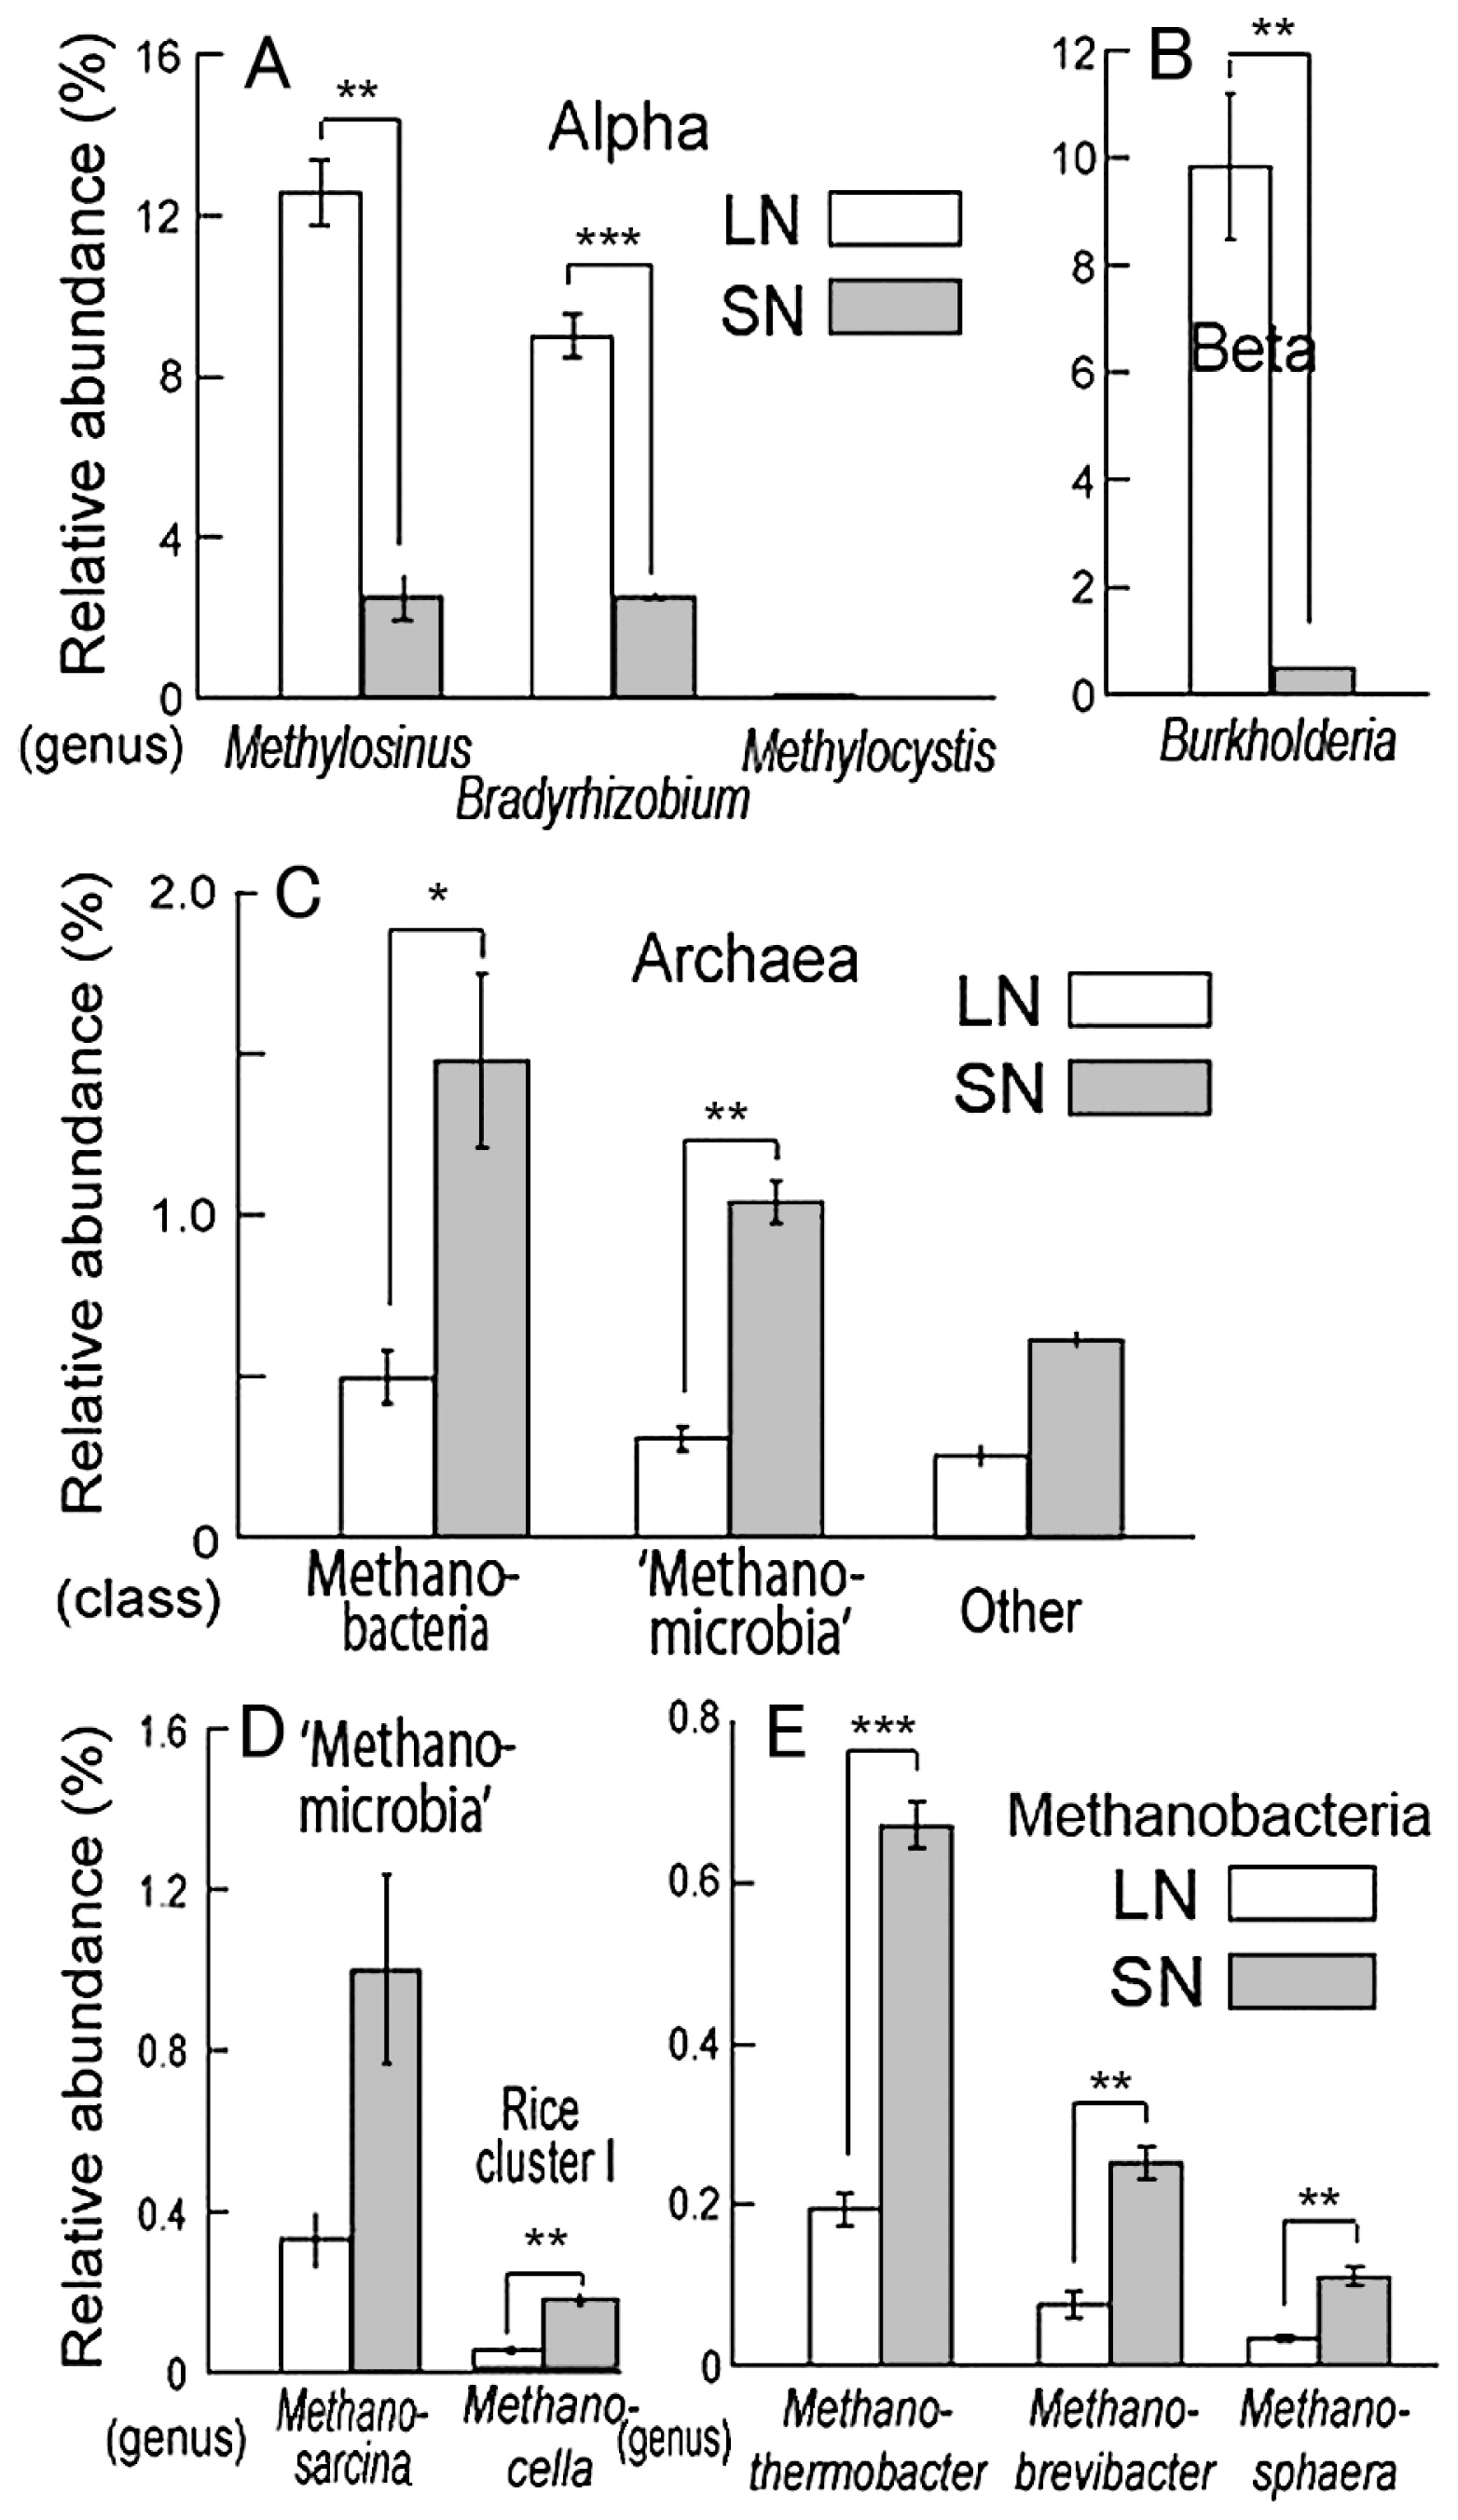
The phylogenetic compositions of bacteria from the metagenome data (Fig. 4) clearly confirmed the results of the comparative analyses of the 16S rRNA gene clone libraries for Bacteria domain (Fig. 2BCDE). In particular, the relative abundances of Methylosinus, Bradyrhizobium and Burkholderia were again significantly greater in LN roots than in SN roots (Fig. 4AB), consistent with the results of clone library analyses. In the Archaea domain, dominant taxa at the class level were Euryarchaeota, including ‘Methanomicrobia’ and Methanobacteria, the relative abundances of which were significantly lower in LN roots than in SN roots (Fig. 4CDE). Methanosarcina and Methanocella, which consist of a ubiquitous key methanogen group in rice paddy fields (40, 41), also showed reduced abundance in LN roots (Fig. 4D).
Frequency of functional genes relevant to methane cycle
The frequency of functional genes was analyzed (35) (Table 2, Table S2). The abundances of the pmo and mmo genes, which encode particulate methane monooxygenase (pMMO) and soluble cytoplasmic methane monooxygenase (sMMO), were significantly greater in LN roots than in SN roots (Table 2). In contrast, mcr genes, which encode methyl-coenzyme M reductase, are functional genes of methanogenic archaea, were significantly less abundant in LN roots than in SN roots. When we determined the gene copy ratio of pmoA/mcrA by quantitative PCR of the DNA preparations, the pmoA/mcrA ratio of LN roots (1.66 ± 1.16; n = 3) was significantly higher than that of SN roots (0.32 ± 0.34, n = 6).
Table 2
Frequency of functional genes retrieved from metagenomic data of the bacterial community of rice roots grown under low (LN) and standard (SN) N fertilization
a
| Category |
Subcategory or function |
Gene |
Frequency (10−5) |
Ratio LN/SN |
P t-test |
|
| LN |
SN |
| N2 fixation |
|
|
|
|
|
|
|
Nitrogenase reductase |
nifH |
13.4 |
9.0 |
1.5 |
0.111 |
| Methane cycle |
|
|
|
|
|
|
|
Particulate methane monooxygenase |
pmo |
28.8 |
7.0 |
4.1 |
0.003 |
|
Soluble methane monooxygenase |
mmo |
27.5 |
5.9 |
4.7 |
0.000 |
|
Methyl-coenzyme M reductase |
mcr |
3.8 |
10.8 |
0.4 |
0.020 |
| Plant hormone related |
|
|
|
|
|
|
|
ACC deaminase |
acdS |
6.1 |
1.3 |
4.7 |
0.011 |
|
Tryptophan-2-monooxygenase |
iaaM |
5.4 |
0.1 |
44.5 |
0.075 |
|
Indoleacetamide hydrolase |
iaaH |
8.5 |
1.9 |
4.5 |
0.009 |
|
Indole-3-pyruvate decarboxylase |
ipdC |
0.1 |
0.3 |
0.4 |
0.219 |
| N metabolism |
|
|
|
|
|
|
|
Urease |
ure |
6.0 |
1.8 |
3.3 |
0.016 |
|
Urea carboxylase |
|
5.4 |
1.6 |
3.4 |
0.049 |
|
Urea transporter |
|
27.3 |
8.7 |
3.1 |
0.001 |
|
Nitrate transporter |
|
13.9 |
4.1 |
3.4 |
0.000 |
| S metabolism |
|
|
|
|
|
|
|
Sulfur oxidation |
sox |
11.3 |
4.4 |
2.6 |
0.008 |
|
Alkensulfonate transporter |
|
34.3 |
15.1 |
2.3 |
0.000 |
|
Desulfurization enzyme |
ssu |
23.7 |
10.7 |
2.2 |
0.000 |
| Fe metabolism |
|
|
|
|
|
|
|
Pyoverdin biosynthesis |
pvd |
62.6 |
27.8 |
2.3 |
0.001 |
|
Ferrichrome transport |
|
56.6 |
23.0 |
2.5 |
0.002 |
| Aromatics metabolism |
|
|
|
|
|
|
|
Benzoate (aerobic path) |
|
21.6 |
10.8 |
2.0 |
0.002 |
|
Benzoate (anaerobic path) |
|
13.4 |
5.8 |
2.3 |
0.013 |
|
Salicylate and salicylate ester |
|
2.1 |
0.3 |
7.6 |
0.010 |
|
Phenylpropanoid |
|
23.3 |
8.0 |
2.9 |
0.021 |
a Gray shading shows values for which a significant difference exists between the LN and SN roots. Frequency shows the ratios of gene numbers in each functional category (Table S2) to total number of reads for three biological replications with different MID barcodes (Table S1).
P indicates probability value of
t-test between the LN and SN root microbiomes for each functional category. See the explanations of Subcategory or function in Supplementary Materials and Methods.
To estimate the methane-oxidizing activity of methanotrphs inhabiting the root systems, the rice root systems were exposed to 10% (v/v) 13C-labeled methane (99.9 atom%). Although the 13C assimilated by methanotrophs in the root systems was markedly diluted with large amounts of unlabeled C in the rice roots, small but significant increases in 13C concentrations were observed by 13C-labeled methane exposure (Table 3). Base on total carbon content, dry weight of rice roots and the difference in 13C concentrations, the rate of 13C-methane assimilation was calculated (Table 3). As a result, the rate of incorporation of 13C-labeled methane gas into LN roots (81 nmol h−1 g−1 [dry weight]) was significantly higher than that into SN roots (42 nmol h−1 g−1 [dry weight]) (Table 3).
Table 3
Incorporation of
13C from labeled methane gas into rice root systems under low (LN) and standard (SN) N fertilization
*
| Rice field |
Gas phase |
13C concentration |
CH4 assimilation by methanotrophs |
|
|
| (‰) |
(atom%) |
(atom% excess) |
(μmol plant−1) |
(nmol h−1 g−1 dry root weight) |
| LN |
None |
−28.2 ± 0.0 |
1.075 ± 0.000 |
— |
— |
— |
| LN |
13CH4 |
−21.7 ± 1.4 |
1.082 ± 0.002 |
0.0071 ± 0.0015‡ |
11.2 ± 1.9† |
81 ± 22† |
| SN |
None |
−28.1 ± 0.1 |
1.075 ± 0.000 |
— |
— |
— |
| SN |
13CH4 |
−24.5 ± 1.7 |
1.079 ± 0.002 |
0.0039 ± 0.0019 |
5.6 ± 1.7 |
42 ± 14 |
* Rice roots were sampled from the LN and SN paddy fields at the booting stage, and then washed well with tap water. The root systems were exposed to 10% (v/v)
13C-labeled methane at 25°C for 26 h. The incorporation of
13C from
13C-labeled methane gas into the rice root systems was determined in triplicate from
13C concentration, C content, and dry weight. Values are the means ± standard deviation of triplicate determinations. Asterisks indicate significant differences between LN and SN roots by
t test (
†P <0.05,
‡P <0.01)
Differences in the abundance of other functional genes were also assessed (35). Gene abundance relevant to N, S, Fe, aromatics, and plant hormone metabolism was significantly higher in LN roots than in SN roots. The nominated functions were regarded as urea and nitrate utilization for N metabolism, sulfur oxidation and utilization of organic sulfur compounds for S metabolism, biosynthesis and transport of pyoverdine siderophore and ferrichrome iron receptor for Fe metabolism, utilization of benzoate, salicylate and phenylpropanoid for aromatics metabolism, and acdS and iaaH genes for plant hormone metabolism (Table 2). Based on BLAST X top hits, the organisms carrying nifH were different between LN and SN roots (Table S2). The nifH fragments were homologous to those of Methylosinus and Bradyrhizobium in LN roots, both of which have been observed with high abundance in the analyses of 16S rRNA genes (Fig. 2D) and metagenome phylogeny (Fig. 4A). On the other hand, SN roots harbored nifH fragments homologous to those of methanogenic archaea, Deltaproteobacteria and Clostridia, all of which are anaerobic N2-fixing organisms (Table S2).
Bacterial communities in paddy field soils
To examine whether the difference in bacterial communities between LN and SN microbiomes extends to paddy soil, deep sequencing of bacterial 16S rRNA genes was conducted for bulk soil DNA (LN and SN soils) with a pyrosequencer (Fig. S1, Table S3). PCoA by Fast UniFrac (13) demonstrated that soil and root samples were differentiated along PC1 (74.2%), while the communities of root-associated bacteria shifted from SN roots to LN roots along PC2 (19.3%) (Fig. 5). In contrast to root samples, soil samples formed a tight cluster (Fig. 5), indicating that soil microbial communities were less affected by the level of N fertilization as a whole. However, when the community structures of soil bacteria were examined in detail, three orders in Proteobacteria (Rhizobiales, Rhodospirillales and Burkholderiales) were shown to be significantly more abundant in LN soil than in SN soil (Fig. S3).
Discussion
The present study revealed that N fertilizer management has a profound impact on the bacterial community of a rice paddy ecosystem. A relatively short period (5 years) without N fertilization caused a marked change in the composition of phylogenetic and functional diversities of the rice root microbiome (Figs. 2, 4). Withholding N fertilization also changed soil chemical properties, especially organic substance content and cation exchange capacity (CEC) (Table S5), although in contrast with the root microbiome, the soil bacterial communities remained relatively stable (Fig. 5), although the analysis of soil bacterial communities (Fig. S1, Table S3) suggests that the cessation of N input slightly changed the abundance of certain groups of Proteobacteria in the rice paddy field soil. The interactions between organic substances and cations (based on CEC) in soils influence nutrient availability (N, P, S) and root architecture (46). These data therefore suggest that no N input changed the root microbiome and soil properties via the plant–soil interface towards an ecosystem that was more likely to be sustainable, as discussed in the subsequent paragraphs.
Recently, Sessitsch et al. (43) reported metagenomic analysis of a bacterial endophyte community from surface-sterilized rice roots, showing many genes with endophytic lifestyles, such as plant polymer–degrading enzymes and detoxification of reactive oxygen species. However, our data showed more geochemical and nutritional aspects, because the bacterial cells included epiphytes and endophytes in rice roots under low N fertilization.
Intensive analyses of microbial communities in disease-suppressive soils have led to the identification of key microbes for disease suppression and their community functions (34). Thus, it is crucial to survey key microbes that support ecosystem functions by community analyses. Clone library analysis indicated that the root-associated bacterial community in the LN field harbored lower diversity than other communities examined (Table 1). Our analyses (Figs. 2DE, 4AB) demonstrated that Burkholderia, Bradyrhizobium, and Methylosinus became much more abundant in the LN root microbiome, indicating that they are potential key players in the low N soil environment. Phylogenetic analyses revealed that these dominant populations of Burkholderia and Bradyrhizobium are closely related to B. kururiensis KP23T and the photosynthetic Bradyrhizobium sp. ORS287, respectively (Fig. 3BC).
Burkholderia kururiensis KP23T was originally isolated from an aquifer polluted with trichloroethylene (50). Later, Mattos et al. (32) reported the ability of B. kururiensis to endophytically colonize rice plants and to promote both plant growth and rice grain yield in pot experiments. B. kururiensis KP23T displays N2-fixing activity, IAA biosynthesis (32), and ACC deaminase activity (39). Interestingly, the roots of upland rice (tropical japonica) likely accommodated a bacterial species close to B. kururiensis (14). The nifH, iaaMH and acdS genes that are phylogenetically close to those of Burkholderia were also found in analyses of the root microbiome in the LN field (Tables 2, S2). Photosynthetic Bradyrhizobium has been reported as a natural endophyte of wild rice plants (6). Inoculation with Bradyrhizobium sp. ORS278 increased shoot growth and the grain yield of rice, indicating its potential ability to enhance rice production (6). We also found nifH, iaaMH and acdS genes that are phylogenetically close to those of Bradyrhizobium sp. ORS278 and BTAi1 in the root microbiome of the LN field (Tables 2, S2). The phylogenetic trees of nifH and acdS genes are generally congruent with the 16S rRNA gene tree (3, 49). Therefore, it is conceivable that the Burkholderia and Bradyrhizobium species that carry nifH, iaaMH and acdS were dominant in the rice roots of the LN field, suggesting that these microbes could support plant growth in nutrient-poor environments by performing their N2-fixing activity, IAA biosynthesis, and ACC deaminase activity.
In general, the methane cycle occurs in rice paddy field ecosystems: methanogens produce methane from root exudates or other organic materials in anoxic bulk soil, and the methane diffuses to the rice roots, where active methane oxidation occurs by methanotrophs (5). A recent study suggested that the rice root-associated microbiome sustains both methanogenesis and methanotrophs (4, 24). Here, the abundance of methanogens was significantly reduced in the LN root microbiome rather than the SN microbiome (Fig. 4CD). Interestingly, these methanogens are known to be preferentially associated with roots (27), suggesting that plant–methanogen interaction is considerably affected by fertilization management.
In LN roots, the frequencies of pmo and mmo genes were significantly increased (Table 2) in parallel with an increase in the abundance of methanotroph in LN roots (Methylosinus in Figs. 2D, 4A). Type II methanotrophs (Methylocystis and Methylosinus) are considered to be indicative species of survival under adverse conditions (5, 24). In contrast, the frequency of mcr genes tended to decrease in LN roots (Table 2), consistent with the reduced abundance of methanogenic archaea in LN roots (Fig. 4CDE). The ratio of pmoA/mcrA and the 13C-labeled methane incorporation rate increased significantly in LN roots compared with SN roots. Therefore, our results suggest that methane oxidizers were relatively abundant in LN roots than in SN roots compared to methanogens in terms of gene copy number. As for activity (Table 3), the root microbiome would have higher methane-oxidizing activity in the LN field than in the SN field, because methane- oxidizing bacteria generally use CH4 as their sole carbon source (38).
There is ongoing debate about the possible effects of N fertilizer application on methane emissions from rice fields. Nitrogen fertilizer often reduced methane emissions from experimental microcosms (5) and fields (48), which likely depends on the dose and type of nitrogen fertilizers by meta-analysis (1). Because the net impact of nitrogen fertilizers on methane emissions was affected by many abiotic and biotic factors of rice paddy ecosystems including bulk soils, rhizosphere soils and rice plants, it is crucial to understand the underlying mechanisms (4). Our results suggest that low N fertilization management could change the rice root microbiomes relevant to methane cycles, methanogenesis and methanotrophs.
The functional genes for the metabolism of N, S, Fe, and aromatics were more abundant in LN roots than in SN roots (Table 2). Searches of the gene functions led us to speculate that no input of N fertilizer may affect not only the methane cycle, but also other biogeochemical processes of a wide variety of substances that facilitate adaptation to low-nutrient environments. For example, the bacteria associated with rice roots in the absence of N fertilizer can utilize urea-related compounds and nitrate as N sources (46). Such a microbial community can also efficiently utilize organic S (23, 45) and pyoverdine siderophores (8) as S and Fe sources, respectively. Low N-input management substantially reduced rice growth (Figs. 1, S1): presumably, then, root exudates were less available under LN than under SN. Thus, root microbiomes under the condition of low N input may be capable of catabolizing recalcitrant substances in the soil, such as aromatic compounds, as C, N and S sources to alleviate nutrient deficiencies. Abundant genes for Fe acquisition and transport (Table 2) may also accelerate competitive colonization by typical symbiotic bacteria like Pseudomonas putida KT2440 (36) of roots under poor nutrient conditions.
The LN root microbiome harbored more abundant functional marker genes for sulfur oxidation (sox) (31) and methane oxidation (pmoA and mmoX) than the SN root microbiome (Table 2), suggesting a more oxidative environment in the LN field than in the SN field. In contrast, from the nifH phylogeny, anaerobic microbes (methanogenic archaea, Anaeromyxobacter, and Clostridium) were found exclusively in the SN root microbiome (Tables 2, S2). These findings suggest that the microbial community of the rice rhizosphere had adapted to a more aerobic environment during a relatively short period (5 years) with no input of N fertilizer management.
Low N fertilization management often changes soil chemistry, including the enhancement of soil organic carbon (37). The no-N-fertilizer treatment here represents an extreme form of field management for the purposes of basic research because of rice biomass reduction in the LN field. However, the results here show that no-N-fertilizer treatment enhanced the abundance of specific microbes OTUs BP2 (Burkholderia sp.), AP31 (Methylosinus sp.) and AP36 (Bradyrhizobium sp.), and functional genes for the metabolism of N, S, Fe and aromatics. In addition, active methane oxidation likely occurred in the rice roots of the LN field. For further validation of these organisms and geochemical processes as biological makers, it would be fascinating to isolate and characterize the presumptive key players, such as Burkholderia, Methylosinus and Bradyrhizobium, and to seek a way to technologically regulate them toward more beneficial geochemical/nutritional processes and plant associations in agricultural settings.
Acknowledgements
This work was supported by the Ministry of Agriculture, Forestry and Fisheries of Japan (PMI-0002); BRAIN; two Grants-in-Aid for Scientific Research, (A) 23248052 and (C) 22580074, from the Ministry of Education, Science, Sports and Culture of Japan; and the Japanese Government Scheme for the Development of Mitigation and Adaptation Techniques to Global Warming in the Sectors of Agriculture, Forestry, and Fisheries. The Technical Support Center of Tohoku University provided the instrument (454 GS FLX Titanium).
References
- 1. Banger, K, H Tian, and C Lu. 2012. Do nitrogen fertilizers stimulate or inhibit methane emissions from rice fields? Global Change Biol. 18:3257-3267.
- 2. Barraquio, WL, MLG Daroy, AC Tirol, JK Ladha, and I Watanabe. 1986. Laboratory acetylene reduction assay for relative measurement of N2-fixing activities associated with field-grown wetland rice plants. Plant Soil. 90:357-372.
- 3. Blaha, D, C Prigent-Combaret, S Mirza, and Y Moenne-Loccoz. 2006. Phylogeny of the 1-aminocyclopropane-1-carbxylic acid deaminase-encoding gene acdS in phytobeneficial and pathogenic Proteobacteria and relation with strain biogeography. FEMS Microbiol Ecol. 56:455-470.
- 4. Bodelier, PEL. 2011. Interactions between nitrogenous fertilizers and methane cycling in wetland and upland soils. Curr Opin Environ Sustain. 3:379-388.
- 5. Bodelier, PLE, P Roslev, T Henckel, and P Frenzel. 2000. Stimulation by ammonium-based fertilizer of methane oxidation in soil around rice roots. Nature. 403:421-424.
- 6. Chaintreuil, C, E Giraud, Y Prin, J Lorquin, A Ba, M Gillis, P de Lajudie, and B Dreyfus. 2000. Photosynthetic bradyrhizobia are natural endophytes of the African wild rice Oryza breviligulata. Appl Environ Microbiol. 66:5437-5447.
- 7. Conrad, R. 2007. Microbial ecology of methanogens and methanotrophs. Adv Agron. 96:1-63.
- 8. Cornells, P. 2011. Iron uptake and metabolism in pseudomonads. Appl Microbiol Biotechnol. 86:1637-1645.
- 9. Costello, AM, and ME Lidstrom. 1999. Molecular characterization of functional and phylogenetic genes from natural populations of methanotrophs in lake sediments. Appl Environ Microbiol. 65:5066-5074.
- 10. Dianou, D, C Ueno, T Ogiso, M Kimura, and S Asakawa. 2012. Diversity of cultivable methane-oxidizing bacteria in microsites of rice paddy field: Investigation by cultivation method and fluorescence in site hybridization (FISH). Microbes Environ. 27:278-287.
- 11. Galloway, JN, AR Townsend, JW Erisman, M Bekunda, Z Cai, JR Freney, LA Martinelli, SP Seitzinger, and MA Sutton. 2008. Transformation of the nitrogen cycle: Recent trends, questions, and potential solution. Science. 320:889-892.
- 12. Giraud, E, L Moulin, D Vallenet, et al. 2007. Legume symbioses: Absence of Nod genes in photosynthetic bradyrhizobia. Science. 316:1307-1312.
- 13. Hamady, M, C Lozupone, and R Knight. 2009. Fast UniFrac: facilitating high-throughput phylogenetic analyses of microbial communities including analysis of pyrosequencing and PhyloChip data. ISME J. 4:17-27.
- 14. Hardoim, PR, FD Andreote, B Reinhold-Hurek, A Sessitish, LS van Overbeek, and JD van Elsas. 2011. Rice root-associated bacteria: insights into community structures across 10 cultivars. FEMS Microbiol Ecol. 77:154-164.
- 15. Holmes, AJ, A Costello, ME Lindstrom, and JC Murrell. 1995. Evidence that particulate methane monooxygenase and ammonia monooxygenase may be evolutionarily related. FEMS Microbiol Lett. 132:203-208.
- 16. Ikeda, S, M Anda, S Inaba, et al. 2011. Autoregulation of nodulation interferes with impact of nitrogen fertilization levels on the leaf-associated bacterial community in soybeans. Appl Environ Microbiol. 77:1973-1980.
- 17. Ikeda, S, KN Watanabe, K Minamisawa, and N Ytow. 2004. Evaluation of soil DNAs from arable lands in Japan with a modified direct extraction method. Microbes Environ. 19:301-309.
- 18. Ikeda, S, T Kaneko, T Okubo, et al. 2009. Development of a bacterial cell enrichment method and its application to the community analysis in soybean stems. Microbiol Ecol. 58:703-714.
- 19. Ikeda, S, T Okubo, M Anda, et al. 2010. Community- and genome-based views of plant-associated bacteria: Plant-bacterial interactions in soybean and rice. Plant Cell Physiol. 51:1398-1410.
- 20. Ikeda, S, T Okubo, T Kaneko, et al. 2010. Community shifts of soybean-associated bacteria responding to different nodulation phenotypes and N levels. ISME J. 4:315-326.
- 21. Ishii, S, S Ikeda, K Minamisawa, and K Senoo. 2011. Nitrogen cycling in rice paddy environments: Past achievements and future challenges. Microbes Environ. 26:282-292.
- 22. Ju, XT, GX Xing, XP Chen, et al. 2009. Reducing environmental risk by improving N management in intensive Chinese agricultural systems. Proc Natl Acad Sci USA. 106:3041-3046.
- 23. Kertesz, MA, E Fellows, and A Schmalenberger. 2007. Rhizobacteria and plant sulfur supply. p.239-259. In Advances in Applied Microbiology. vol. 62. Elsevier, San Francisco.
- 24. Knief, C, N Delmotte, S Chaffron, M Stark, G Innerebner, R Wassmann, C von Mering, and JA Vorholt. 2011. Meta-proteogenomic analysis of microbial communities in the phyllosphere and rhizosphere of rice. IMSE J. 6:1378-1390.
- 25. Kogel-Knabner, I, W Amelung, Z Cao, S Fiedler, P Franzel, R Jahn, K Kalbitz, A Kolbl, and M Schloter. 2010. Biogeochemistry of paddy soils. Geoderma. 157:1-14.
- 26. Kolb, S, C Knief, S Stubner, and R Conrad. 2003. Quantitative detection of methanotrophs in soil by novel pmoA-targeted real-time PCR assays. Appl Environ Microbiol. 69:2423-2429.
- 27. Lehmann-Richter, S, R Grosskopf, W Liesack, P Frenzel, and R Conrad. 1999. Methanogenic archaea and CO2-dependent methanogenesis on washed rice roots. Environ Microbiol. 1:159-166.
- 28. Liesack, W, S Schnell, and NP Revsbech. 2000. Microbiology of flooded rice paddies. FEMS Microbiol Rev. 24:625-645.
- 29. Lozupone, CA, and R Knight. 2007. Global patterns in bacterial diversity. Proc Natl Acad Sci USA. 103:11436-11440.
- 30. Luton, PE, JM Wayane, RJ Sharp, and PA Riley. 2002. The mcrA gene as an alternative to 16S rRNA in the phylogenetic analysis of methanogen populations in landfill. Microbiology. 148:3521-3530.
- 31. Masuda, S, S Eda, S Ikeda, H Mitsui, and K Minamisawa. 2010. Thiosulfate-dependent chemolithoautotrophic growth of Bradyrhizobium japonicum. Appl Environ Microbiol. 76:2402-2409.
- 32. Mattos, KA, VLM Padue, A Romeiro, et al. 2008. Endophytic colonization of rice (Oryza sativa L.) by the diazotrophic bacterium Burkholderia kururiensis and its ability to enhance plant growth. An Acad Bras Cienc. 80:477-493.
- 33. Mayumi, D, T Yoshimoto, H Uchiyama, N Nomura, and T Nakajima-Kambe. 2010. Seasonal change in methanotrophic diversity and populations in a rice field soil assessed by DNA-stable isotope probing and quantitative real-time PCR. Microbes Environ. 25:156-163.
- 34. Mendes, R, M Kruijt, I de Bruijn, et al. 2011. Deciphering the rhizosphere microbiome for disease-suppressive bacteria. Science. 332:1097-1100.
- 35. Meyer, F, D Parrmann, and M D’Souza. 2008. The metagenomics RAST server—a public resource for the automatic phylogenetic and functional analysis of metagenomes. BMC Bioinformatics. 9:386.
- 36. Molina, MA, P Godoy, MI Ramos-Gonzales, N Munoz, JL Ramos, and M Espinosa-Urgel. 2005. Role of iron and the TonB system in colonization of core seeds and roots by Pseudomonas putida KT2440. Environ Microbiol. 7:443-449.
- 37. Mulvaney, RL, SA Khan, and TR Ellsworth. 2009. Synthetic nitrogen fertilizers deplete soil nitrogen: A global dilemma for sustainable cereal production. J Environ Qual. 38:2295-2314.
- 38. Murrell, JC, and SM Jetten. 2009. The microbial methane cycle. Environ Microbiol Rep. 1:279-284.
- 39. Onofre-Lemus, J, I Hernandes-Lucas, L Girard, and J Caballero-Mellado. 2009. ACC (1-aminocyclopropane-1carboxylate) deaminase activity, a widespread trait in Burkholderia species, and its growth-promoting effect on tomato plants. Appl Environ Microbiol. 75:6581-6590.
- 40. Sakai, S, H Imachi, S Hanada, A Ohashi, H Harada, and Y Kamagata. 2008. Methanocella paludicola gen. nov., sp. nov., a methane-producing archaeon, the first isolate of the lineage ‘Rice Cluster I’, and proposal of the new archaeal order Methanocellales ord. nov. Int J Syst Evol Microbiol. 58:929-936.
- 41. Sakai, S, H Imachi, Y Sekiguchi, A Ohashi, H Harada, and Y Kamagata. 2007. Isolation of key methanogens for global methane emission from rice paddy fields: a novel isolate affiliated with the clone cluster rice cluster I. Appl Environ Microbiol. 73:4326-4331.
- 42. Sawada, H, LD Kuykendall, and JM Young. 2003. Changing concepts in the systematics of bacterial nitrogen-fixing legume symbionts. J Gen Appl Microbiol. 49:155-179.
- 43. Sessitsch, A, P Hardoim, J Döring, et al. 2012. Functional characteristics of an endophyte community colonizing rice roots as revealed by metagenome analysis. Mol. Plant-Microbe Interact. 25:28-36.
- 44. Shrestha, M, PM Shrestha, P Frenzel, and R Conrad. 2010. Effect of nitrogen fertilization on methane oxidation, abundance, community structure, and gene expression of methanotrophs in the rice rhizosphere. ISME J. 4:1545-1556.
- 45. Sugawara, M, GR Shah, MJ Sadowsky, O Paliy, J Speck, AW Vail, and P Gyaneshwar. 2011. Expression and functional roles of Bradryrhizobium japonicum genes involved in the utilization of inorganic and organic sulfur compounds in free-living and symbiotic conditions. Mol. Plant-Microbe Interact. 24:451-457.
- 46. Trevisan, S, O Francioso, S Quaggiotti, and S Nardi. 2010. Humic substances biological activity at the plant–soil interface. Plant Signal Behav. 5:635-643.
- 47. Watanabe, T, G Wang, K Taki, Y Ohashi, M Kimura, and S Asakawa. 2010. Vertical changes in bacterial and archaeal communities with soil depth in Japanese paddy fields. Soil Sci Plant Nutr. 56:705-715.
- 48. Xie, B, X Zheng, Z Zhou, et al. 2010. Effects of nitrogen fertilizer on CH4 emission from rice fields: multi-site field observation. Plant Soil. 326:393-401.
- 49. Zehr, JP, BD Jenkins, SM Short, and GF Steward. 2003. Nitrogenase gene diversity and microbial community structure: a cross-system comparison. Environ Microbiol. 5:539-554.
- 50. Zhang, H, S Hanada, T Shigamatsu, K Shibuya, Y Kamagata, T Kanagawa, and R Kurane. 2000. Burkholderia kururiensis sp. nov., a tricholoroethylene (TCE)-degrading bacterium isolated from an aquifer polluted with TCE. Int J Syst Evol Microbiol. 50:743-749.