Original Article
Galectin-3 regulates chemotherapy sensitivity in epithelial ovarian carcinoma via regulating mitochondrial function
2019 Volume 44 Issue 1 Pages 47-56
Details
2019 Volume 44 Issue 1 Pages 47-56
Galectin-3 (Gal-3) is a multifunctional carbohydrate-binding protein associated with cell migration, cell proliferation, cell adhesion, and cell-cell interaction in tumor cells. It has been implied to be involved in the tumor progression and chemoresistance of epithelial ovarian cancer (EOC). However, it is unclear whether the Gal-3-mediated regulation on the EOC chemosensitivity is associated with hypoxia or mitochondrial dysfunction. In the present study, we examined the regulation by Gal-3 overexpression on cisplatin-sensitivity or cisplatin-resistance in EOC cells in vitro. We manipulated Gal-3 via plasmid transfection and RNA interference in the cisplatin-resistant EOC cells, and re-evaluated the sensitivity of the cisplatin-resistant EOC cells to cisplatin, with CCK-8 assay, colony forming assay, apoptosis analysis and mitochondrial function examination. Results demonstrated that galectin-3 overexpression downregulated the cisplatin sensitivity in EOC OVCAR-3 cell clone, resulting in an upregulated growth and a reduced apoptosis in the cisplatin-treated OVCAR-3 cells. On the other hand, the Gal-3 knockdown with Gal-3-specific siRNA transfection aggravated cisplatin-induced apoptosis in OVCAR-3 cells. In conclusion, Galectin-3 reduces the sensitivity of ovarian cancer cells to cisplatin via regulating cisplatin-induced mitochondrial dysfunction. Galectin-3 knockdown inhibits the chemo-resistance of EOC cells. It implies that Galectin-3 might be a potential target to overcome the chemo-resistance in EOC cells.
Epithelial ovarian cancer (EOC) is the most lethal gynecological cancer (Barber et al., 2017). EOC patients only have as low as 30% of 5-year survival rate, attributed to chemo-resistance and metastatic spread (Ferlay et al., 2013; Xiao et al., 2017). Therefore, it is urgent to identify the EOC chemo-resistance mechanism to improve the outcomes of EOC patients (Vaughan et al., 2011). Up to now, a variety of mechanisms were implied or speculated underlining such resistance, including, but not limited to the resistance acquisition of pre-existing sensitive tumor cells, the survival of quiescent drug-tolerant cells and the existence of intrinsic resistant cells (Agarwal and Kaye, 2003; Brown et al., 2014). However, the molecular pathways were not clear behind the inherent or acquired chemo-resistance.
Hypoxia promotes the development and progression of tumors. Inadequate vasculature does not match the tumor outgrowth, resulting in hypoxia, which renders a more aggressive phenotype with increased proliferation, invasiveness, and metastases (Le et al., 2004). Accumulating studies have shown that hypoxia independently predicts poor prognosis of cancer patients (Dayan et al., 2008). Moreover, hypoxia has been indicated to be associated with chemo-resistance in cancers (Muz et al., 2015; Yasuda, 2008). Tumor-hypoxia leads to advanced vascularization, alters cancer cell metabolism and contributes to therapy resistance (Muz et al., 2015), via stimulating complex cell signaling networks, including hypoxia-induced factor, phosphoinositide 3-kinase (PI3K), mitogen-activated protein kinase (MAPK), and nuclear factor kappa-B (NF-κB) pathways (Muz et al., 2015). Cyclic hypoxia is responsible for the regulation of chemo-resistant cancer stem cells (Yasuda, 2008).
Galectins, a group of β-galactoside-binding lectins, are characterized by the conserved carbohydrate-recognition domains (CRDs) sequences (Nabi et al., 2015). Galectin-3 plays an important role in a wide range of physiological processes (Di Lella et al., 2011; Hughes, 2001) and in many pathological processes (Liu and Rabinovich, 2005). Galectins contribute to tumor invasion and metastasis via perturbing cell-cell or cell-basement membrane adhesion of tumor cells (Hood and Cheresh, 2002; Liu and Rabinovich, 2005). Overexpressed galectin-1 independently predicts poor prognosis of EOC patients, positively associating with activation of nuclear factor kappa-light-chain-enhancer of activated B cells (NF-κB) / p65 (Chen et al., 2017). Galectin-3 induces ovarian cancer cell survival and chemoresistance via toll-like receptor 4 TLR4 signaling activation (Cai et al., 2016). Up to now, it has not been clear whether galectin involves in the hypoxia-driven chemo-resistance in EOC.
The current study was to investigate the regulation by galectin-3 on the sensitivity of ovarian cancer OVCAR-3 cells to cisplatin, and then to examine whether the galectin-3-mediated regulation was associated with mitochondrial dysfunction, which is mainly induced by hypoxia (Bristow et al., 2011), in the cisplatin-treated OVCAR-3 cells. Our study implies that galectin-3 might be a potential target to sensitize chemo-sensitivity of ovarian cancer.
Human epithelial ovarian cancer (EOC) OVCAR-3 cell line was purchased from the American Type Culture Collection (ATCC, Rockville, MD, USA), and was cultured in Dulbecco’s Modified Eagle’s Medium (DMEM) (Gibco, Rockville, MD, USA), which was supplemented with 10% fetal bovine serum (FBS) (Hyclone, Pittsburgh, PA, USA) and with 1% streptomycin/penicillin (Sigma-Aldrich, St. Louis, MO, USA) in an incubator with 5% CO2 under 37°C. For the cisplatin treatment, cisplatin was added into the 2% FBS-contained medium of approximately 85%-confluent OVCAR-3 cells to a final concentration of 0, 3, 10 or 30 μM for 0, 1, 2 (48 hr), 4 or 8 days. To overexpress galectin-3, homo sapiens galectin-3 coding sequence (ACCESSION. AB006780) was cloned into pcDNA3.1(+) vector (Invitrogen, Carlsbad, CA, USA), with the coding sequence of chloramphenicol acetyltransferase (CAT) as control. Then recombinant Galectin-3-pcDNA3.1(+) or CAT-pcDNA3.1(+) was transfected utilizing Lipofectamine 2000 (Invitrogen) into 85%-confluent OVCAR-3 cells. To knockdown galectin-3 in OVCAR-3 cells, galectin-3-specific siRNA (with scramble RNA as internal control) was transfected via Lipofectamine RNAiMax (Invitrogen).
mRNA isolation and real-time quantitative PCR (RT-qPCR)EOC OVCAR-3 cells were collected for mRNA isolation with Magnetic mRNA Isolation Kit (New England Biolabs, Ipswich, MA, USA). Each mRNA sample was supplemented with RNasin® Plus RNase Inhibitor (Promega, Madison, WI, USA) and was stored at -80°C before use. Galectin-3 mRNA was quantified with Takara One Step RT-PCT kit (RR064A, Takara, Tokyo, Japan) and was presented as a relative level to glyceraldehyde-3-phosphate dehydrogenase (GAPDH), using the ∆∆Ct method (Livak and Schmittgen, 2001). All primers and probes were synthesized by Sangon Bio (Sangon, Shanghai, China). The primer and probe sequences were designed according to Galectin-3 mRNA sequence (NM_002306.3) as follows: Primer F: 5’- accctcaaggatggcctggc-3’, Primer R: 5’- agcccctgggtagccccctg-3’, Probe: 5’-FAM-tgggggaaccagcctgctggg-TAMRA-3’.
Protein preparation and western blottingMitochondria/Cytosol Fractionation Kit (BioVision, Milpitas, CA, USA) was utilized to isolate the mitochondrial and cytosolic protein sections in EOC OVCAR-3 cells under the guidance of the kit’s manual. Protein samples were centrifuged with 12,000 x g for 15 min to remove cell debris, and then were supplemented with Protease Inhibitor Cocktail (Abcam, Cambridge, UK) (ab65621) and were stored at -80°C before use. To perform western blotting, samples were separated with sodium dodecyl sulfate-polyacrylamide gel electrophoresis (SDS-PAGE) and then were transferred to a polyvinylidene fluoridehydrophobic membrane (Millipore, Bedford, MA, USA). Rabbit polyclone anti-human galectin-3, cytochrome c, caspase 3 and caspase 9 antibodies (1:1000 respectively, Abcam) were utilized to incubate the membrane at 4°C overnight, with the antibody against GAPDH (1:1000 respectively, Abcam) as internal control. Goat anti-rabbit IgG conjugated horseradish peroxidase (1:2000, Bio-Rad Laboratories, Hercules, CA, USA) and the enhanced chemiluminescence (ECL) (Thermo Scientific, Rockford, IL, USA) were utilized to visualize the specific antigen-antibody binding.
Growth curving with CCK-8 assay and colony forming assayThe cell growth was curved with CCK-8 assay. Briefely, “Galectin-3 Up” and “Up control” OVCAR-3 cells were treated with or without 10 μM cisplatin for 0, 1, 2, 3 or 4 days, and then were incubated with 10 μL CCK-8 (DOJINDO, Kumamoto, Japan) for 2 hr at 37°C, 5% CO2. The 450 nm absorbance of each group of cells was monitored post each incubation. Colony forming assay was performed as follows. 250 OVCAR-3, “Galectin-3 Up” or “Up control” OVCAR-3 cells were incubated in 12-well plates at 37°C, 5% CO2 for 24 hr, and then were added with 0, 3, 10 or 30 μM cisplatin for 4 days. Then cell colonies were stained with crystal violet (0.008%) for 15 min and were observed.
TUNEL assay for apoptosis85%-confluent “Galectin-3 Up” or “Up control” OVACAR-3 cells, on glass slides, post treatment, were washed twice with 500 μL ice-cold phosphate buffer saline (PBS). Cell apoptosis was evaluated by staining for fragmented DNA with terminal deoxynucleotidyl transferase dUTP nick end labeling (TUNEL) Apoptosis Detection Kit (Promega). Cells were firstly fixed with 4% methanol-free formaldehyde (in PBS) for 25 min at 4°C. and then were permeabilized via immersing the slides in 0.2% Triton® X-100 solution in PBS for 5 min. Secondly, cells were covered with 90 µL Equilibration Buffer at room temperature for 5 min, and then were added with 10 µL Nucleotide Mix on ice and 1 µL sufficient rTdT incubation buffer for another incubation at 37°C for 45 min in darkness. Thirdly, TUNEL staining was immediately analyzed under Confocal laser microscopy (Olympus, Tokyo, Japan) (Ex/Em=470/520 nm) and was presented as TUNEL positivity, compared to DAPI positivity (at 460 nm).
Measurement of cellular ROS, superoxide and MMPMitochondrial reactive oxygen species (ROS) release into cytosol was stained with DCFDA / H2DCFDA - Cellular Reactive Oxygen Species Detection Assay Kit (ab113851, Abcam) under the guidance of the kit’s manual. DCFH-DA (2’,7’-Dichlorodihydro-fluorescein diacetate) was oxidized by cytosolic ROS into DCF (2,7-dichlorofluo-rescein), which was measured with a luminescence spectrometer (Ex / Em=488 / 530 nm). In brief, “Galectin-3 Up” or “Up control” OVACAR-3 cells, post treatment, were washed once in 500 μL PBS, and then were treated with 200 μL PBS, adding 25 µM DCFDA for an incubation of 45 min at 37°C. Signal was read at Ex/Em: 485/535 nm. The mitochondrial superoxide was highly selectively stained with MitoSOXTM Red (Invitrogen Molecular Probes, Carlsbad, CA, USA). 500 μL of 5 μM MitoSOX™ reagent working solution was utilized to cover “Galectin-3 Up” or “Up control” OVACAR-3 cells, post treatment for an incubation of 10 min at 37°C in darkness. The indicator was observed at an excitation/emission maxima of approximately 510/580 nm. Mitochondrion membrane potential was examined with Mitochondrion Membrane Potential Kit (Sigma-Aldrich) according to the kit’s manual. “Galectin-3 Up” or “Up control” OVACAR-3 cells in 94-well plate, post treatment, were washed twice with 100 μL PBS. Then cells were added with 100 μL /well of the Dye Loading Solution and were incubated in a 5% CO2, 37°C incubator for 20 min. The TMRE fluorescence was observed with a luminescence spectrometer (Ex / Em=549 / 575 nm).
Statistical AnalysisStatistical analysis was performed using SPSS Statistics 24 software (IBM SPSS, Armonk, NY, USA). Student t test and ANOVA test were performed to analyze the difference in the galectin-3 mRNA and protein levels, in the growth curve, in the colony forming, in the apoptosis, in the apoptosis-related proteins, in the mitochondrial dysfunction, between or among groups of OVCAR-3 cells. p < 0.05 or less was considered statistically significant.
To investigate the regulation by galectin-3 on the chemo-sensitivity of ovarian cancer cells, we overexpressed galectin-3 in OVCAR-3 cells and examined the influence by the galectin-3 overexpression on the growth of cisplatin-treated OVCAR-3 cells. Fig. 1A demonstrats that the galectin-3 mRNA level was markedly high in the OVCAR-3 cells, from 1 to 8 days post the transfection with 2 μM Galectin-3-pcDNA3.1(+) plasmid (Galectin-3 Up), with CAT-pcDNA3.1 as control (p < 0.0001 respectively). The galectin-3 overexpression was also confirmed in protein level via western blotting at 1, 2, 4 or 8 days post transfection (p < 0.001 respectively, Fig. 1B). Then, we performed CCK-8 assay to curve the growth of galectin-3-overexpressed or blank OVCAR-3 cells, with or without cisplatin treatment. As indicated in Fig. 1C, there was no significant difference in growth between blank and galectin-3-overexpressed OVCAR-3 cells. However, the galectin-3 overexpression markedly inhibited the cisplatin-caused (10 μM) growth reduction in OVCAR-3 cells (p < 0.001 respectively at 2 and 4 day post treatment).
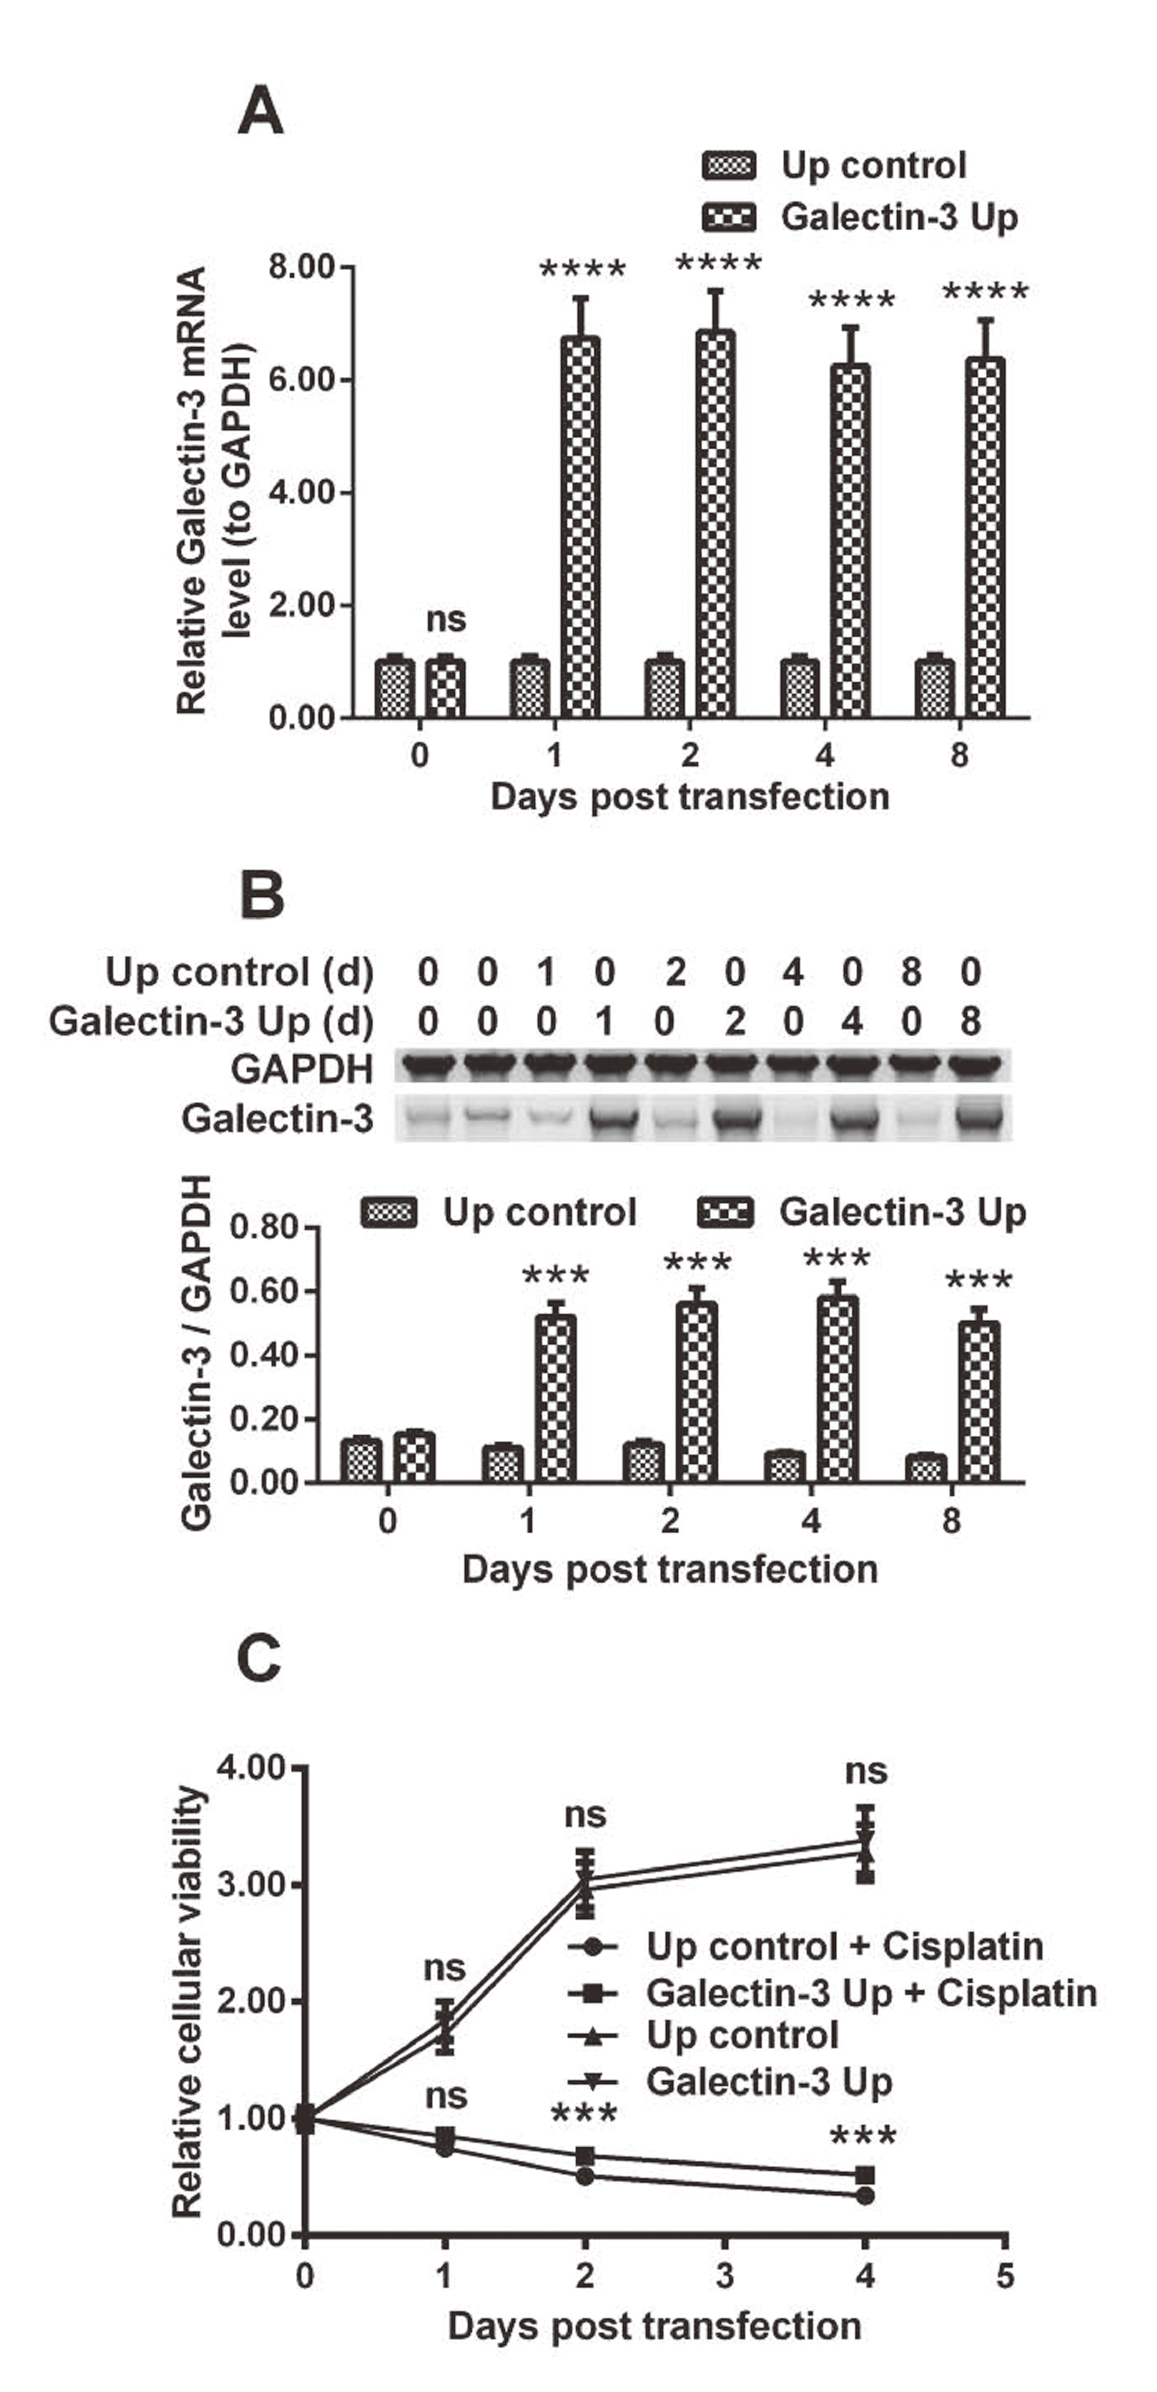
Influence by galectin-3 overexpression on cisplatin-induced growth inhibition in ovarian cancer OVCAR-3 cells. A and B: Relative mRNA (A) and protein (B, by western blotting assay) levels of galectin-3 (to glyceraldehyde-3-phosphate dehydrogenase, GAPDH) in the ovarian cancer OVACAR-3 cells, post the transfection with Galectin-3-pcDNA3.1(+) (Galectin-3 Up) or chloramphenicol acetyltransferase (CAT)-pcDNA3.1 (Up control) for 0, 1, 2, 4 or 8 days; C: Growth curve of the “Galectin-3 Up” or “Up control” OVACAR-3 cells, with or without cisplatin treatment (10 μM) for 0, 1, 2, 3 or 4 days. Results were averaged for triple independent experiments. ***p < 0.001, ****p < 0.0001, ns: no significance.
To confirm the inhibition by galectin-3 on the sensitivity of OVCAR-3 cells to cisplatin, we also performed colony forming assay of OVCAR-3 cells, with or without galectin-3 overexpression, in the presence of cisplatin. It was demonstrated that galectin-3 overexpression exerted no influence on the colony forming of OVCAR-3 cells, without cisplatin treatment (Fig. 2A and 2B). Figure 2C indicates a significant reduction of colonies in the group of cisplatin treatment with 10 or 30 μM, in contrast to the group of OVCAR-3 cells, without cisplatin treatment (p < 0.01 or less, Fig. 2D), with a dose-dependence (p < 0.01, Fig. 2D). However, galectin-3 overexpression markedly ameliorated the cisplatin-caused colony reduction of OVCAR-3 cells (p < 0.05 for 10 μM cisplatin, p < 0.01 for 30 μM cisplatin, Fig. 2E and 2F). Taken together, these results confirmed that galectin-3 blocks the cisplatin-mediated growth reduction of ovarian cancer OVCAR-3 cells.

Influence by galectin-3 overexpression on colony forming of cisplatin-treated OVCAR-3 cells. A and B: Colony forming (A) by the “Galectin-3 Up” or “Up control” OVACAR-3 cells (post incubation for 4 days), colonies were counted and presented (B) as a colony number per field; C and D: Colony forming (C) by the OVACAR-3 cells, post the treatment with 0, 3, 10 or 30 μM cisplatin for 4 days, colonies were counted and presented (D) as a colony number per field; E and F: Colony forming (E) by the “Galectin-3 Up” or “Up control” OVACAR-3 cells, post the treatment with 10 or 30 μM cisplatin for 4 days, colonies were counted and presented (F) as a colony number per field. Results were averaged for triple independent experiments. *p < 0.05, **p < 0.01, ns: no significance.
Cisplatin-induced apoptosis has been well recognized as one of the main anti-cancer effects in ovarian cancer cells (Ali et al., 2012). A dull apoptosis induction is also a major chemoresistance mechanism in response to cisplatin treatment in ovarian cancer (Ali et al., 2012; Coukos and Rubin, 1998; Kigawa et al., 2001). We then examined cisplatin-induced apoptosis in the OVCAR-3 cells, with or without galectin-3 manipulation. TUNEL staining for fragmented DNA in apoptosis demonstrated that there was no significant difference in TUNEL-positivity between “Galectin-3 Up” and “Up control” groups (Fig. 3A and 3B). Though cisplatin treatment promoted a significantly high level of apoptosis (p < 0.0001, Fig. 3A and 3B), such promotion was inhibited by galectin-3 promotion (p < 0.01). On the other hand, the knockdown by the transfection with 20 nM siRNA-Galectin-3 significantly aggravated the cisplatin-induced apoptosis in OVCAR-3 cells (p < 0.05, Fig. 3C and 3D).

TUNEL staining for apoptosis in the “Galectin-3 Up” or “Up control” OVCAR-3 cells, post cisplatin treatment. A and B: Apoptosis was stained by terminal deoxynucleotidyl transferase dUTP nick end labeling (TUNEL) (A) in the “Galectin-3 Up” or “Up control” OVACAR-3 cells, post the treatment with 0 or 10 μM cisplatin for 48 hr, apoptotic cells were counted (B) as the percentage of TUNEL-positive to total cells; C and D: Apoptosis was stained by TUNEL (C) in the cisplatin-treated (10 μM) OVACAR-3 cells, post the transfection with 20 nM siRNA-Galectin-3 or siRNA CTR (control) for 48 hr, apoptotic cells were counted (D) as the percentage of TUNEL-positive to total cells. Each experiment was independently repeated in triplicate. * p < 0.05, ** p < 0.01 or *** p < 0.001, ns: no significance. Bars of 10 μm were indicated in each figure.
We also performed western blotting for apoptosis-related proteins in the above-mentioned groups of OVCAR-3 cells. Figure 4A indicates that cisplatin treatment promoted the cytochrome c release from mitochondria to cytosol, upregulated the cleavage of caspase 3 and caspase 9 (p < 0.001 or p < 0.0001, Fig. 4B). The cytochrome release and the cleavage of caspase 3 and 9 were also regulated by galectin-3. The cytosol level of cytochrome c, the cleaved caspase3 and caspase 9 were significantly downregulated in the “Galectin-3 Up” OVCAR-3 cells, whereas upregulated in the siRNA-Galectin-3-transfected OVCAR-3 cells, compared to the “Up control” and siRNA CTR-transfected cells, respectively (p < 0.01 or p < 0.001, Fig. 4B). Therefore, galectin-3 inhibits cisplatin-induced apoptosis in ovarian cancer OVCAR-3 cells.
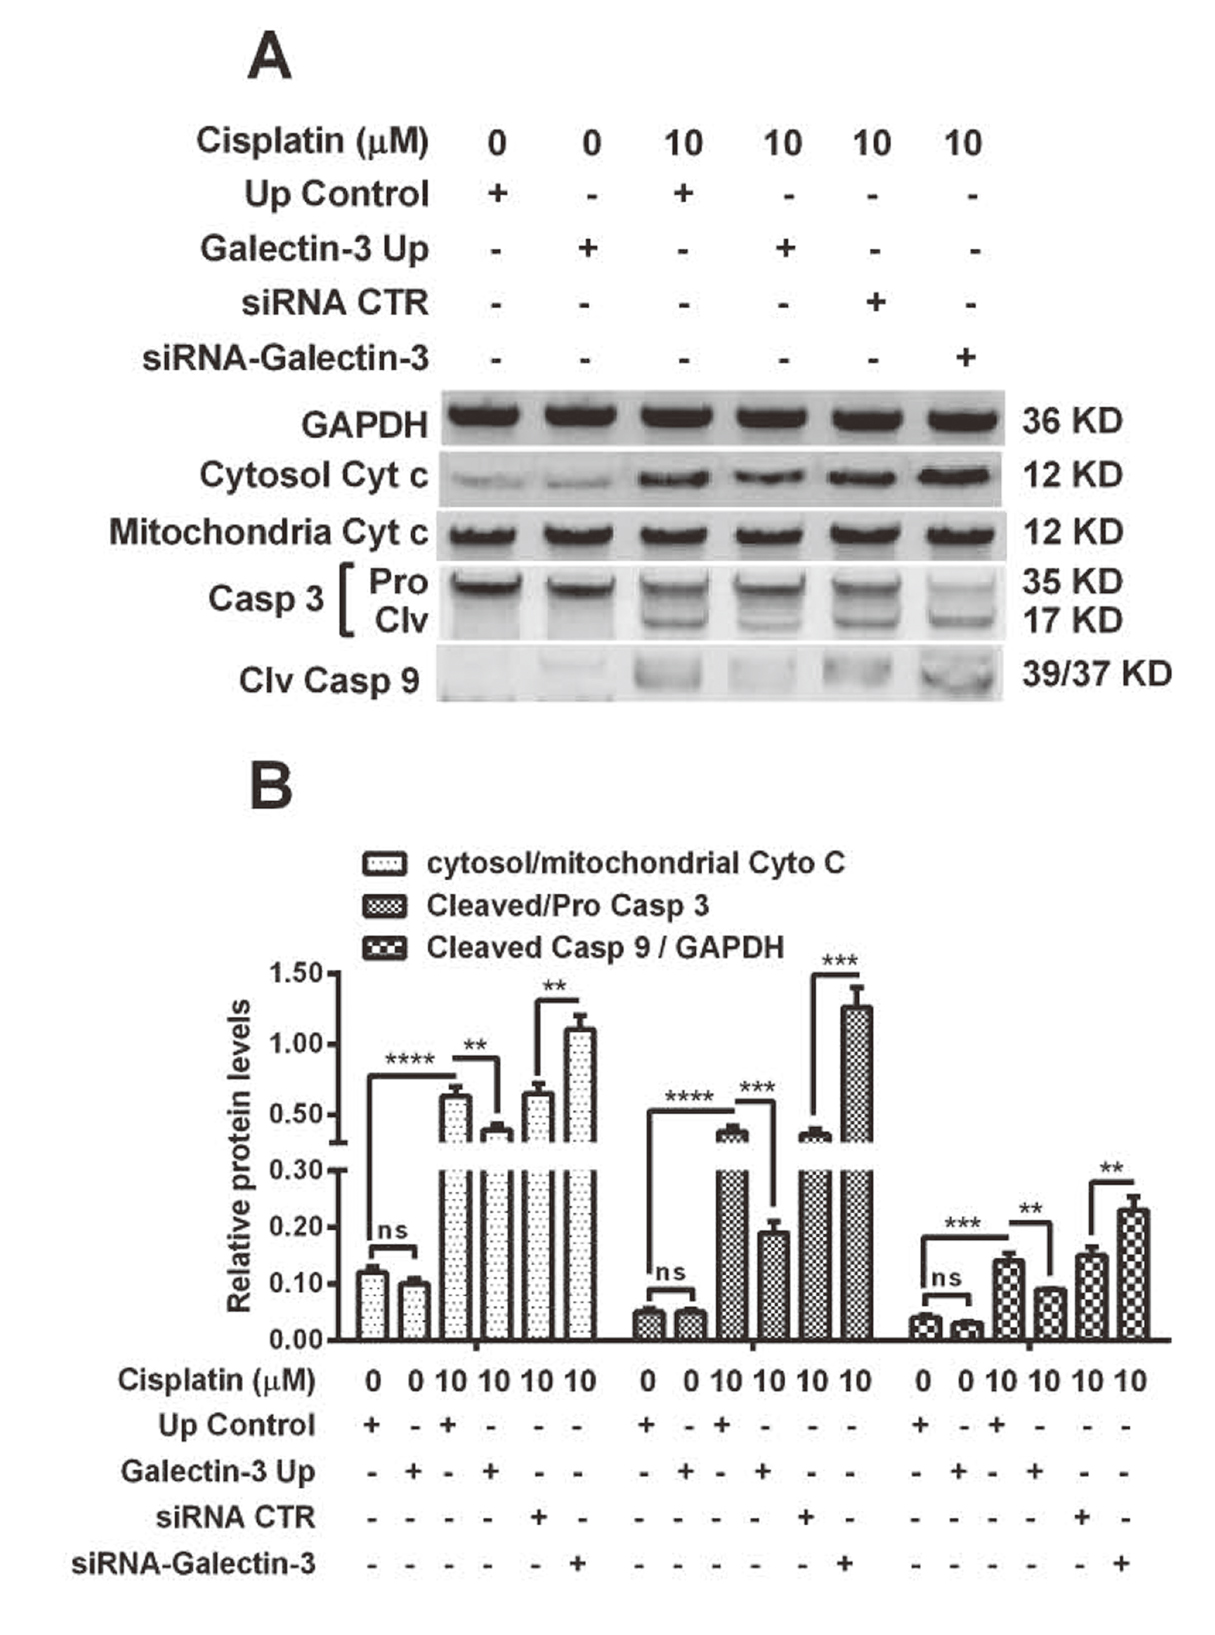
Western blot analysis of apoptosis-associated proteins in the “Galectin-3 Up” or “Up control” OVACAR-3 cells, post cisplatin treatment. A: Western blot analysis of cytochrome c in mitochondria (Mitochondria Cyt c) or in cytosol (Cytosol Cyt c), Pro- or cleaved-caspase 3 (Pro or Clv Casp 3) and cleaved caspase 9 (Clv Casp 9) (with GAPDH as internal control) in the “Galectin-3 Up” or “Up control” OVACAR-3 cells, with or without cisplatin treatment (10 μM) for 48 hr; B: Relative Cytosol/mitochondria Cyt c, Cleaved/ Pro Casp 3 and Cleaved Casp9/GAPDH in the above-mentioned groups of OVACAR-3 cells. Results were averaged for triple independent experiments. **p < 0.01, ***p < 0.001 or ****p < 0.0001, ns: no significance.
Due to the significant regulation by galectin-3 on mitochondrial cytochrome c release, we speculated that galectin-3 might regulate the cisplatin-mediated damage to mitochondria in ovarian cancer OVCAR-3 cells. To evaluate the release of mitochondrial ROS, we examined the conversion by ROS of DCFH-DA to DCF in the cytosol in cisplatin-treated OVCAR-3 cells, with or without galectin-3 overexpression or knockdown. Figure 5A demonstrated a baseline amount of DCF level in blank OVCAR-3 cells, without cisplatin treatment (First column, Fig. 5A). Though the treatment with 10 μM cisplatin for 48 hr promoted a significant level of DCF in OVCAR-3 cells (p < 0.0001, First column, Fig. 5A and 5B), such promotion was markedly inhibited in the “Galectin-3 Up” OVCAR-3 cells, in which, galectin-3 was overexpressed (p < 0.01, Third column). On the other hand, the galectin-3 knockdown aggravated the cisplatin-induced conversion of DCFH-DA to DCF (p < 0.01, Five vs Fourth column). In addition, we also examined the regulation by galectin-3 on the mitochondrial superoxide and mitochondrial membrane potential (MMP) in the cisplatin-treated OVCAR-3 cells. The promotion to mitochondrial superoxide, the downregulation on MMP were also found in the cisplatin-treated OVCAR-3 cells (p < 0.001 respectively, Fig. 5C and 5D). The significant regulation by galectin-3 was also found on the cisplatin-mediated mitochondrial superoxide promotion and MMP downregulation (p < 0.01 or p < 0.001for “Galectin-3 Up” vs “Up control”, p < 0.01 respectively for “siRNA-galectin-3” vs “siRNA CTR”, Fig. 5C and 5D). Taken together, these results confirmed the inhibition by galectin-3 on the cisplatin-induced mitochondrial dysfunction in OVCAR-3 cells.
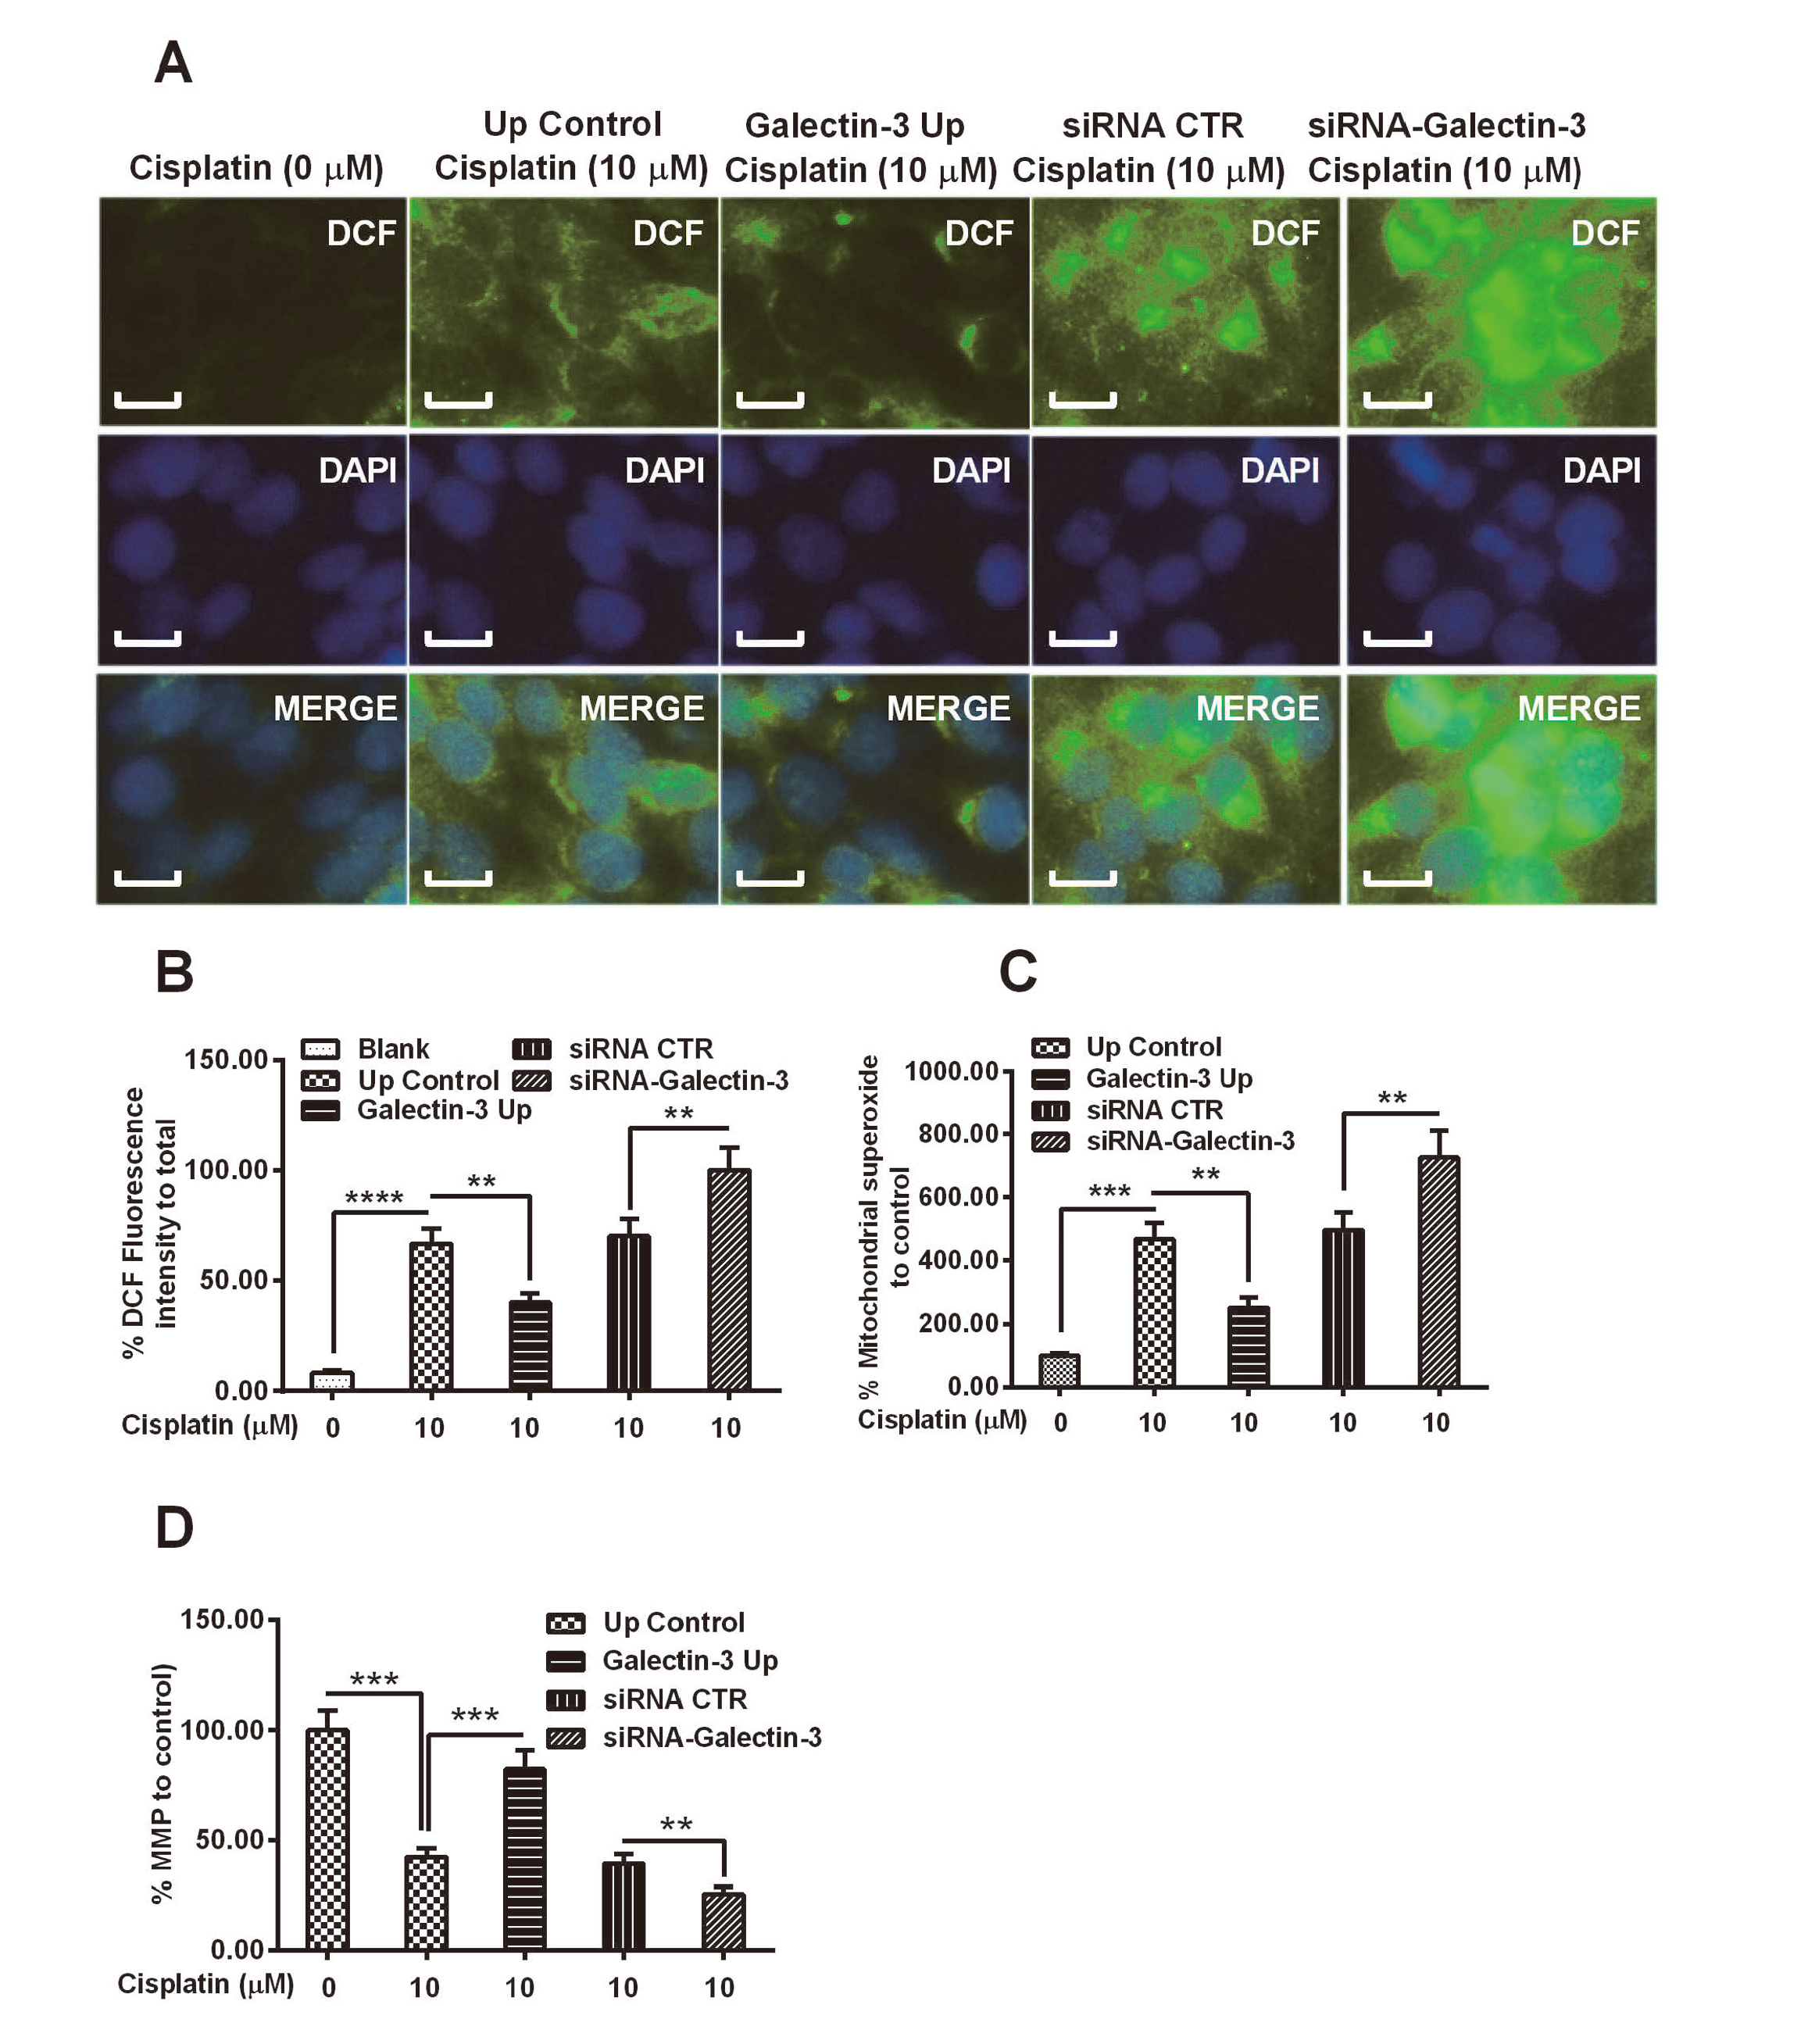
Mitochondrial dysfunction in the “Galectin-3 Up” or “Up control” OVCAR-3 cells, post cisplatin treatment. A and B: Mitochondrial reactive oxygen species (ROS), which was indicated by the conversion of 2’,7’-Dichlorodihydro-fluorescein diacetate (DCFH-DA) to 2,7-dichlorofluo-rescein (DCF) in the blank galectin-3-knocked down OVCAR-3, “Galectin-3 Up” or “Up control” OVCAR-3 cells, with or without the treatment 10 μM Cisplatin for 48 hr; DCFH-DA was converted into DCF in green under fluorescence microscope by ROS (A), DCF positivity was presented a percentage of DCF fluorescence intensity to total cells (B); C and D: Percentage of mitochondrial superoxide (C) and mitochondrial membrane potential (MMP) (D) levels in the five groups of OVCAR-3 cells, with or without cisplatin treatment (10 μM). Experiments were performed in triplicate independently. * p < 0.05, ** p < 0.01, ***p < 0.001 or ****p < 0.0001, ns: no significance. Bars of 5 μm were indicated in each figure.
Galectins contribute to tumor invasion and metastasis (Hood and Cheresh, 2002; Liu and Rabinovich, 2005), and independently predict poor prognosis of EOC patients (Chen et al., 2017). Little is known about the mechanism underlining the involvement of galectin-3 in the chemo-resistance in EOC. In the present study, we recognized the regulation by galectin-3 on the sensitivity of ovarian cancer OVCAR-3 cells to cisplatin. Overexpression of galectin-3 exerted no influence on the growth of normal OVCAR-3 cells; however, the cisplatin-mediated growth reduction was markedly inhibited by galectin-3 in OVCAR-3 cells. Colony forming results also confirmed that cisplatin with a concentration of more than 10 μM reduced the colony forming by OVCAR-3 cells. However, galectin-3 also ameliorated the cisplatin-caused colony reduction in OVCAR-3 cells. In addition, we also investigated the apoptosis induction in the cisplatin-treated OVCAR-3 cells, with or without galectin-3 overexpression. We confirmed that galectin-3 overexpression downregulated the cisplatin-induced TUNEL-positivity and blocked the cleavage of apoptosis-related caspase 3 and 9. On the other hand, the galectin-3 knockdown aggravated cisplatin-induced TUNEL-positivity and cleavage of caspase 3 and 9. Therefore, galectin-3 downregulates the sensitivity of ovarian cancer OVCAR-3 cells to cisplatin.
Cisplatin-resistance-associated change in mitochondrial proteome has been recognized via mitochondrial proteomics in human EOC cells. Death receptor signaling, notch signaling, and activation of interferon regulatory factor (IRF) pathways were significantly associated with the cisplatin resistance in cisplatin-resistant (A2780-CP) human ovarian cancer cells (Chappell et al., 2012). Serine protease inhibition and mitochondrial dysfunction have been identified to associate with cisplatin resistance in human EOC HeLa cells (Dong et al., 1997). The enhanced ROS and mitochondrial membrane depolarization led to the cytochrome c release from mitochondria and to the activation of caspase 9 and caspase 3 in mitochondrial pathway (Biswas et al., 2015).
Our study also explores the involvement of mitochondrial function in the galectin-3-mediated regulation on cisplatin resistance in ovarian cancer OVCAR-3 cells. We confirmed that the cisplatin-promoted cytochrome c release from mitochondria, the mitochondrial ROS and superoxide were markedly inhibited by galectin-3 overexpression, whereas were aggravated by galectin-3 knockdown. The cisplatin-downregulated MMP was also blocked by galectin-3 overexpression, whereas was deteriorated by galectin-3 knockdown. Therefore, we confirm that galectin-3 targets mitochondria and inhibits cisplatin-induced mitochondrial function in ovarian cancer OVCAR-3 cells.
In conclusion, our study confirms that galectin-3 inhibits the sensitivity of human epithelial ovarian cancer OVCAR-3 cells to cisplatin, via inhibiting the cisplatin-mediated growth reduction, apoptosis induction and mitochondria dysfunction. This implies that galectin-3 might be an effective target to sensitize ovarian cancer cells to chemotherapy.
Conflict of interestThe authors declare that there is no conflict of interest.