Abstract
The Amino acid Derivative Reactivity Assay (ADRA) is an in chemico alternative to animal testing for the prediction of skin sensitization potential. Although co-elution of test chemicals and nucleophilic reagents during HPLC analysis is sometimes problematic when using the Direct Peptide Reactivity Assay (DPRA), it rarely occurs when using ADRA. Nevertheless, the application of either of these tests to multi-constituent substances requires nucleophilic reagents capable of selective detection. With this issue in mind, the authors developed an ADRA fluorescence detection method (ADRA-FL), which utilizes the natural fluorescence of ADRA nucleophilic reagents. In this study, we demonstrate the efficacy of ADRA-FL by testing 82 test chemicals used in the development of both DPRA and the conventional ADRA (ADRA-UV) as well as establish a threshold value for distinguishing sensitizers and non-sensitizers. Our results show that not only are depletion values obtained using ADRA-FL virtually identical to those obtained using ADRA-UV, the threshold value for either test is 4.9%. Additionally, in order to demonstrate the applicability of ADRA-FL to multi-constituent substances, we prepared test samples that consisted of a set of 10 non-sensitizers combined with one of 10 different sensitizers and tested each using ADRA-FL. The test results were concordant with those obtained using ADRA-UV. Also, because ADRA-FL chromatograms showed a significant decrease in multiple peaks as well as extremely stable baselines, we conclude that ADRA-FL is a highly selective and highly accurate mans of quantifying nucleophilic reagents that is applicable to a wide variety of chemical substances.
INTRODUCTION
The Amino acid Depletion Reactivity Assay (ADRA), which has been adopted as OECD TG 442C, APPENDIX II (2019), was developed by the authors of this paper as an in chemico test method that addresses the Molecular Initiating Event of covalent binding with proteins and has been shown to provide performance that is as good as or superior to DPRA, which has been adopted as OECD TG 442C, APPENDIX I (2019) (Fujita et al., 2014, 2019a; Yamamoto et al., 2015, 2019).
One major problem with in chemico alternatives to animal testing for skin sensitization potential is the simultaneous elution (co-elution) of the test chemical and nucleophilic reagents that takes place during HPLC-UV analysis to detect and quantify unreacted nucleophilic reagents. In such cases, it is often difficult to quantify unreacted nucleophilic reagents accurately, making it equally difficult to predict the sensitization potential of the test chemical.
In DPRA testing, since nucleophilic reagents are quantified at 220 nm using HPLC-UV analysis, the chromatogram exhibits multiple test chemical peaks that often co-elute with nucleophilic reagents (DPRA Validation Study Report 2012, Takenouchi et al., 2015). In contrast to this, ADRA has solved many of the issues inherent in DPRA, one of which is that, since nucleophilic reagents are quantified at 281 nm, there is rarely any co-elution of the test chemical and nucleophilic reagents (Fujita et al., 2019a, 2019b). This does not mean, however, that the test chemical never co-elutes with nucleophilic reagents during ADRA testing, and the potential for co-elution increases significantly when testing mixtures comprising multiple constituent substances. For this reason, it is necessary to adopt techniques that allow the selective detection of nucleophilic reagents.
Naphthalene is a key functional group of both NAC and NAL and is known to have a fluorescence emission spectrum between roughly 300 and 400 nm (Schwarz and Wasik, 1976; Maeda et al., 2012). In general, the emission of fluorescence requires a chemical structure with high planarity and rigidity, which is why a great many test chemicals do not emit fluorescence (Nijegorodov and Downey, 1994; Sauer et al., 2011). Since the nucleophilic reagents used in ADRA, NAC and NAL, have naphthalene rings introduced to their N-termini, they emit fluorescence (Fujita et al., 2019c). Thus, the use of fluorescence detection makes it possible to avoid the co-elution that occurs so often with UV detection. There are many examples of the use of fluorescence detection in HPLC analysis, and while there are some that include florescent test chemicals (Cecil and Rutan, 1991), most involve the fluorescence derivatization of amino acids, amino acid derivatives, or other non-fluorescent materials (Purcell et al., 1976; Mashat et al., 2008; Zandy et al., 2017; Muramoto and Kamiyama, 1985; Tapuhi et al., 1981; Imai and Watanabe, 1981). Like ADRA and DPRA, the High Throughput with Dansyl Cysteamine (HTS-DCYA) method is an in chemico test that was developed as an alternative to animal testing for skin sensitization. It is based on chemical reactivity toward a model fluorescent thiol (Avonto et al., 2015, 2018). The model fluorescent thiol, however, is technically problematic with regard to operability and control of reactivity, presenting the likelihood that even slight variations in reactivity will affect the fluorescence induction rate. Insofar as the NAC and NAL used in ADRA testing themselves emit fluorescence, there is no need for a separate process to induce fluorescence nor will reactivity affect fluorescence.
In this study, we demonstrate the efficacy of an ADRA fluorescence detection method (ADRA-FL) using 82 test chemicals used in the development of the conventional ADRA (ADRA-UV) as well as establish a threshold value for distinguishing between sensitizers and non-sensitizers. Additionally, we report on the applicability of ADRA-FL to mixtures of known sensitizers and non-sensitizers.
MATERIALS AND METHODS
Materials
NAC and NAL were synthesized using the method published by Fujita et al. (2014). Reagents of an equivalent grade to the NAC and NAL used in our testing are available commercially in an ADRA kit for skin sensitization testing from Fujifilm Wako Pure Chemical Corporation (Osaka, Japan). The 82 chemicals tested in this study are listed in Table 1-1 and 1-2. They have all been previously tested with ADRA (Fujita et al., 2014, 2019a, 2019c; Yamamoto et al., 2015) and DPRA (Gerberick et al., 2007).
Table 1-1Prediction results for 82 test chemicals evaluated using ADRA-FL - extreme/strong and moderate sensitizers -

Table 1-2Prediction results for 82 test chemicals evaluated using ADRA-FL - weak and non-sensitizers –
 Outline of the ADRA test method
Testing was performed in accordance with the ADRA test method developed by Fujita et al. (2019a). In this method, 1 mM test chemical solutions were prepared in acetonitrile, water, isopropanol, acetone, or acetonitrile containing 5% dimethyl sulfoxide (DMSO). Triplicate reactivity samples were prepared in 96-well microplates. For the reaction, 50 μL of the test chemical solution was added to 150 μL of the NAC or NAL stock solution with Ethylenediamine-N,N,N’,N’-tetraacetic acid (EDTA). As a control, wells without test chemicals were prepared in triplicate. The 96-well microplates were sealed with Plate Seal (Sumitomo Bakelite Co., Ltd., Tokyo, Japan), gently shaken, and incubated in the dark for 24 hr at 25°C. For ADRA-FL, the reaction solution was prepared in ten-fold dilution. Following incubation, 50 μL of 25% acetonitrile/2.25% TFA in water was added to the test samples, and the microplates were sealed with sealing mats (AxyGen Scientific, Inc., Union City, CA, USA). In addition, standards used for defining the calibration curve were prepared for NAC and NAL without test chemicals at concentrations ranging from 0.05 μM to 0.4 μM.
HPLC analysis of nucleophilic reagents
HPLC analysis was performed in accordance with the method developed by Fujita et al. (2019a). Acetonitrile and TFA for HPLC mobile phase preparation were purchased from Fujifilm Wako Pure Chemical Corporation. The mobile phase (A) and (B) were prepared to 0.1%TFA in water and 0.1%TFA in acetonitrile respectively. After incubation, NAC and NAL in all samples and standards were quantified using a RF10AXL (Shimadzu Corporation, Kyoto, Japan) on a CAPCELL CORE C18 column (2.7 μm, 3.0 × 150 mm, Osaka Soda Co., Ltd., Osaka, Japan). The flow rate was 0.3 mL/min, and the temperatures of the column oven and auto-sampler were maintained at 40°C and 4°C, respectively. 10 μL of each sample was injected, with a linear gradient from 30% B to 55% B for 9.5 min for NAC and from 20% B to 45% B for 9.5 min for NAL, followed by a rapid increase to 100% B for 0.5 min and holding 100% B for 3.5 min, then back to the initial conditions of 30% B for NAC and 20% B for NAL for a total analysis time of 20 min per sample. Finally, both NAC and NAL were detected by UV detection at 281 nm, and by fluorescence detection at emission wavelength 333 nm (at excitation wavelength 284 nm).
2-Class classification model
The quantitative structure-activity relationship (QSAR) modelling program was built by using Statistics Gradient Perceptron Model Settings in ADMEWORKS/ModelBuilder V4.5 (Fujitsu Kyushu Systems Limited, Fukuoka, Japan). In this software, samples were divided into 2 classes (sensitizer and non-sensitizer) by using a linear equation with depletion as the single parameter. An optimal average score that categorized sensitizers or non-sensitizers was calculated by using the following formulas.
Optimal average score = average - (standard deviation/weight) × constant
The average, standard deviation, weight, and constant were obtained from the Statistics Gradient Perceptron Model Settings calculation.
RESULTS
In this study, we demonstrated that ADRA-FL, which utilizes the detection of florescence not found in ordinary test chemicals, achieves the same results as the conventional ADRA-UV. To do this, we utilized 82 test chemicals that were used in the development of the DPRA and ADRA-UV test methods (Gerberick et al., 2007; Fujita et al., 2014, 2019a; Yamamoto et al., 2015).
Testing of 82 test chemicals and calculation of the threshold value
Benzylideneacetone displayed numerous extraneous components when quantified using HPLC with UV detection (HPLC-UV), and Fig. 1 shows elution behavior for both HPLC-UV and HPLC with fluorescence detection (HPLC-FL). The HPLC-UV chromatogram shows the peaks from multiple extraneous components that are considered to have originated from the benzylideneacetone together with those for NAC and NAL. The HPLC-FL chromatogram shows only the NAC and NAL peaks and no other components derived from test chemical. Moreover, the baseline in the HPLC-FL chromatogram is almost perfectly flat.
The results of calculating the individual depletions for NAC and NAL as well as the mean % depletion for each of 82 test chemicals are shown in Table 1-1 and 1-2. Also, Table 2 shows a list of test chemicals for which there was 10% or greater difference in depletion of either NAC or NAL between ADRA-UV and ADRA-FL as well as the likely reason for the difference.
Table 2. Test chemicals for which there was 10% or greater difference in depletion of either NAC or NAL between ADRA-UV and ADRA-FL.

We also calculated a threshold value for distinguishing sensitizers from non-sensitizers. Just like ADRA-UV, we developed a prediction model for binary classification of test chemical as either sensitizer or a non-sensitizer using ADMEWORKS ModelBuilder, a tool for building mathematical models. Predictions are made based on a mean % depletion, and a value of 4.9% was found to be the optimal threshold value for predicting a test chemical to be either a sensitizer or non-sensitizer under ADRA-FL. This criterion is identical to that used for ADRA-UV.
Predictive capacity for skin sensitization potential
Table 1-1 and 1-2 show the prediction results for 82 chemicals tested using ADRA-FL. However, the data of ADRA-UV are quoted form Fujita et al. (2019a).
Nine known sensitizers were incorrectly predicted to be non-sensitizers and one known non-sensitizer was incorrectly predicted to be a sensitizer under ADRA-FL. In contrast, ten known sensitizers were incorrectly predicted to be non-sensitizers and one known non-sensitizer was incorrectly predicted as a sensitizer under ADRA-UV (Table 1-1, 1-2). Only the prediction result of cyclamen aldehyde by ADRA-FL was not consistent with that by ADRA-UV.
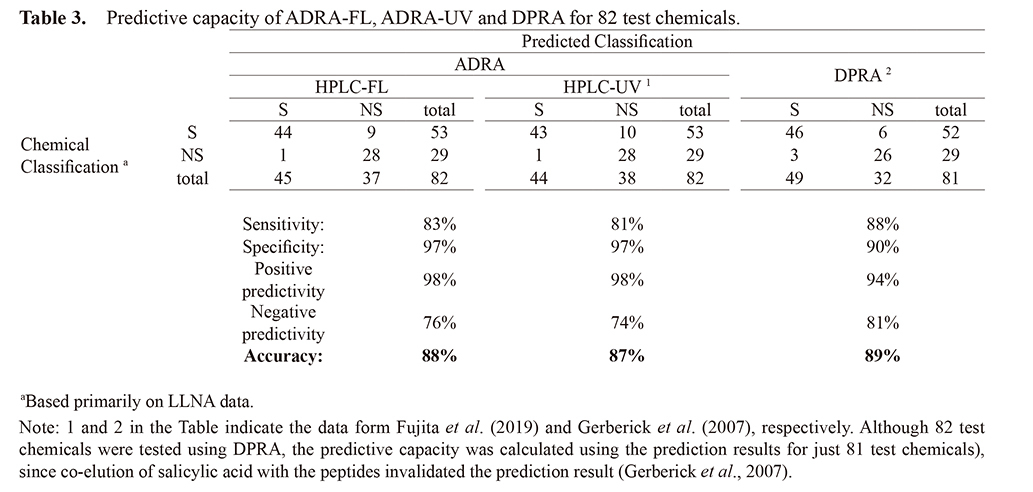
Using this threshold value, we calculated the sensitivity, specificity, and accuracy for ADRA-FL test method using Cooper statistics. The 88% accuracy of ADRA-FL is almost identical to the 87% of ADRA-UV. Moreover, the 83% sensitivity and 97% specificity of ADRA-FL are virtually identical to the 81% and 97% of ADRA-UV (Table 3).
Table 3. Predictive capacity of ADRA-FL, ADRA-UV and DPRA for 82 test chemicals.
 Predicting the skin sensitization potential of mixtures using ADRA-FL
While the ADRA-FL has been shown capable of predicting the skin sensitization potential of mono-constituent substances, in order to verify its capacity to detect sensitizers contained in multi-constituent substances, we prepared a negative control mixture (NCM) consisting of ten known non-sensitizers as well as a number of positive control mixtures (PCM) by adding one known sensitizer to the NCM. From these 82 test chemicals, we selected a total of 10 non-sensitizers, which have such as aromatic ring and exhibit the absorption of UV light but also which are structurally different from each other, as the NCM. Thus, we prepared and tested ten different PCM. The results of testing these 10 PCM using both ADRA-UV and ADRA-FL are shown in Table 4. These results show that not only did ADRA-FL replicate values for NAC and NAL depletion obtained using ADRA-UV for each PCM, it correctly predicted each to be a sensitizer.
Table 4. Reactivity of mixtures consisting of one known sensitizer and 10 known non-sensitizers using HPLC-FL and HPLC-UV.

Only the PCM containing glutaraldehyde exhibited co-elution when quantified using HPLC-UV, but as can be seen in Fig. 2, when quantified using HPLC-FL, the extraneous peaks were reduced significantly and there was no co-elution of either NAC or NAL. Additionally, the baseline was extremely stable. Also, although the PCM containing phenylacetaldehyde exhibited numerous extraneous components when quantified using HPLC-UV, as can be seen in Fig. 3, these extraneous peaks were reduced significantly for both NAC and NAL when quantified using HPLC-FL.
DISCUSSION
NAC and NAL have a naphthalene ring, which is known to have a fluorescence emission spectrum of from 310 to 370 nm (Schwarz and Wasik, 1976; Maeda et al., 2012). In fact the results of measuring the fluorescence spectrum of NAC and NAL indicated that the optimum parameters would be an excitation wavelength of 284 nm and an emission wavelength of 333 nm, and we reported that using fluorescence detection for HPLC analysis of NAC and NAL reveals a single sharp peak and stable baseline (Fujita et al., 2019c). Moreover, we reported on three multi-constituent plant extracts (Aloe, Green tea, and Licorice) that did not co-elute with NAC and NAL as long as ADRA-FL was utilized (Fujita et al., 2019c).
We used ADRA-FL to test 82 test chemicals used in the development of DPRA and ADRA-UV (Gerberick et al., 2007; Fujita et al., 2014, 2019a; Yamamoto et al., 2015) and obtained values for depletion of NAC and NAL as well as mean % depletion that closely replicated the results obtained using ADRA-UV (Fujita et al., 2019a). Insofar as the parameters are identical for both test methods and the only difference between ADRA-UV and ADRA-FL is the means of detection, it is entirely logical that these tests give concordant results. There were, however, a number of chemicals for which the difference in depletion was 10% or greater, and information on these differences is summarized in Table 2.
Oxazolone and benzoyl peroxide both exhibited a high level of NAL depletion that we consider to be within the expected range of variation. p-Benzoquinone and CD-3 are both pre-haptens, for which depletion can be expected to vary per the level of natural oxidation in the reaction solution. Since, however, CD3 (4-(N-Ethyl-N-2-methanesulfonylaminoethyl)-2-methylphenylenediamine) is a derivative of the pre-hapten “p-phenylene diamine”, we consider it likely that it was converted into the sensitizer “p-Benzoquinone diimine derivative” by air-oxidation. Glyoxal, cinnamaldehyde, phenyl acetaldehyde, 2,4-heptadienal, trans-2-hexenal, peril aldehyde, and Lilial are all aldehydes. Fujita et al. (2019a, 2019c) has reported that, in both DPRA and ADRA testing, the reactivity of aldehydes with nucleophilic reagents (with thiol groups in cysteine, in particular) exhibits significant variability. For example, cinnamaldehyde is used as a positive control in DPRA testing, and the DPRA Validation Study Report (2012) indicates that the acceptable range of variability is 60.8-100% for cysteine peptide and 40.2-69.4% for lysine peptide, both of which are unusually wide. Although the reasons for this variability remain unclear, since aldehydes oxidize easily, we consider it likely that the formation of carboxylic acid resulted in reduced reactivity with the nucleophilic reagent. While nonanoyl chloride does react readily with ε-amino groups in NAL, it simultaneously undergoes hydrolysis. For this reason, NAL depletion competes with the hydrolysis, resulting in variability. Imidazolidinyl urea is known to release formaldehyde as it decomposes in solution (Fasth et al., 2018). For this reason, differences in the rate of release of formaldehyde in solution affect depletion, resulting in variability. Although the cause of a 10% or greater difference in the depletions of benzylideneacetone and 4-allylanisole remains unclear, since benzylideneacetone exhibited a relatively high NAC depletion of 50% and 4-allylanisole exhibited a relatively low 12%, we expected it to be extremely likely that both these figures fall within the range of ordinary variability.
We also calculated, based on results obtained from ADRA-FL testing, a threshold value of 4.9% for distinguishing sensitizers from non-sensitizers, which at concordant with the value obtained from ADRA-UV testing. Insofar as this threshold value is the same whether using HPLC-UV or HPLC-FL, ADRA is an extremely versatile test method.
When quantifying depletion using ADRA-UV, cinnamaldehyde, benzylideneacetone, and 4-allylanisole all exhibited a great number of peaks originating from the test chemical itself as well as those thought to originate from substances derived during the reaction of the test chemical with the nucleophilic reagents. As can be seen in Fig. 1, however, when quantifying depletion using ADRA-FL, there was a significant reduction in peaks originating from the test chemicals, which made it easy to identify peaks from the nucleophilic reagents. Based on this, we conclude that the likelihood of co-elution when using ADRA-FL is even lower than when using ADRA-UV, which makes ADRA-FL capable of correctly predicting the skin sensitization potential of an even wider range of test chemicals than ADRA-UV.
Next, we prepared negative control mixtures (NCM), to which we added one known sensitizer to prepare positive control mixtures (PCM). The results of testing these 10 PCM using both ADRA-UV and ADRA-FL show that not only did ADRA-FL replicate values for depletion of NAC and NAL as well as mean % depletion for each PCM, it also correctly predicted each to be a sensitizer, thereby replicating ADRA-UV results (Fujita et al., 2019a).
The PCM containing the glutaraldehyde exhibited multiple peaks and co-elution when quantified using HPLC-UV, but as can be seen in Fig. 2, when quantified using HPLC-FL, the extraneous peaks were reduced significantly and there was no co-elution of either NAC or NAL. Also, although the PCM containing phenylacetaldehyde exhibited numerous extraneous components when quantified using HPLC-UV, as can be seen in Fig. 3, these extraneous peaks were reduced significantly when quantified using HPLC-FL. Thus, when compared with ADRA-UV, ADRA-FL was able to selectively detect and quantify to a high degree of accuracy the peaks only of nucleophilic reagents. Insofar as it was also capable of accurately predicting the skin sensitization potential of plant extracts that could not be quantified using ADRA-UV because of co-elution (Fujita et al., 2019c), ADRA-FL has proven to be a highly versatile test method that is suitable for predicting the skin sensitization potential of a wide range of both mono-constituent and multi-constituent substances.
In this study, we demonstrated the efficacy of a new derivation of ADRA that utilizes a highly sensitive as well as selective means of fluorescence detection. We also demonstrated how this highly sensitive as well as selective means of fluorescence detection enables ADRA-FL to predict the skin sensitization potential of mixtures, which is something for which there are virtually no reports from other similar tests (especially, using HPLC analysis) that are alternatives to animal testing. Moreover, given the fact that both ADRA-UV and ADRA-FL utilize the same the threshold value of 4.9%, researchers will have the advantage of being able to use whichever of these two easy-to-understand and most useful tests is the more convenient. Having demonstrated its applicability in the testing of cosmetic ingredients, industrial commodities, and a wide range of other multi-constituent substances, the focus of future study will include demonstrating ADRA’s superiority in fields for which there are as of yet no usable alternatives to animal testing for skin sensitization potential.
ACKNOWLEDGMENT
The authors wish to acknowledge Ms. Maiko Takasaki for technical contributions to this work.
Conflict of interest
The authors declare that there is no conflict of interest.
REFERENCES
- Avonto, C., Chittiboyina, A.G., Rua, D. and Khan, I.A. (2015): A fluorescence high throughput screening method for the detection of reactive electrophiles as potential skin sensitizers. Toxicol. Appl. Pharmacol., 289, 177-184.
- Avonto, C., Wang, M., Chittiboyina, A.G., Vukmanovic, S. and Khan, I.A. (2018): Chemical stability and in chemico reactivity of 24 fragrance ingredients of concern for skin sensitization risk assessment. Toxicol. In Vitro, 46, 237-245.
- Cecil, T.L. and Rutan, S.C. (1991): Fluorescence detection in liquid chromatography with an intensified diode-array detector. J. Chromatogr. A, 556, 495-503.
- EC EURL ECVAM. (2012), Direct Peptide Reactivity Assay (DPRA) Validation Study Report 74pp. Accessible at: http://ihcp.jrc.ec.europa.eu/our_labs/eurl-ecvam/eurl-ecvam-recommendations/eurl-ecvam-recommendation-on-the-direct-peptide-reactivity-assay-dpra
- Gerberick, G.F., Vassallo, J.D., Foertsch, L.M., Price, B.B., Chaney, J.G. and Lepoittevin, J.P. (2007): Quantification of chemical peptide reactivity for screening contact allergens: a classification tree model approach. Toxicol. Sci., 97, 417-427.
- Fasth, I.M., Ulrich, N.H. and Johansen, J.D. (2018): Ten-year trends in contact allergy to formaldehyde and formaldehyde-releasers. Contact Dermat., 79, 263-269.
- Fujita, M., Yamamoto, Y., Tahara, H., Kasahara, T., Jimbo, Y. and Hioki, T. (2014): Development of a prediction method for skin sensitization using novel cysteine and lysine derivatives. J. Pharmacol. Toxicol. Methods, 70, 94-105.
- Fujita, M., Yamamoto, Y., Watanabe, S., Sugawara, T., Wakabayashi, K., Tahara, Y., Horie, N., Fujimoto, K., Kusakari, K., Kurokawa, Y., Kawakami, T., Kojima, K., Kojima, H., Ono, A., Katsuoka, Y., Tanabe, H., Yokoyama, H. and Kasahara, T. (2019a): Cause of and countermeasures for oxidation of the cysteine-derived reagent used in the amino acid derivative reactivity assay. J. Appl. Toxicol., 39, 191-208.
- Fujita, M., Yamamoto, Y., Wanibuchi, S., Katsuoka, Y. and Kasahara, T. (2019b): The underlying factors that explain why nucleophilic reagents rarely co-elute with test chemicals in the ADRA. J. Pharmacol. Toxicol. Methods, 96, 95-105.
- Fujita, M., Yamamoto, Y., Wanibuchi, S., Katsuoka, Y. and Kasahara, T. (2019c): A newly developed means of HPLC-fluorescence analysis for predicting the skin sensitization potential of multi-constituent substances using ADRA. Toxicol. In Vitro, 59, 161-178.
- Imai, K. and Watanabe, Y. (1981): Fluorimetric determination of secondary amino acids by 7-fluoro-4-nitrobenzo-2-oxa-1,3-diazole. Anal. Chim. Acta, 130, 377-383.
- Maeda, H., Maeda, T. and Mizuno, K. (2012): Absorption and fluorescence spectroscopic properties of 1- and 1,4-silyl-substituted naphthalene derivatives. Molecules, 17, 5108-5125.
- Mashat, M., Chrystyn, H., Clark, B.J. and Assi, K.H. (2008): Development and validation of HPLC method for the determination of tobramycin in urine samples post-inhalation using pre-column derivatisation with fluorescein isothiocyanate. J. Chromatogr. B Analyt. Technol. Biomed. Life Sci., 869, 59-66.
- Muramoto, K. and Kamiyama, H. (1985): Analyses of Dansyl and Dabsyl Amino Acids by Reverse -Phase High-Performance Liquid Chromatography. Nippon Suisan Gakkaishi, 51, 817-824.
- Nijegorodov, N.I. and Downey, W.S. (1994): The Influence of Planarity and Rigidity on the Absorption and Fluorescence Parameters and Intersystem Crossing Rate Constant in Aromatic Molecules. J. Phys. Chem. A, 98, 5639-5643.
- OECD. (2019): OECD GUIDELINE FOR THE TESTING OF CHEMICALS 442C, APPENDIX I, In Chemico Skin Sensitisation: Direct Peptide Reactivity Assay (DPRA).
- OECD. (2019): OECD GUIDELINE FOR THE TESTING OF CHEMICALS 442C, APPENDIX II, In Chemico Skin Sensitisation: Amino acid Derivative Reactivity Assay (ADRA).
- Purcell, J.M., Quimby, D.J. and Cavanaugh. (1976): New method for determination of free amino groups in intact pure proteins: relationship to available lysine. J. Assoc. Off. Anal. Chem., 59, 1251-1254.
- Sauer, M., Hofkens, J. and Enderlein, J. (2011): Handbook of Fluorescence Spectroscopy and Imaging: From Ensemble to Single Molecules 1st edition, John Wiley & Sons, Inc.
- Schwarz, F.P. and Wasik, S.P. (1976): Fluorescence measurements of benzene, naphthalene, anthracene, pyrene, fluoranthene, and benzo(e)pyrene in water. Anal. Chem., 48, 524-528.
- Takenouchi, O., Fukui, S., Okamoto, K., Kurotani, S., Imai, N., Fujishiro, M., Kyotani, D., Kato, Y., Kasahara, T., Fujita, M., Toyoda, A., Sekiya, D., Watanabe, S., Seto, H., Hirota, M., Ashikaga, T. and Miyazawa, M. (2015): Test battery with the human cell line activation test, direct peptide reactivity assay and DEREK based on a 139 chemical data set for predicting skin sensitizing potential and potency of chemicals. J. Appl. Toxicol., 35, 1318-1332.
- Tapuhi, Y., Schmidt, D.E., Lindner, W. and Karger, B.L. (1981): Dansylation of amino acids for high-performance liquid chromatography analysis. Anal. Biochem., 115, 123-129.
- Yamamoto, Y., Tahara, H., Usami, R., Kasahara, T., Jimbo, Y., Hioki, T. and Fujita, M. (2015): A novel in chemico method to detect skin sensitizers in highly diluted reaction conditions. J. Appl. Toxicol., 35, 1348-1360.
- Yamamoto, Y., Wanibuchi, S., Fujita, M., Katsuoka, Y. and Kasahara, T. (2019): Expanding the applicability of the Amino acid Derivative Reactivity Assay (ADRA): determining a weight concentration for preparation of test chemical solutions that yields a predictive capacity identical to the conventional method using molar concentration and demonstrating the capacity to detect sensitizers in liquid mixtures. J. Pharmacol. Toxicol. Methods, 97, 67-79.
- Zandy, S.L., Doherty, J.M., Wibisono, N.D. and Gonzales, R.A. (2017): High sensitivity HPLC method for analysis of in vivo extracellular GABA using optimized fluorescence parameters for o-phthalaldehyde (OPA)/sulfite derivatives. J. Chromatogr. B Analyt. Technol. Biomed. Life Sci., 1055-1056, 1-7.
;%0A%09%09%09newWindow.document.open();%0A%09%09%09newWindow.document.write('<img src=%22./Graphics/44_821-t1-1.jpg%22>');%0A%09%09%09newWindow.document.close();%0A%09%09)
;%0A%09%09%09newWindow.document.open();%0A%09%09%09newWindow.document.write('<img src=%22./Graphics/44_821-t1-2.jpg%22>');%0A%09%09%09newWindow.document.close();%0A%09%09)

;%0A%09%09%09newWindow.document.open();%0A%09%09%09newWindow.document.write('<img src=%22./Graphics/44_821-t2.jpg%22>');%0A%09%09%09newWindow.document.close();%0A%09%09)
;%0A%09%09%09newWindow.document.open();%0A%09%09%09newWindow.document.write('<img src=%22./Graphics/44_821-t3.jpg%22>');%0A%09%09%09newWindow.document.close();%0A%09%09)
;%0A%09%09%09newWindow.document.open();%0A%09%09%09newWindow.document.write('<img src=%22./Graphics/44_821-t4.jpg%22>');%0A%09%09%09newWindow.document.close();%0A%09%09)

