Abstract
Amino acid derivative reactivity assay (ADRA) has previously been developed as an alternative method to direct peptide reactivity assay (DPRA) to evaluate key event 1 in skin sensitization mechanisms. However, when using alternative methods for skin sensitization, integrated approaches to testing and assessment (IATA) that combine the results of multiple tests evaluating different key events are generally required. To verify whether ADRA can be used in IATA, we replaced DPRA with ADRA in five IATA methods combining DPRA, KeratinoSens, and h-CLAT: (i) the “2 out of 3” approach, (ii) the “3 out of 3” approach, (iii) sequential testing strategy (STS), (iv) integrated testing strategy by scoring approach (ITS-SA), and (v) the “ITS by two methods approach” (ITS-2MA). The prediction accuracy of the “2 out of 3” approach using ADRA (1 mM) and ADRA (0.5 mg/mL) was 90.0% and 91.1%, respectively, for human data, and was very similar to that obtained using DPRA (91.1%). The “3 out of 3” approach also showed good predictability (83.2%) using either ADRA (1 mM) or ADRA (0.5 mg/mL) compared to DPRA. Regarding the accuracy of the prediction of sensitization intensity for the human data by the third classification, prediction accuracy using ADRA was almost the same as STS, ITS-SA, or ITS-2MA using DPRA. As a result, this study showed that ADRA can be used as a test method for key event 1 in the evaluation of skin sensitization by combining multiple alternative methods.
INTRODUCTION
Alternative methods exist for testing skin sensitization potential that address elements of the adverse outcome pathway (AOP) as endpoints. These include the following: the direct peptide reactivity assay (OECD TG442C, 2015), which addresses key event 1 of covalent binding with proteins (haptenization); the ARE-Nrf2 Luciferase KeratinoSensTM and ARE-Nrf2 Luciferase LuSens tests (OECD TG442D, 2018), which address key event 2 of keratinocyte activation; the human cell line activation test (h-CLAT), the U937 cell line activation test (U-SenseTM), and the IL-8 Luc assay (OECD TG442E, 2018), which address key event 3 of dendritic cell activation; and, lastly, the murine local lymph node assay (OECD429, 2010), which addresses key event 4 of activation and proliferation of antigen-specific T-cells.
The sensitization mechanism, comprising the molecular initiating event and other key events mentioned above, is a complex one that should be assessed using a combination of test methods under an integrated approach to testing and assessment (IATA) (OECD, Series on Testing & Assessment No. 255, 2016). The data generated with the test methods described in each Test Guideline are also proposed to support the discrimination between skin sensitizers (i.e. UN GHS Category 1) and non-sensitizers when used within IATA. In fact, Urbisch et al. (2015) reported that predictions for the skin sensitization potential of test chemicals using an IATA comprised of direct peptide reactivity assay (DPRA), KeratinoSens, and h-CLAT were more accurate than those made using local lymph node assay (LLNA), when compared with human data.
To develop amino acid derivative reactivity assay (ADRA), we focused on the molecular initiating event of covalent binding with proteins by synthesizing two nucleophilic reagents from heptapeptides. We introduced naphthalene rings to the N-termini of both cysteine and lysine, thereby synthesizing N-(2-(1-naphthyl)acetyl)-L-cysteine (NAC) and α-N-(2-(1-naphthyl)acetyl)-L-lysine (NAL) (Fujita et al., 2014). It is possible to use ADRA to evaluate the sensitization potential of chemicals at a reaction solution concentration of about 1/100th that of DPRA, using a peptide as a nucleophilic reagent, and has been confirmed to obtain an equivalent predictive accuracy (Fujita et al., 2014; Yamamoto et al., 2015). Using DPRA, peptides were only detected at a wavelength of 220 nm, suggesting that they can only be detected at high concentrations. On the other hand, NAC and NAL were detected at a wavelength of 281 nm using ADRA, indicating that NAC and NAL can be detected even in low concentrations. There is almost no co-elution of chemicals and nucleophiles in ADRA (Fujita et al., 2019a) such that ADRA can be used to evaluate chemicals with poor solubility. Although DPRA does not take measures to prevent the oxidation of NAC, the addition of EDTA to NAC solution provides increased stability and prevents the oxidative dimerization of cysteine derivatives in ADRA (Fujita et al., 2019b). Furthermore, we previously demonstrated that even test chemicals of an unknown molecular weight could be tested with the same or higher predictive capacity than conventional DPRA and ADRA testing methods (preparing molar concentration) when the test chemical solutions are prepared to a weight concentration of 0.5 mg/mL (Yamamoto et al., 2019). Moreover, we also demonstrated that ADRA could detect the sensitization potential of pseudo-binary mixtures comprising 10 different non-sensitizers and one sensitizer (Yamamoto et al., 2019). In addition, the naphthalene ring in the NAC and NAL solutions is fluorescent, such that NAC and NAL can be detected using a fluorescence detector, and allows ADRA to be used to assess sensitization potentials in mixtures which are difficult to measure using a UV detector due to presence of a wide variety of components, such as in plant extracts (Fujita et al., 2019c).
Although ADRA appears to have many advantages over DPRA, the prediction of sensitization by combining ADRA with other sensitization tests has not yet been carried out.
Therefore, in this study, in order to demonstrate the usefulness of ADRA in IATA, the “2 out of 3” approach (Urbisch et al., 2015) and the “3 out of 3” approach (Ministry of Health, Labor and Welfare, 2018), combining DPRA, KeratinoSens, and h-CLAT, were applied. Moreover, as an analytical method for predicting sensitization intensity, ADRA was applied to the sequential testing strategy (STS) approach and integrated testing strategy by scoring approach (ITS-SA), combining h-CLAT and DPRA with DEREK, a quantitative structure-activity relationship (Nukada et al., 2013; Takenouchi et al., 2015).
Furthermore, we proposed an “integrated testing strategy by two methods approach” (ITS-2MA) which used the results from two methods (DPRA or ADRA and h-CLAT). In this study, each DPRA used in the five test methods was replaced with ADRA, and the predictive capacity when using ADRA was compared with the predictive capacity when using DPRA.
MATERIALS AND METHODS
Test chemicals
In this study, a total of 161 test chemicals were evaluated by several approaches for the prediction of skin sensitization potential. Among these chemicals, 90 chemicals whose ADRA results had not yet been published were newly evaluated. These chemicals are presented in Table 1 with their CAS numbers and suppliers.
Table 1. Reactivity of test chemicals evaluated in this study to NAC and NAL in ADRA (1 mM) and ADRA (0.5 mg/mL) with results expressed as percent depletion of non-reacted NAC and NAL.
 Amino acid derivative reactivity assay
NAC and NAL were synthesized in our laboratory. The stock solutions were prepared to 6.67 μM in 100 mM sodium phosphate buffer with a pH of 8.0 for NAC and 10.2 for NAL. The NAC stock solution also contained 0.33 μM of ethylenediamine-N,N,N’,N’-tetra acetic acid disodium salt dehydrate (EDTA). Reagents of an equivalent grade to NAC and NAL are available commercially in an ADRA kit for skin sensitization testing (Fujifilm, Wako Pure Chemical Corporation, Osaka, Japan).
In addition to the conventional method, where a test chemical solution was prepared at a molar concentration (1 mM), the same data analysis was also conducted using a test chemical solution prepared at a weight concentration (0.5 mg/mL) in this study. This method has been reported to result in both an accuracy of prediction that is equal to or greater than that of the conventional method and a higher sensitivity (Yamamoto et al., 2019).
Test chemical solutions were prepared to molar concentration of 1 mM and a weight concentration of 0.5 mg/mL in water, acetonitrile, acetone, or 5% DMSO in acetonitrile.
Reaction solutions were prepared by mixing NAC or NAL stock solution with test chemical solution in a 96-well microplate. The concentration of NAC or NAL stock solution and the test chemical solution in reaction solutions were 5 μM and 250 μM (molar concentration) or 125 μg/mL (weight concentration). Additionally, control samples without test chemicals were also prepared. These solutions were prepared in triplicate and incubated in the dark for 24 hr at 25°C. After incubation, trifluoroacetic acid (TFA) in water was added to all reaction solutions to a final concentration of 0.5%. Before HPLC analysis, to determine the calibration curves, standard solutions were prepared for NAC and NAL at concentrations ranging from 0.156 to 5.0 μM. Then, NAC and NAL in all samples and standards were quantified using an LC-20A HPLC system (Prominence, Shimadzu Scientific Instruments, Kyoto, Japan) with a CAPCELL CORE C18 column (2.7 μm, 3.0 × 150 mm, Osaka Soda Co., Ltd., Osaka, Japan) at 281 nm for UV detection. Finally, the percentage depletion of NAC and NAL was calculated based on the decreased concentrations of the reaction solutions relative to the average concentration measured in the control. Solutions with a mean percentage depletion of 4.9% or greater were considered sensitizers, while those with a mean percentage depletion lower than 4.9% were considered non-sensitizers.
Data analysis and prediction
Of the total 161 test chemicals, 99 test chemicals were used in the “2 out of 3” approach, 97 test chemicals were used in the “3 out of 3” approach, and 139 test chemicals were used to evaluate sensitization intensity (STS approaches and ITS-SA). The results of each test method used in these approaches were cited from previously reported papers (Urbisch et al., 2015; Takenouchi et al., 2015), except for the data on ADRA in the 90 newly acquired chemicals. The data of sensitization potential predicted by ADRA was based on the following two methods: ADRA (1 mM) using a 1 mM test chemical solution and ADRA (0.5 mg/mL) using a test chemical solution at 0.5 mg/mL. The “2 out of 3” approach (Urbisch et al., 2015) and “3 out of 3” approach (Ministry of Health, Labor and Welfare, 2018) were used to determine the presence or absence of sensitization. In these approaches, sensitization predictions were performed by combining the results of either ADRA or DPRA with the results of KeratinoSens and h-CLAT. In the “2 out of 3” approach, the sensitization potential of each test chemical was classified as either sensitizer or non-sensitizer according to the majority of the results of three tests (Table 2a). In the “3 out of 3” approach, the sensitization potential was classified as sensitizer if it was positive in one of tests and non-sensitizer if it was negative in all three tests (Table 2b).
Table 2. Predictive capacity of ‘2 out of 3’ and ‘3 out of 3’ approach.

For the classification of sensitization intensity, we used the STS and ITS-SA approaches (Nukada et al., 2013; Takenouchi et al., 2015) and replaced DPRA with ADRA. Moreover, we implemented a newly invented approach, the “integrated testing strategy by two methods approach” (ITS-2MA), which combines DPRA or ADRA with h-CLAT, and the effectiveness of this approach was compared and verified.
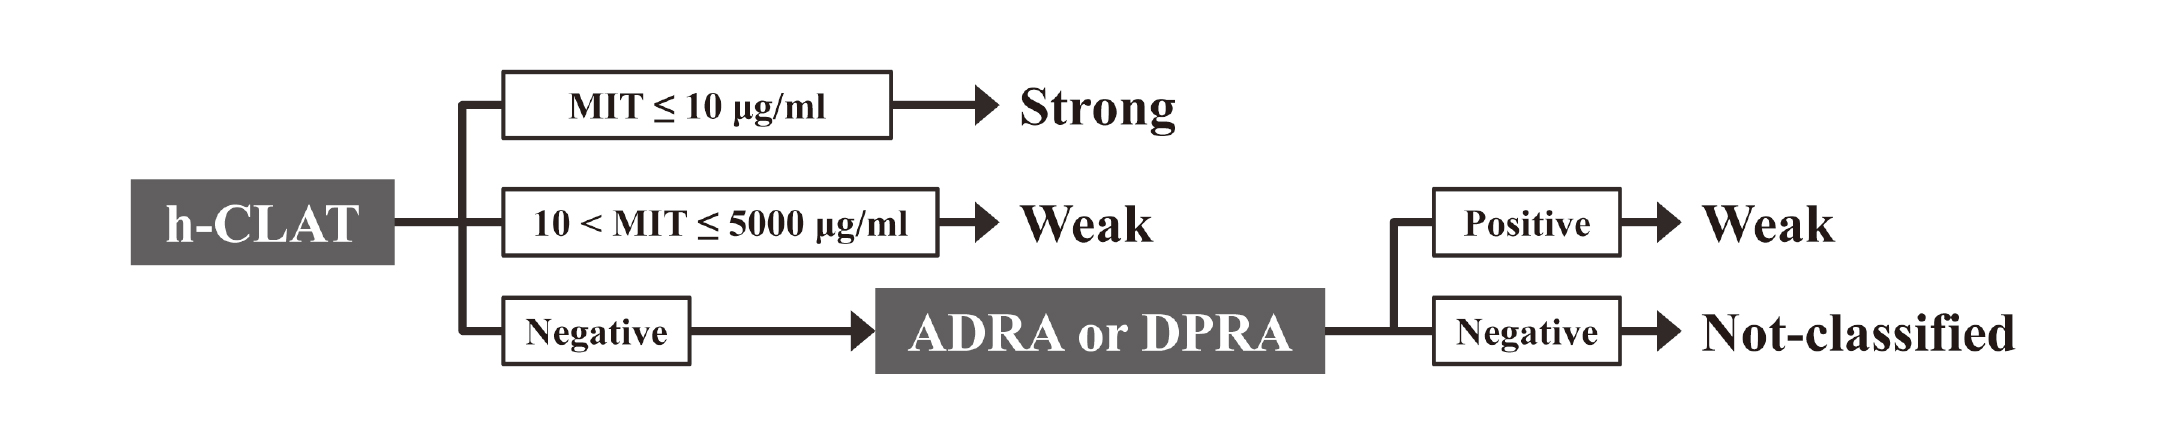
The STS is an approach combining h-CLAT and DPRA or ADRA as described in Fig. 1. This approach classifies test chemicals into three classes: strong, weak, and negative. This classification is based on the minimum induction threshold (MIT) calculated from the h-CLAT result. Furthermore, based on the results of ADRA or DPRA, “negative” chemicals can be classified either as “weak” if the ADRA or DPRA results are positive or as “not-classified” if the ADRA or DPRA results are negative (Fig. 1).
The ITS-SA scores of h-CLAT, DEREK, and ADRA or DPRA for the different test chemicals are presented in Table 3-1. Based on the total score of the results of the three types of test methods (Table 3-2), the chemicals were classified into one of three classes: strong, weak, or not-classified. We denoted the traditional method of sensitizer classification (where a total score of 7 is considered “strong”) as ITS-SA (1) and our novel approach (where a total score of 6 or more is considered “strong”) as ITS-SA (2).
Table 3-1. Conversion of the outcome in h-CLAT, ADRA, DPRA and DEREK to ‘ITS score’ for integrated testing strategy by scoring approach (ITS-SA).
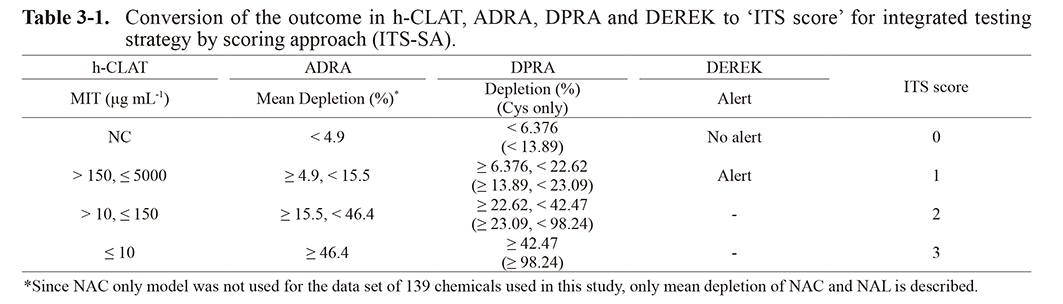
Table 3-2. Potency class to total ‘ITS score’ for integrated testing strategy by scoring approach (ITS-SA(1) or ITS-SA(2)).
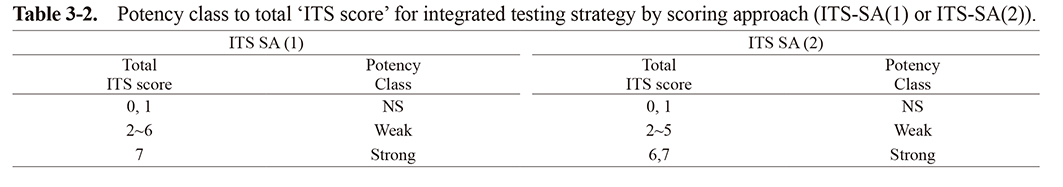
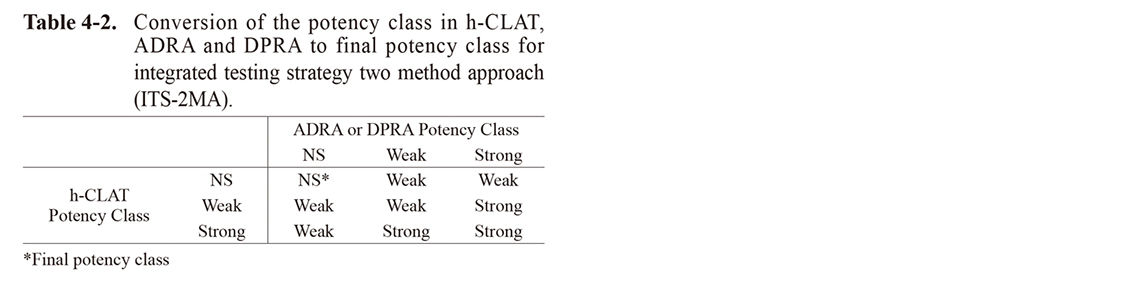
In ITS-2MA, the test chemicals were first classified as either “strong”, “weak”, or “not-classified” in each test method from the depletion (%) of ADRA or DPRA and the MIT values of h-CLAT, as shown in Table 4-1. Then, the final sensitizing potency of each test chemical was classified as “strong”, “weak”, or “not-classified” based on these classification results, as shown in Table 4-2.
Table 4-1. Conversion of the outcome in h-CLAT, ADRA and DPRA to potency class for integrated testing strategy two method approach (ITS-2MA).
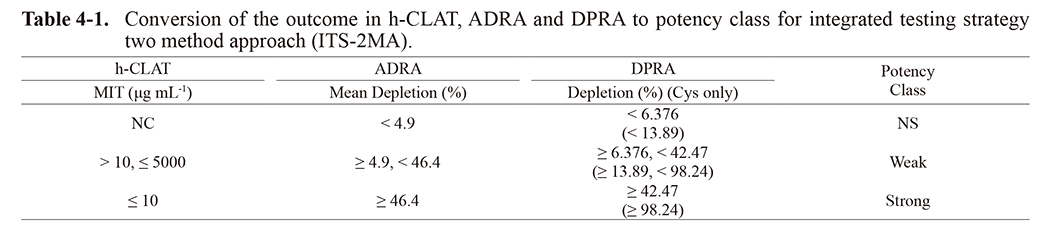
Table 4-2. Conversion of the potency class in h-CLAT, ADRA and DPRA to final potency class for integrated testing strategy two method approach (ITS-2MA).
In the above approaches, the prediction accuracy for the human and LLNA data was calculated using Cooper statistics.
RESULTS
In order to confirm the applicability of ADRA in IATA, the predictive capacity when using ADRA instead of DPRA in the five approaches (“2 out of 3” approach, “3 out of 3” approach, ITS-SA, STS, and ITS-2MA) was determined. For the evaluation of ADRA, the method using a test chemical solution of 0.5 mg/mL (ADRA (0.5 mg/mL)) was conducted in addition to the conventional method using a test chemical solution of 1 mM (ADRA (1 mM)).
Table 1 shows the depletion of NAC and NAL in the 90 newly evaluated chemicals in this study. For data on the ADRA of other chemicals, previously reported data were used (Fujita et al., 2019b; Yamamoto et al., 2019). Furthermore, data from other alternative methods (DPRA, KeratinoSens, h-CLAT, and DEREK) were also referenced from reported data (Supplementary Tables 1 and 2).
Predictive capacity of the “2 out of 3” approach and bottom-up “3 out of 3” approach
Among the chemical datasets used in the report by Urbisch et al. (2015), the number of chemicals that can be determined by both DPRA and ADRA was 99 for the “2 out of 3” approach and 97 for the “3 out of 3” approach.
As shown in Table 2, in the predictive capacity for human data and LLNA data by the “2 out of 3” approach, the accuracy when using ADRA (0.5 mg/mL) was almost the same as that when using DPRA. However, when using ADRA (1 mM), this capacity was 3-4% lower than that when using DPRA. The predictive capacity for human data and LLNA data using the “3 out of 3” approach was not significantly different when either ADRA (1 mM), ADRA (0.5 mg/mL), or DPRA was used (Table 2).
Predictive capacity for skin sensitization potency
A dataset of 139 compounds was used in IATA to predict skin sensitization potency by Takenouchi et al. (2015). Here, the ability to predict sensitization potency with ADRA was verified using this dataset. In their report, Takenouchi et al. (2015) only predicted for the LLNA data. However, in this study, we also predicted for human data. For the prediction of skin sensitization potency using the three-rank classification, the IATA results for the LLNA were classified as follows: “strong” as “extreme” and “strong”, “weak” as “moderate” and “weak”, and “non-sensitizer” as “not-classified”. For the human data, the category of skin sensitization potency reported by Basketter et al. (2014) was converted to the IATA categories as follows: category 1 and 2 as “strong”, category 3 and 4 as “weak”, and category 5 and 6 as “not-classified”. For the two-rank classification, 16 chemicals that had information on the presence or absence of skin sensitization but no information on skin sensitization potency were added to above 69 chemicals, such that a total of 85 chemicals were evaluated.
Prior to verification using a combination of multiple methods, the predictive capacity for the human and LLNA data by either ADRA or DPRA alone were compared for the 139 chemicals reported by Takenouchi et al. (2013).
As shown in Table 5-1, the accuracy for the human data was similar for ADRA (0.5 mg /mL) and DPRA; however, the accuracy from ADRA (1 mM) was about 6% lower in the two classifications of sensitization and non-sensitization. For the LLNA data, the accuracy of ADRA (0.5 mg/mL) was the highest. The accuracy of DPRA was about 2% lower and ADRA (1 mM) about 4% lower than ADRA (0.5 mg/mL).
For three-rank classification of “strong”, “weak”, and “not-classified”, the accuracy for the human data was the same for ADRA (0.5 mg/mL) and DPRA; however, the accuracy for ADRA (1 mM) was about 7% lower. In contrast, for the LLNA data, ADRA (1 mM) and ADRA (0.5 mg/mL) had the same accuracy, and the accuracy for DPRA was about 7% lower.
Predictive capacity of sequential testing strategy
Table 5-2 shows the predictive capacity of 139 chemicals using the STS approach combining h-CLAT with ADRA instead of DPRA. As a result, in the prediction for both the two- and three-rank classifications, the accuracy for the human and LLNA data was almost the same when ADRA (1 mM), ADRA (0.5 mg/mL), and DPRA were combined with h-CLAT.
Predictive capacity of integrated testing strategy by scoring approach
The predictive capacity of ITS, combining h-CLAT, DEREK, and either ADRA (1 mM), ADRA (0.5 mg/mL) or DPRA is shown in Table 5-3 using the scoring approach. The accuracy for the human and LLNA data was almost the same when ADRA (1 mM), ADRA (0.5 mg/mL), and DPRA were combined with h-CLAT for the two-rank classification. For three-rank classification, we calculated the predictive capacity using both the original classification method (where a total score of 7 is considered “strong” (ITS-SA (1) (Table 5-3)), as reported by Takenouchi et al. (2015), and the revised classification method (where a total score of 6 or more is considered “strong” (ITS-SA (2) (Table 5-3)).
Table 5-1. Predictive capacity of ADRA and DPRA.
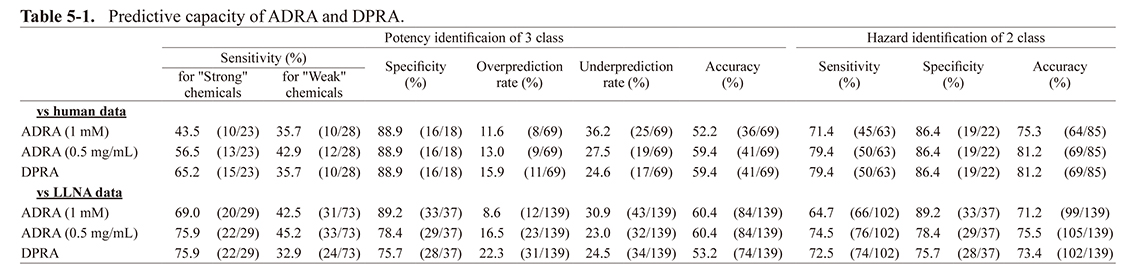
Table 5-2. Predictive capacity of Sequential testing strategy (STS) approach.
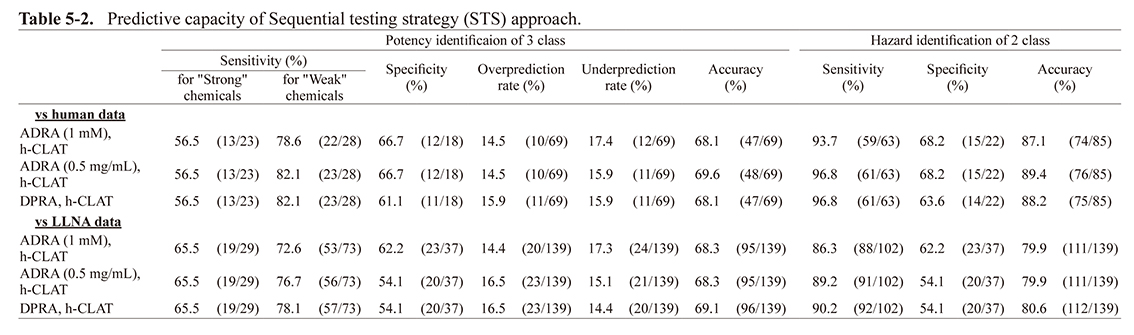
Table 5-3. Predictive capacity of Integrated testing strategy by scoring approach (ITS-SA(1) or ITS-SA(2)).
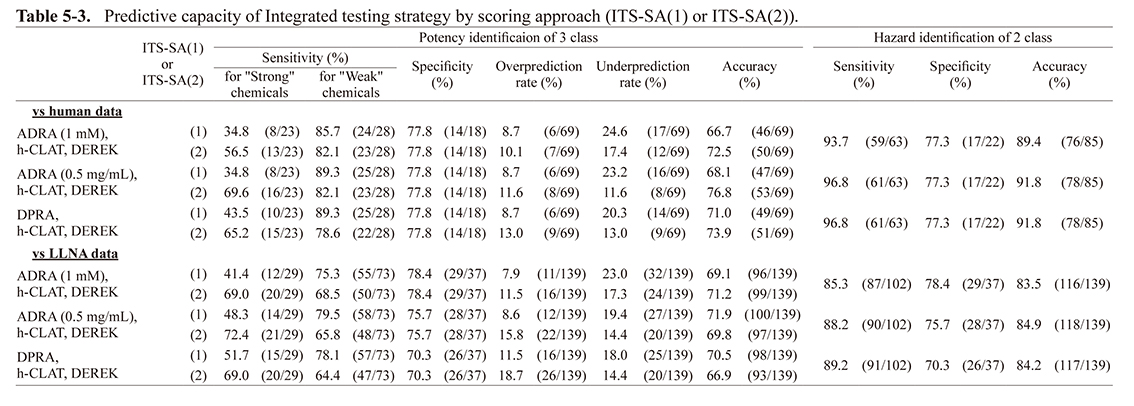
Table 5-4. Predictive capacity of Integrated testing strategy by 2 methods approach (ITS-2MA).

For ITS-SA (1), the accuracy for human data when using ADRA (1 mM or 0.5 mg/mL) was 3-4% lower than the accuracy when using DPRA. However, the accuracy for the LLNA data was similar for both. For ITS-SA (2), the accuracy for human data when using ADRA (1 mM) was almost equal to that of DPRA. However, the accuracy for LLNA data when using ADRA (1 mM) was about 4% higher than the accuracy when using DPRA. When using ADRA (0.5 mg/mL), the accuracy was about 3% higher for both the human and LLNA data compared to DPRA.
Predictive capacity of integrated testing strategy by two methods approach (ITS-2MA)
In this study, we created a novel ITS approach by combining two test methods: ADRA (1 mM or 0.5 mg/mL) or DPRA with h-CLAT (denoted as the “ITS by two methods approach” (ITS-2MA)). The dataset of the above 139 chemicals was evaluated using this novel approach and its predictive capacity for both the human and LLNA data was calculated.
For the two-rank classification, the same result as STS was obtained. For the three-rank classification, the combination of ADRA (1 mM) and h-CLAT had the same accuracy for the human data compared to DPRA and h-CLAT. However, the accuracy for the LLNA data when using ADRA (1 mM) was approximately 7% higher than the accuracy when using DPRA. By using ADRA (0.5 mg/mL), the accuracy of prediction was about 3% higher than that of DPRA for both the human and LLNA data.
Predictive capacity when excluding chemicals beyond the applicability domain
The applicability domain of test chemicals is defined in each alternative method as follows: metal and pre/pro-hapten for DPRA and ADRA, pre/pro-hapten for KeratinoSens, and pre/pro-hapten and logKow ≥ 3.5 for h-CLAT. Chemicals outside the applicability domain are adopted if the result is positive; however, if the result is negative, there is a possibility that they will not be judged as positive correctly because the chemical is out of the applicability domain. In this case, the result is considered to be inconclusive. Therefore, the predictive capacity was recalculated in the case of excluding negative results outside the applicability domain in each test method. In addition to chemicals outside the applicability domain, although penicillin G was found to be positive by DPRA in the report by Urbisch et al. (2015), it was found to be negative in our study (data not shown). Since penicillin G has a β-lactam structure that reacts with the OH group of serine in the protein, there is a possibility that it cannot be evaluated correctly by ADRA and DPRA since they evaluate reactivity to lysine and cysteine (Ghuysen, 1991). Therefore, this chemical was also excluded. Two surfactants, benzalkonium chloride and Tween-80, were found to have a logKow ≥ 3.5 by Urbisch et al. (2015); however, because they are easily dissolved in water and were found to have a logKow > 3.5 by Takenouchi et al. (2013), these chemicals were also not excluded. However, although benzalkonium chloride was found to be a non-sensitizer in both of these previous studies, since other studies found them to be positive via human patch tests (Dao et al., 2012; Wilhelm et al., 2007), it was possible that ADRA (1 mM) and ADRA (0.5 mg/mL) could be used to predict skin sensitization using human data. As it remains unclear whether this chemical is a sensitizer or not, it was excluded from this study. Likewise, although Linalool and R (+)-limonene have been found to be non-sensitizing for humans by Urbisch et al. (2015), they were found to be sensitizers in other reports (Basketter et al., 2014; Karlberg et al., 1994). As such, these chemicals were also excluded (they were previously excluded from the “2 out of 3” approach due to being negative and out of the applicability domain).
In the “2 out of 3” approach, when negative and outside the applicability domain result was inconclusive, a total of seven chemicals could not be evaluated (asterisk (*) in Supplementary Table 1). The accuracy for the human and LLNA data in 89 chemicals after the exclusion of these seven chemicals, as well as penicillin G and benzalkonium chloride, increased by 2-7% compared to before exclusion (Table 6).
Table 6. Predictive capacity of “2 out of 3” and “3 out of 3” approach limited to chemicals that fall within the applicability domain.
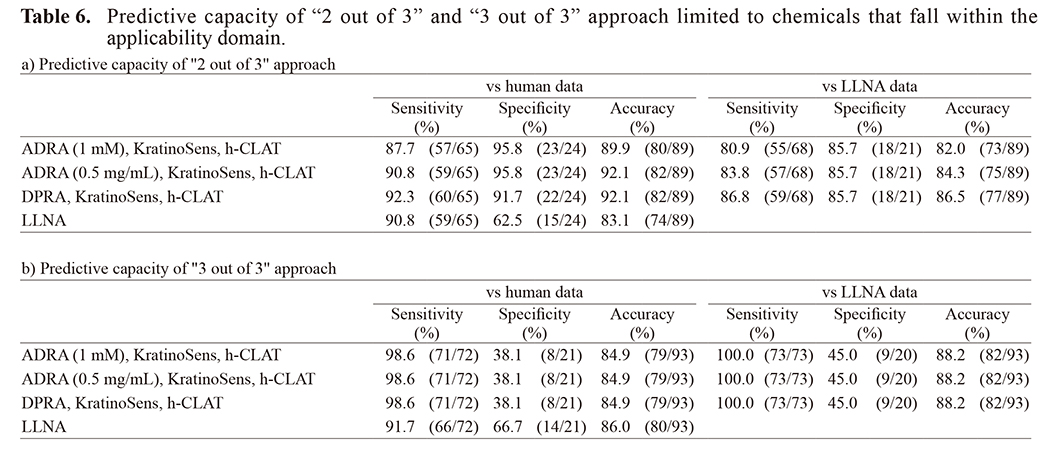
In the “3 out of 3” approach, when the result was inconclusive, the chemical that could not be evaluated was a diethylenetriamine (asterisk (*) in Supplementary Table 1). The accuracy of the human data for 93 chemicals (not including diethylenetriamine, benzalkonium chloride, linalool, or R (+)-limonene), increased about 2-4% compared to before exclusion, regardless of whether ADRA (1 mM), ADRA (0.5 mg/mL), or DPRA (Table 6) was used. On the other hand, the accuracy for the LLNA data was almost the same that as that before exclusion.
For the prediction for human sensitization potency by either ADRA or DPRA alone, 11 of 85 chemicals were classified as inconclusive due to a negative result outside the applicability domain for the evaluation of the two-rank classification, and 9 of 69 chemicals for the evaluation three-rank classification (asterisk (*) in Supplementary Table 2). For the LLNA data, 14 of 139 chemicals were classified as inconclusive for both the two- and three-rank classifications (asterisk (*) in Supplementary Table 2). In addition to these chemicals, benzalkonium chloride and linalool were excluded as in the “2 out of 3” and “3 out of 3” approaches. Excluding the above chemicals, the accuracy for both the human and LLNA data increased 2-11% in both the two- and three-rank classifications.
For the two-rank classification of the human data by STS, ITS-SA, and ITS-2MA, 4 out of 85 chemicals were classified as inconclusive when the negative result outside the applicability domain was excluded (“a” in Supplementary Table 2). For the three-rank classification, from a dataset of 69 chemicals, 5 chemicals were classified as inconclusive by STS and 14 chemicals were classified as inconclusive by ITS-SA and ITS-2MA (“b” in Supplementary Table 2). From a dataset of 139 chemicals used for LLNA data prediction, 13 chemicals were classified as inconclusive for the two-rank classification by all three approaches. For the three-rank classification, from a dataset of 129 chemicals, 16 were classified as inconclusive by STS and 29 were classified as inconclusive by ITS-SA and ITS-2MA (“c” and “d” in Supplementary Table 2). In addition to these chemicals, benzalkonium chloride and linalool were also excluded from all three approaches.
For the prediction of human data using STS when excluding the above-mentioned chemicals, the accuracy was almost the same compared to before the exclusion of these chemicals for both the two- and three-rank classifications, regardless of whether ADRA (1 mM), ADRA (0.5 mg/mL), or DPRA were used. On the other hand, the accuracy for the LLNA data increased by 2-8% compared to before the exclusion of the chemicals for both the two- and three-rank classification, also regardless of whether ADRA (1 mM), ADRA (0.5 mg/mL), or DPRA were used.
For the two-rank classification by ITS-SA, when excluding the above-mentioned chemicals, the accuracy for the human data was almost the same as that before the exclusion of the chemicals with any combination of methods. However, for the LLNA data, the accuracy increased by 3-9%. For the three-rank classification, the accuracy for the human data by ITS-SA (1) was lower than that before exclusion; however, the accuracy obtained by ITS-SA (2) was almost the same as that before exclusion. The accuracy for the LLNA data by both ITS-SA (1) and ITS-SA (2) increased by 3-5% using either ADRA (1 mM) or ADRA (0.5 mg/mL) compared to that before exclusion. However, the accuracy obtained using DPRA was almost the same as that before exclusion.
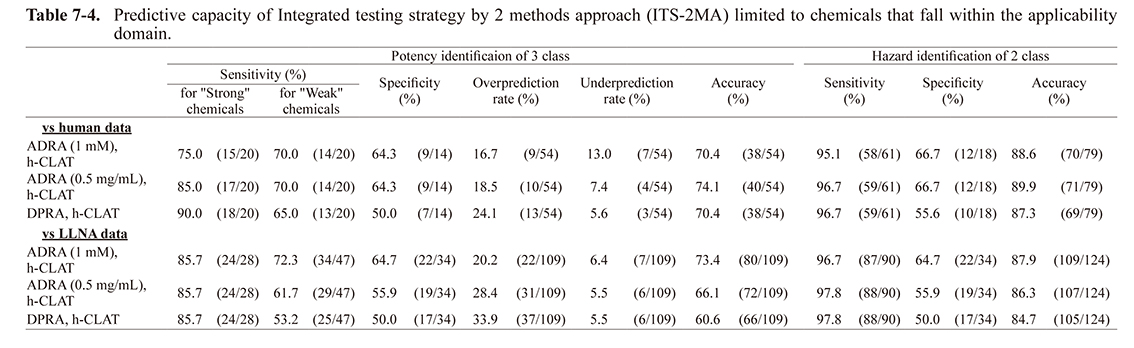
For the prediction of the human data by ITS-2MA when excluding the above-mentioned chemicals, the accuracy was almost the same as before exclusion for both two-rank and three-rank classification, regardless of whether ADRA (1 mM), ADRA (0.5 mg/mL), or DPRA were used. In contrast, the accuracy for the LLNA data increased by 4-8% for the two-rank classification with any combination of methods. For the three-rank classification, although the accuracy increased by approximately 4% when using ADRA (1 mM), it was almost the same for both ADRA (0.5 mg/mL) and DPRA.
DISCUSSION
The “2 out of 3” and “3 out of 3” approaches using DPRA, KeratinoSens and h-CLAT evaluate different key events in the AOP of skin sensitization and have been previously used to predict skin sensitization by IATA. In this study, we compared the results obtained using ADRA with those using DPRA with these approaches to assess the applicability of ADRA. In addition to the conventional method, where a test chemical solution was prepared at a molar concentration (1 mM), the same data analysis was also conducted using a test chemical solution prepared at a weight concentration (0.5 mg/mL). This method has been reported to result in both an accuracy of prediction that is equal to or greater than that of the conventional method and a higher sensitivity (Yamamoto et al., 2019).
17 chemicals had different results between ADRA (1 mM) and DPRA, and 12 chemicals had different results between ADRA (0.5 mg/mL) and DPRA. When the accuracy was calculated for these chemicals, the accuracy for ADRA (1 mM) was 35.3% (6/17) and that for ADRA (0.5 mg/mL) was 41.7% (5/12), which were slightly lower than DPRA. However, in a previous study, in which the predictive capacities of ADRA and DPRA for 82 chemicals were compared and used to establish the assay system of DPRA, the degrees of accuracy were found to be equivalent (Fujita et al., 2019b). These findings suggest that the accuracy of ADRA was slightly lower than that of DPRA, since the chemical dataset used contained several chemicals outside the applicability domain. For the “2 out of 3” approach, 8 chemicals had different results between ADRA (1 mM) and DPRA, and five chemicals had different results between ADRA (0.5 mg/mL) and DPRA. On the other hand, for the “3 out of 3” approach, one chemical had a different result between ADRA (1 mM) and DPRA, and two chemicals had different results between ADRA (0.5 mg/mL) and DPRA. From these results, it was found that the number of chemicals with different results was smaller when combining several test methods compared to that using test methods alone. Moreover, when excluding chemicals with negative results outside the applicability domain and penicillin G, which is considered to not react with cysteine and lysine, for the “2 out of 3” approach, only five chemicals were found to have different results between ADRA (1 mM) and DPRA, and one chemical had a different result between ADRA (0.5 mg/mL) and DPRA. Likewise, for the “3 out of 3” approach, no chemicals were found to have different results between DPRA and ADRA (1 mM) or ADRA (0.5 mg/mL). These findings indicate that the results did not differ greatly between ADRA and DPRA. In fact, the accuracy for the human data using the “2 out of 3” and “3 out of 3” approaches when excluding the above-mentioned chemicals was almost the same (Table 6). These findings demonstrate that ADRA is as applicable as DPRA in both the “2 out of 3” and “3 out of 3” approaches.
For STS, first, skin sensitization was evaluated based on the h-CLAT results, as shown in Fig. 1. Then, if the h-CLAT result was negative, the chemicals were classified as “weak” or “not-classified” according to the evaluation results of ADRA or DPRA. Therefore, the weight of ADRA or DPRA, which contributes to this approach, is lower than h-CLAT. Since 46 out 139 chemicals provided a negative result for h-CLAT, the chemicals reflecting the ADRA or DPRA results only account for about 30% of the total. In addition, since the category of “strong” was only classified by h-CLAT, the ADRA or DPRA results are not reflected. As described above, the prediction of skin sensitization by STS is largely based on the h-CLAT results, such that it can be considered that there was no significant difference in the prediction capacity (accuracy) when using ADRA or DPRA. Interestingly, however, when comparing the sensitivity and the specificity between using ADRA and DPRA, the degree of sensitivity was found to be somewhat higher when using DPRA and the specificity was slightly higher when using ADRA. ADRA provides slightly more false negatives than false positives. This is caused by the fact that its reactivity is lower than DPRA due to a decreased collision frequency between the test chemical and NAC or NAL, which is a direct result of the fact that the reaction concentration in ADRA is about 100 times lower than that of DPRA (Yamamoto et al., 2015).
As reported by Takenouchi et al. (2015), in ITS-SA (1), a sensitizer with a total score of 7 is considered “strong”. In this study, the sensitivity of a strong sensitizer in ADRA was found to be lower than that in DPRA, and the accuracy for the human data was also slightly lower. As mentioned above, the reactivity of ADRA fell overall due to low concentrations (about 1/100th that of DPRA), suggesting that ADRA had more chemicals with a low score in ITS-SA than DPRA. In fact, focusing on the score of each chemical using ADRA (1 mM), ADRA (0.5 mg/mL), and DPRA, the number of chemicals with the highest value of 3 was 28/139 for ADRA (1 mM), 39/139 for ADRA (0.5 mg/mL) and 46/139 for DPRA. Therefore, DPRA resulted in the greatest number of chemicals with the highest value. On the other hand, focusing on ITS-SA (2), where a sensitizer with a total score of 6 or more was considered “strong”, the sensitivity of a strong sensitizer using ADRA was over 20% higher than when using ITS-SA (1). Moreover, the accuracy for human data using ADRA (1 mM) was the same when using DPRA, and the accuracy using ADRA (0.5 mg/mL) was higher than that when using DPRA. It is likely that DPRA reacted excessively even for a moderate sensitizer due to the high concentration of reaction solution, and that the number of chemicals with the highest value of 3 increased. For this reason, the overprediction rate tended to be higher when total score 6 or more was considered “strong” in the case of combing DPRA. In contrast, since ADRA has a lower concentration of reaction solution than DPRA, it is considered that an excessive reaction did not occur with a moderate sensitizer, and that the overprediction rate was lower than that of DPRA.
The above findings suggest that ITS-SA using ADRA can accurately determine the degree of sensitization by considering a total score of 6 or more as “strong”. In addition, although ITS-SA (2) showed the same specificity as ITS-SA (1), the sensitivity of ITS-SA (2) for strong sensitizer was over 20% higher than that of ITS-SA (1), indicating that the former approach is the better method for detecting a greater number of strong sensitizers.
In ADRA and DPRA, when the prediction for sensitization potency of the 3-rank classification by each test method alone was performed, the accuracy decreased compared to when the test method consisted of combining several test methods, such as STS and ITS-SA. The single test method could also be classified to some extent as described above (Table 5-1 and Table 7-1). Therefore, we designed a novel ITS approach (ITS-2MA) to evaluate sensitization potency using a combination of two tests, using ADRA or DPRA with h-CLAT.
Regardless of whether ADRA or DPRA was used for the prediction of human data by ITS-2MA, the accuracy was about 3-4% higher than that of STS with a combination of the same two methods. The results were comparable to that of ITS-SA, which is a combination of the three methods (Table 5-4). In addition, the sensitivity denoted to a strong sensitizer by ITS-2MA was higher than that by ITS-SA (2), which was, as mentioned above, a high sensitivity. This result suggests that ITS-2MA is the superior approach in terms of the detection of a strong sensitizer. Therefore, it was demonstrated that the ITS-2MA approach designed in this study is as useful an approach as STS and ITS-SA.
A similar approach to the combined approach of two-test methods (e.g. STS) was reported by Kimura et al. (2018) where a IL-8 Luc assay was combined with DPRA. In this report, the predictive accuracy of these methods for a dataset of 143 chemicals was 87.3% for LLNA data. This result was almost the same as that obtained by STS and ITS-2MA for 124 chemicals, excluding any outside the applicability domain (Table 7-1, 7-2, 7-3, and 7-4). This also demonstrates that STS and ITS-2MA are highly useful.
In order to verify the usefulness of ADRA in IATA, five different approaches (“2 out of 3”, “3 out of 3”, ITS-SA, STS, and ITS-2MA) were used to compare the prediction accuracy of ADRA with that of DPRA. As a result, we confirmed that the prediction accuracy of ADRA is the same as that of DPRA in all approaches. In particular, in the prediction of sensitizing intensity, we confirmed that the prediction accuracy was slightly higher than that of DPRA when using ADRA (0.5 mg/mL) with a test chemical solution prepared in weight concentration. In addition, ITS-2MA, a novel approach developed in this study, was found to provide the same degree of prediction accuracy as the other approaches, suggesting that sufficient sensitization intensity prediction is possible even with a combination of two tests.
In conclusion, the results of this study demonstrate that ADRA is as useful as DPRA for IATA.
Table 7-1. Predictive capacity of ADRA and DPRA limited to chemicals that fall within the applicability domain.

Table 7-2. Predictive capacity of Sequential testing strategy (STS) approach limited to chemicals that fall within the applicability domain.
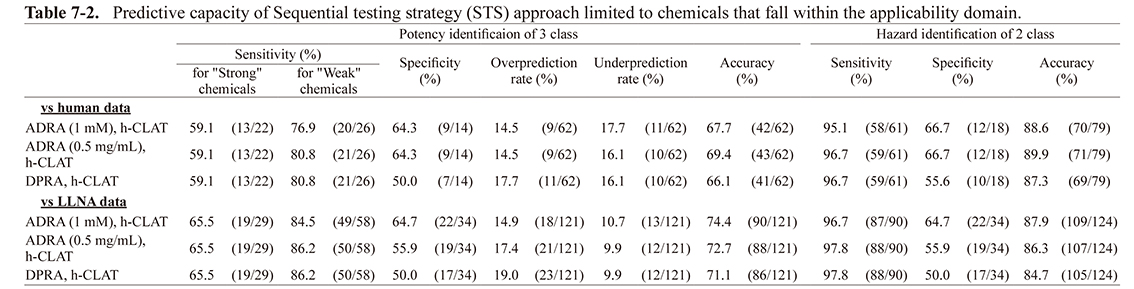
Table 7-3. Predictive capacity of Integrated testing strategy by scoring approach (ITS-SA) limited to chemicals that fall within the applicability domain.
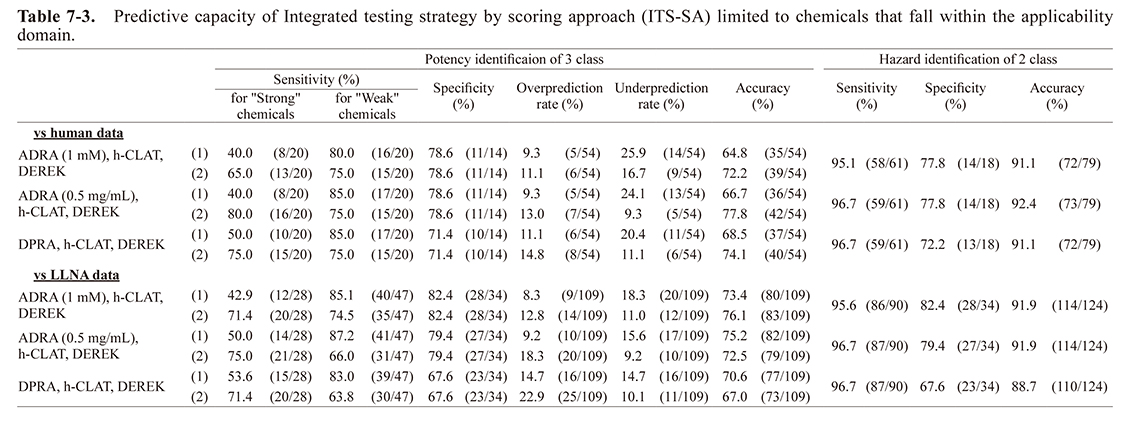
Table 7-4. Predictive capacity of Integrated testing strategy by 2 methods approach (ITS-2MA) limited to chemicals that fall within the applicability domain.
ACKNOWLEDGMENTS
We would like to extend our thanks to Ms. Maiko Takasaki for her technical assistance with the HPLC analysis.
Conflict of interest
The authors declare that there is no conflict of interest.
REFERENCES
- Basketter, D.A., Alépée, N., Ashikaga, T., Barroso, J., Gilmour, N., Goebel, C., Hibatallah, J., Hoffmann, S., Kern, P., Martinozzi-Teissier, S., Maxwell, G., Reisinger, K., Sakaguchi, H., Schepky, A., Tailhardat, M. and Templier, M. (2014): Categorization of chemicals according to their relative human skin sensitizing potency. Dermatitis, 25, 11-21.
- Casati, S., Aschberger, K., Asturiol, D., Basketter, D.A., Dimitrov, S., Dumont, C., Karlberg, A.T., Lepoittevin, J.P., Patlewicz, G., Roberts, D. and Worth, A. (2016): Ability of non-animal methods for skin sensitisation to detect pre- and pro-haptens: Report and recommendations of an EURL ECVAM expert meeting. Publications Office of the European Union.
- Dao, H. Jr., Fricker, C. and Nedorost, S.T. (2012): Sensitization prevalence for benzalkonium chloride and benzethonium chloride. Dermatitis, 23, 162-166.
- Fujita, M., Yamamoto, Y., Tahara, H., Kasahara, T., Jimbo, Y. and Hioki, T. (2014): Development of a prediction method for skin sensitization using novel cysteine and lysine derivatives. J. Pharmacol. Toxicol. Methods, 70, 94-105.
- Fujita, M., Yamamoto, Y., Wanibuchi, S., Katsuoka, Y. and Kasahara, T. (2019a): The underlying factors that explain why nucleophilic reagents rarely co-elute with test chemicals in the ADRA. J. Pharmacol. Toxicol. Methods, 96, 95-105.
- Fujita, M., Yamamoto, Y., Watanabe, S., Sugawara, T., Wakabayashi, K., Tahara, Y., Horie, N., Fujimoto, K., Kusakari, K., Kurokawa, Y., Kawakami, T., Kojima, K., Kojima, H., Ono, A., Katsuoka, Y., Tanabe, H., Yokoyama, H. and Kasahara, T. (2019b): Cause of and countermeasures for oxidation of the cysteine-derived reagent used in the amino acid derivative reactivity assay. J. Appl. Toxicol., 39, 191-208.
- Fujita, M., Yamamoto, Y., Wanibuchi, S., Katsuoka, Y. and Kasahara, T. (2019c): A newly developed means of HPLC-fluorescence analysis for predicting the skin sensitization potential of multi-constituent substances using ADRA. Toxicol. In Vitro, 59, 161-178.
- Ghuysen, J.M. (1991): Serine beta-lactamases and penicillin-binding proteins. Annu. Rev. Microbiol., 45, 37-67.
- Karlberg, A.T., Shao, L.P., Nilsson, U., Gäfvert, E. and Nilsson, J.L. (1994): Hydroperoxides in oxidized d-limonene identified as potent contact allergens. Arch. Dermatol. Res., 286, 97-103.
- Kimura, Y., Watanabe, M., Suzuki, N., Iwaki, T., Yamakage, K., Saito, K., Nakajima, Y., Fujimura, C., Ohmiya, Y., Omori, T., Kojima, H. and Aiba, S. (2018): The performance of an in vitro skin sensitisation test, IL-8 Luc assay (OECD442E), and the integrated approach with direct peptide reactive assay (DPRA). J. Toxicol. Sci., 43, 741-749.
- Ministry of Health. Labor and Welfare, Syokuseiyakushinhatsu (2018): 0111 https://www.pmda.go.jp/files/000222425.pdf
- Nukada, Y., Miyazawa, M., Kazutoshi, S., Sakaguchi, H. and Nishiyama, N. (2013): Data integration of non-animal tests for the development of a test battery to predict the skin sensitizing potential and potency of chemicals. Toxicol. In Vitro, 27, 609-618.
- OECD. (2010): OECD Guideline for the Testing of Chemicals No. 429. The Local Lymph Node Assay (LLNA), Organisation for Economic Cooperation and Development, Paris. Available at: http://www.oecd.org/env/testguidelines
- OECD. (2015): OECD Guideline for the Testing of Chemicals No. 442C. Direct Peptide Reactivity Assay (DPRA), Organisation for Economic Cooperation and Development, Paris. Available at: http://www.oecd.org/env/testguidelines
- OECD. (2016): Series on Testing & Assessment No. 255. Guidance Documenton the reportingof Defined Approaches to be used within Integrated Approachesto Testing and Assessment. http://www.oecd.org/officialdocuments/publicdisplaydocumentpdf/?cote=env/jm/mono(2016)28&doclanguage=en
- OECD. (2018): OECD Key event based test Guideline No. 442D. In vitro Skin Sensitisation Assays Addressing AOP Key Event on Keratinocyte Activation. Organisation for Economic Cooperation and Development, Paris. Available at: http://www.oecd.org/env/testguidelines
- OECD. (2018): OECD Key event based test Guideline No. 442E. In vitro Skin Sensitization Assays Addressing AOP Key Event of Activation of Dendritic Cells on the Adverse Outcome Pathway for Skin Sensitisation. Organisation for Economic Cooperation and Development, Paris. Available at: http://www.oecd.org/env/testguidelines
- Takenouchi, O., Miyazawa, M., Saito, K., Ashikaga, T. and Sakaguchi, H. (2013): Predictive performance of the human Cell Line Activation Test (h-CLAT) for lipophilic chemicals with high octanol-water partition coefficients. J. Toxicol. Sci., 38, 599-609.
- Takenouchi, O., Fukui, S., Okamoto, K., Kurotani, S., Imai, N., Fujishiro, M., Kyotani, D., Kato, Y., Kasahara, T., Fujita, M., Toyoda, A., Sekiya, D., Watanabe, S., Seto, H., Hirota, M., Ashikaga, T. and Miyazawa, M. (2015): Test battery with the human cell line activation test, direct peptide reactivity assay and DEREK based on a 139 chemical data set for predicting skin sensitizing potential and potency of chemicals. J. Appl. Toxicol., 35, 1318-1332.
- Troutman, J.A., Foertsch, L.M., Kern, P.S., Dai, H.J., Quijano, M., Dobson, R.L., Lalko, J.F., Lepoittevin, J.P. and Gerberick, G.F. (2011): The incorporation of lysine into the peroxidase peptide reactivity assay for skin sensitization assessments. Toxicol. Sci., 122, 422-436.
- Urbisch, D., Mehling, A., Guth, K., Ramirez, T., Honarvar, N., Kolle, S., Landsiedel, R., Jaworska, J., Kern, P.S., Gerberick, F., Natsch, A., Emter, R., Ashikaga, T., Miyazawa, M. and Sakaguchi, H. (2015): Assessing skin sensitization hazard in mice and men using non-animal test methods. Regul. Toxicol. Pharmacol., 71, 337-351.
- Wilhelm, K.P., Zhai, H. and Maibach, H.I. (2007): Dermatotoxicology, CRC Press. New York.
- Yamamoto, Y., Tahara, H., Usami, R., Kasahara, T., Jimbo, Y., Hioki, T. and Fujita, M. (2015): A novel in chemico method to detect skin sensitizers in highly diluted reaction conditions. J. Appl. Toxicol., 35, 1348-1360.
- Yamamoto, Y., Fujita, M., Wanibuchi, S., Katsuoka, Y., Ono, A. and Kasahara, T. (2019): Expanding the applicability of the amino acid derivative reactivity assay: determining a weight for preparation of test chemical solutions that yield a predictive capacity identical to the conventional method using molar concentration and demonstrating the capacity to detect sensitizers in liquid mixtures. J. Pharmacol. Toxicol. Methods, 97, 67-79.
;%0A%09%09%09newWindow.document.open();%0A%09%09%09newWindow.document.write('<img src=%22./Graphics/44_585-t1.jpg%22>');%0A%09%09%09newWindow.document.close();%0A%09%09)
;%0A%09%09%09newWindow.document.open();%0A%09%09%09newWindow.document.write('<img src=%22./Graphics/44_585-t2.jpg%22>');%0A%09%09%09newWindow.document.close();%0A%09%09)
;%0A%09%09%09newWindow.document.open();%0A%09%09%09newWindow.document.write('<img src=%22./Graphics/44_585-t3_1.jpg%22>');%0A%09%09%09newWindow.document.close();%0A%09%09)
;%0A%09%09%09newWindow.document.open();%0A%09%09%09newWindow.document.write('<img src=%22./Graphics/44_585-t3_2.jpg%22>');%0A%09%09%09newWindow.document.close();%0A%09%09)
;%0A%09%09%09newWindow.document.open();%0A%09%09%09newWindow.document.write('<img src=%22./Graphics/44_585-t4_1.jpg%22>');%0A%09%09%09newWindow.document.close();%0A%09%09)
;%0A%09%09%09newWindow.document.open();%0A%09%09%09newWindow.document.write('<img src=%22./Graphics/44_585-t4_2.jpg%22>');%0A%09%09%09newWindow.document.close();%0A%09%09)
;%0A%09%09%09newWindow.document.open();%0A%09%09%09newWindow.document.write('<img src=%22./Graphics/44_585-t5_1.jpg%22>');%0A%09%09%09newWindow.document.close();%0A%09%09)
;%0A%09%09%09newWindow.document.open();%0A%09%09%09newWindow.document.write('<img src=%22./Graphics/44_585-t5_2.jpg%22>');%0A%09%09%09newWindow.document.close();%0A%09%09)
;%0A%09%09%09newWindow.document.open();%0A%09%09%09newWindow.document.write('<img src=%22./Graphics/44_585-t5_3.jpg%22>');%0A%09%09%09newWindow.document.close();%0A%09%09)
;%0A%09%09%09newWindow.document.open();%0A%09%09%09newWindow.document.write('<img src=%22./Graphics/44_585-t5_4.jpg%22>');%0A%09%09%09newWindow.document.close();%0A%09%09)
;%0A%09%09%09newWindow.document.open();%0A%09%09%09newWindow.document.write('<img src=%22./Graphics/44_585-t6.jpg%22>');%0A%09%09%09newWindow.document.close();%0A%09%09)
;%0A%09%09%09newWindow.document.open();%0A%09%09%09newWindow.document.write('<img src=%22./Graphics/44_585-t7_1.jpg%22>');%0A%09%09%09newWindow.document.close();%0A%09%09)
;%0A%09%09%09newWindow.document.open();%0A%09%09%09newWindow.document.write('<img src=%22./Graphics/44_585-t7_2.jpg%22>');%0A%09%09%09newWindow.document.close();%0A%09%09)
;%0A%09%09%09newWindow.document.open();%0A%09%09%09newWindow.document.write('<img src=%22./Graphics/44_585-t7_3.jpg%22>');%0A%09%09%09newWindow.document.close();%0A%09%09)
;%0A%09%09%09newWindow.document.open();%0A%09%09%09newWindow.document.write('<img src=%22./Graphics/44_585-t7_4.jpg%22>');%0A%09%09%09newWindow.document.close();%0A%09%09)