Abstract
We aimed to investigate the role of programmed cell death protein 1 (PD-1) and T lymphocytes in the proliferation, apoptosis and secretion of cells from patients and mice with Graves’ disease (GD). The levels of serum hormones, related antibodies and inflammatory cytokines in GD patients were determined by electrochemiluminescence immunoassay and ELISA. The percentages of CD4 and CD8 T-lymphocytes and PD-1 expression were examined by flow cytometry. A GD mouse model, a thyroid follicular epithelial cell, and a CD4+PD-1+, CD4+PD-1- and CD8+PD-1+, CD8+PD-1- T lymphocyte co-culture system were constructed. The viability, apoptosis-related markers, serum hormones, related antibodies and inflammatory cytokines in thyroid follicular epithelial cells were determined by CCK-8, Western blot, qTR-PCR, electrochemiluminescence immunoassay and ELISA. Elevated free thyroid hormones (FT3, FT4), thyroid hormone antibodies (TRAb, TPOAb and TGAb), inflammatory cytokines, and inhibited TSH were observed in GD patients. The percentage of CD4+ T cells was increased, while that of CD8+ T cells was reduced in GD patients. PD-1 expression level was lifted in both CD4+ and CD8+ cells from GD patients. In mouse thyroid follicular epithelial cells co-cultured with CD4+PD-1+ and CD8+PD-1+ T lymphocytes, the cell viability, TH and TRAb levels and inflammatory cytokines level were the highest, while the TSH level and apoptosis were the lowest. PD-1 positive T lymphocytes were able to promote viability and inhibit apoptosis of thyroid follicular epithelial cells, which further caused a more accelerated development of GD.
INTRODUCTION
Graves’ disease (GD) is an autoimmune disorder with incompletely understood pathogenesis that occurs mainly in the thyroid. Its clinical manifestations are not limited to the thyroid gland, with an accompanying multi-system syndrome, including high metabolic syndrome, diffuse goiter, eye signs, skin lesions, and thyroid extremity (Cox et al., 2016). As the most common autoimmune disease around the world, the incidence of GD was 0.00014% in 2012 (McLeod and Cooper, 2012). Microscopically, thyroid epithelial cell hyperplasia is the salient criterion of GD diagnosis (DeGroot, 2000). The credible mechanism of pathogenesis is that anti-TSH receptor autoantibodies (TRAbs) promote thyroid epithelial cell (TEC) growth and unrestricted thyroid hormone T3 and T4 secretion by TSH mimics (Saxena et al., 2016). A sharp increase in the secretion of adrenocortical hormone under high stress or by other reasons can change the suppressor T lymphocytes (Ts) or helper T lymphocytes (Th), causing excessive excitement or depression that leads to excessive secretion of thyroid hormone. Helper T lymphocytes (Th) enhance the immune response. The abnormality of the immune system was also appreciated as one of the factors (Khoo and Bahn, 2007). Thyroid stimulating hormone receptor (TSHR) was regarded as an important mediator both in the initiation and progression of GD.
As the most frequently used immunotherapy, programmed cell death protein 1 (PD-1) inhibitor was able to activate T lymphocytes, so as to further suppress the malignant tumor cells by the human immune system (Jin et al., 2011; Feng et al., 2017). Obtained from apoptotic mouse T cell hybridoma originally, PD-1 is the crucial immunosuppressive molecule and a member of CD28 super family (Dai et al., 2014). Programmed cell death-Ligand 1 (PD-L1) is the first type of trans-membrane protein with the molecular weight of 40 kDa, and the PD-1/PD-L1 pathway was recognized as modifies in inducing peripheral tolerance so as to prevent autoimmune attack (Jin et al., 2011). The immune regulation which sets PD-1 as the target is of great significance in anti-tumor, anti-infection, anti-inflammatory, and anti-autoimmune diseases and to the survival possibility of organ transplantation (Zamani et al., 2016; Collins et al., 2017; Prado-Garcia et al., 2017). PD-L1 can also be used as the target in the treatment of the above diseases.
The activation of T lymphocytes needed double signals. The first signal derived from the combination of MHC presenting antigen and TCR-CD3, while the second signals were separated into a co-stimulatory signal and a co-suppression signal, which drove positive and negative adjustment functions respectively (Louis-Dit-Sully et al., 2014; Josephs et al., 2017). PD-1 receptor is expressed in the membranes of T lymphocytes and primary B lymphocytes, and plays a critical role in the differentiation and apoptosis of these cells.
Based on the previous research basis, we speculate that PD-1/PD-L1 may play an important immune regulatory role in regulating the pathogenesis of GD, and therefore, in the present study, we collected peripheral blood from patients with GD to detect thyroid function and thyroid-related antibodies, as well as PD-1 expression on the surface of lymphocytes. In addition, the effect of PD-1/PD-L1 on the growth of thyroid follicular epithelial cells was explored through in vitro cell co-culture experiments, and through establishing the GD model in vivo experiment further confirmed the role of PD-1/PD-L1. The PD-1 expression level was detected in GD patients, and its effects on proliferation, apoptosis and inflammatory cytokines secretion of thyroid follicular epithelial cells in the lymphocyte co-culture system were investigated.
MATERIALS AND METHODS
Human Subjects
Blood was obtained from 12 patients who suffered from Graves’ disease and were diagnosed in Affiliated Hangzhou First People’s Hospital from 05/2017 to 06/2018, and the same amount of blood samples were obtained from 12 healthy donors (Table 1). The average age of the patients was 41.1, including 7 women and 5 men. The average age of the donors was 41, including 6 women and 6 men. Before the sample collection, the patients and healthy donors were forbidden to fast for the whole night. The samples were divided into three groups, of which one was stored in tubes containing EDTA anticoagulant for the preparation of peripheral blood mononuclear cells (PBMCs) collection, one was centrifuged at 2500 xg for 15 min to obtain the serum, and the other was stored directly as peripheral blood. All the samples were conserved in 4°C refrigerator. All patients had signed informed consent forms with the agreement to allow clinical research on their blood. The clinical trial program had been reviewed and approved by the Ethics Committee of Affiliated Hangzhou First People’s Hospital (NA201705527). Hyperthyroidism was diagnosed based on clinical manifestations and laboratory tests (FT3 and FT4 levels were elevated while TSH level was decreased), while GD was diagnosed on the basis that TRAb was positive. In this study TRAb> 1.5 IU/L indicated positive (Pyzik et al., 2017).
Table 1. Clinical data at the moment of diagnosis of GD patients.
| Sample |
Sex |
Age |
Condition |
FT3 |
FT4 |
TSH |
TRAb |
TPOAb |
TgAb |
| pmol/L |
pmol/L |
mIU/L |
IU/L |
IU/L |
IU/mL |
| 1 |
F |
27 |
untreated |
16.18 |
51.20 |
<0.008 |
10.91 |
266.52 |
486.56 |
| 2 |
F |
31 |
in remission |
17.36 |
35.13 |
0.012 |
10.58 |
323.69 |
497.23 |
| 3 |
M |
43 |
under medication |
17.04 |
39.70 |
<0.008 |
10.93 |
328.87 |
432.71 |
| 4 |
F |
42 |
under medication |
16.92 |
36.44 |
<0.008 |
9.41 |
264.44 |
381.12 |
| 5 |
F |
35 |
untreated |
14.90 |
47.74 |
<0.008 |
10.69 |
294.16 |
518.16 |
| 6 |
F |
62 |
untreated |
15.02 |
39.66 |
<0.008 |
9.85 |
304.99 |
530.23 |
| 7 |
M |
47 |
under medication |
16.98 |
51.64 |
<0.008 |
10.58 |
298.18 |
442.29 |
| 8 |
M |
45 |
untreated |
19.62 |
42.73 |
<0.008 |
10.07 |
295.66 |
501.60 |
| 9 |
M |
52 |
under medication |
17.16 |
44.13 |
0.012 |
11.69 |
315.66 |
464.63 |
| 10 |
M |
48 |
in remission |
16.98 |
49.13 |
<0.008 |
12.43 |
296.65 |
584.90 |
| 11 |
F |
25 |
untreated |
16.95 |
41.82 |
<0.008 |
12.09 |
287.05 |
455.05 |
| 12 |
F |
37 |
untreated |
15.84 |
46.98 |
<0.008 |
10.62 |
305.16 |
463.13 |
Electrochemiluminescence immunoassay
The levels of FT3, FT4, TRAb, TPDAb and TgAb in T lymphocytes from peripheral blood from both GD patients and healthy donors, together with the levels of thyroid hormones (TH), TSH and TRAb in the serum of normal human thyroid cells co-cultured with lymphocyte cells, were examined by electrochemiluminescence immunoassay under the manufacturer’s protocol. The examination was performed using an automatic electrochemiluminescence immunoassay analyzer and supporting reagents (Cobas E601, Roche, Basel, Switzerland).
Cytokines and LDH detection
The levels of cytokines in serum and cell culture medium were examined by ELISA using a microplate reader (GX71, Olympus, Tokyo, Japan). The IFN-γ (PI511 for human /PI508 for mouse), IL-4 (PI618 for human /PI612 for mouse), IL-17 (PI550 for human /PI545 for mouse) and TGF-β (PT880 for human /PT878 for mouse) ELISA kits were obtained from Beyotime, Shanghai, China. All operations were performed according to the manufacturer’s instructions. The content of LDH in the mouse thyroid follicular epithelial cells supernatant was detected by the LDH kit (C0016, Beyotime).
Isolation of PBMCs
The peripheral blood from patients and donors was equally diluted using 0.9% calcium (Ca+) and magnesium (Mg+) ions PBS buffer (Biochrome AG, Cambridge, Germany), then covered over with a 3 mL Gradisol L preparation (Aqua Medica, Brussels, Poland), and centrifuged at 700 xg for 20 min using density gradient. A sterilized pipette was used for PBMCs collection, and Ca+ and Mg+ free PBS buffer was used for rinsing. Then the cells were suspended in the same 1 mL PBS buffer as described above and stored in 4°C refrigerator until use.
Flow cytometry assay
The obtained cell suspension from the peripheral blood was distributed into a tube with the number of 1 × 10⁶ cells and cultured at room temperature with monoclonal antibodies (20 μL) and fluorochrome for 20 min. Table 2 lists the antibodies used to determine the PD-1 statuses of lymphocytes T CD4+, CD8+ cells and their isotype controls. Afterwards, the cells were rinsed and centrifuged at 700 xg for 5 min, and sorted by FACS Calibur flow cytometer (Becton Dickinson, New York, NJ, USA). FACS Diva Software 6.13 (BD) was applied for data collection, and CellQuest Pro Software (Becton Dickinson) was used for data analysis.
Table 2. The list of antibodies used to examined PD-1 status of lymphocytes T CD4
+, CD8
+ cells.
| Antibody |
Fluorochrome |
Name |
Catalog number |
| Anti-CD4 |
FITC |
Mouse Anti-Human CD4 Clone RPA-T4 (RUO) |
555346
BD Biosciences, USA |
| Anti-CD8 |
FITC |
Mouse Anti-Human CD8 Clone HIT8a (RUO) |
555634
BD Biosciences, USA |
| Anti-PD1 |
PE |
Mouse Anti-Human CD279 Clone MIH4 (RUO) |
557946
BD Biosciences, USA |
| Isotype control |
FITC |
FITC Mouse IgG1, κ Isotype Control Clone MOPC-21 |
555748
BD Biosciences, USA |
| Isotype control |
PE |
PE Mouse IgG1, k Isotype Control Clone MOPC-21 (RUO) |
555749
BD Biosciences, USA |
Animal model of Grave’s disease (Yuan et al., 2017)
A total of 27 BALB/c 6-week-old mice were purchased from Model Animal Research Center of Naniing University (Nanjing, China). A recombinant adenovirus expressing TSHR289 (Genepharma, Shanghai, China) was constructed and immunized. All mice were injected intramuscularly with (im) 100 μL of phosphate buffered saline (PBS) (n = 9) and 100 μL of PBS containing 5.62 × 10⁷ PFU/mL Ad-TSHR289 (n = 9) or Ad-Control (n = 9). A total of 3 injections were given at an interval of 3 weeks. Blood, spleen and thyroid tissues were obtained for further testing three weeks after the last injection. The animal experiments were approved by the Affiliated Hangzhou First People’s Hospital Animal Ethics Committee (approval number: 201706017), performed at the Affiliated Hangzhou First People’s Hospital SPF Grade Experimental Animal Center.
Primary culture of mouse thyroid follicular epithelial cells
Mice of the model group were euthanized, and bilateral thyroid tissues were isolated aseptically. Thyroid tissues on each side were cut into pieces and collected into 1.5 mL Eppendorf tubes. After the serum-free medium was blown twice, digestive enzymes were added to each tube, and the cells were digested with shaking at 37°C for 40 min, and then centrifuged at 800 xg for 10 min. The digestive enzymes in the supernatant were then discarded, and 1 mL of F-12 complete medium (D6421, Sigma-Aldrich, Frankfurt, Germany) containing 10% FCS (B7447, Sigma-Aldrich), 5 μg/L hydrocortisone, 5 mg/L transferrin, 10 mg/L insulin, 0.3 g/L L-glutamine, 1 × 10⁵ U/L penicillin, and 100 mg/L streptomycin were added (Jeker et al., 1999). A dropper was used to gently blow the cells repeatedly, and the centrifuge pellet was resuspended until the tissue block was barely visible to the naked eye. The cell suspension was seeded on a 24-well cell culture plate. Some of the wells were pre-filled with glass coverslips for immunocytochemical detection, and cultured in a 5% CO2 incubator at 37°C. The cell culture medium was changed every 3 days. The cell morphology and growth were observed with an inverted microscope (GX53, Olympus) every day, with pictures taken to record the observation results.
T lymphocytes and thyroid follicular epithelial cells co-culture system
The PD-1 antibody for mouse (MABF556), CD4 (F1773), and CD8 (SAB4700087) used in flow cytometry were purchased from Sigma-Aldrich. Four groups of T lymphocytes (CD4+PD-1++CD8+PD-1+; CD4+PD-1-+CD8+PD-1+; CD4+PD-1+ +CD8+PD-1-; CD4+PD-1- + CD8+PD-1-) in PBMC from model mice were sorted using flow cytometry as described previously. Thyroid follicular epithelial cells were inoculated on 48-well culture plates and placed at 37°C for 2-4 hr with the conventional culture method. The four groups of T lymphocytes (1 × 10⁴ cells/well) and thyroid follicular epithelial cells (1 × 10⁴ cells/well) were then seeded into the corresponding cell culture wells and shaken well. After the cells were continuously cultured for 12 hr, 24 hr, and 48 hr respectively, the thyroid follicular epithelial cells were collected for further experiments.
Immunocytochemistry assay
Tg expression was detected by immunocytochemistry. Cell-covered coverslips were removed from culture plates on day 10. The cells were fixed with 4% neutral paraformaldehyde for 6 hr, and then immersed in PBS for 2 hr. The cells were stained with Tg (ab156008, Abcam, Cambridge, UK) according to the conventional ABC method. PBS was used as a negative control instead of the primary antibody. A known positive tissue slice was used as a positive control. Under the instructions of the reagent, DAB was developed for 10 min, and the nuclei were counterstained by hematoxylin.
CCK-8 assay
Mouse thyroid follicular epithelial cells were cultured and passaged normally, and sorted CD4+PD-1+, CD4+PD-1- and CD8+PD-1+, CD8+PD-1- T cells were added for co-culture. Thyroid follicular epithelial cells were collected for cell viability testing. The thyroid follicular epithelial cells with the volume of 5 × 10³ were cultured in a 96-well culture plate. After 12 hr, 24 hr, and 48 hr respectively, the cell viability was examined with Cell Counting Kit-8 (Beyotime) following the manufacturer’s recommendations, and measurement was performed at 450 nm using Elx800 Reader (Bio-Tek Instruments Inc., Vermont, VT, USA).
Quantitative Real-time PCR
The total RNA of Bcl-2, p53 and cleaved caspase-3 were collected from mouse thyroid follicular epithelial cells co-cultured with lymphocytes, and rapidly reverse transcribed into cDNA with RevertAid First Strand cDNA Synthesis Kit (ThermoFisher Scientific, Waltham, MA, USA). Then the PCR process was conducted using StepOnePlus Real-Time PCR system (Applied Biosystems, Carlsbad, CA, USA). All the data were normalized with 2-ΔΔCT method, with α-tubulin functioning as the internal reference. The primer sequences in the present study are presented in Table 3.
Table 3. The primers sequences used for qRCR.
| primer |
Sequence(5 ́-3 ́) |
| Bcl-2-P |
forward |
ACGGTGGTGGAGGAACTCTTCAG |
| reverse |
GGTGTGCAGATGCCGGTTCAG |
| P53-P |
forward |
AGAGACCGCCGTACAGAAGA |
| reverse |
GCATGGGCATCCTTTAACTC |
| α-tubulin |
forward |
TATCGAGCGCCCAACCTACACT |
| reverse |
CCTCACCCTCTCCTTCAACAGAATC |
| Bcl-2-M |
forward |
GCTACCGTCGTGACTTCGC |
| reverse |
CCCCACCGAACTCAAAGAAGG |
| P53-M |
forward |
CCCCTGTCATCTTTTGTCCCT |
| reverse |
AGCTGGCAGAATAGCTTATTGAG |
Western blot
The protein expression levels of Bcl-2, p53 and cleaved capase-3 in mouse thyroid follicular epithelial cells were also determined by Western blot. The cells were lysed in RIPA buffer (Beyotime). We used BCA Assay Kit (QPBCA-1KT, Sigma-Aldrich, New York, USA) to extract the total protein and determine its level. Subsequently, the protein was separated by 10% SDS-PAGE and transferred onto PVDF membrane (Millipore, Billerica, MA, USA), and then kept still for an hour at room temperature blocked with skimmed milk powder. Afterwards, the membrane was incubated with primary antibodies, including Bcl-2 (ab59348, Abcam), p53 (ab26, Abcam), cleaved caspase 3 (ab2302, Abcam) and α-tubulin (ab7291, Abcam), for a whole night at 4°C, followed by the 2-hr incubation with the secondary antibodies (anti-rabbit IgG (ab6721, Abcam) and anti-mouse IgG (ab6728, Abcam) at room temperature. After washing, the membrane was stained by ECL reagents (Cell Signaling, Boston, MA, USA), and measured by Amersham Imager 600 (GE Healthcare Life Sciences, Beijing, China). Data analysis was performed using ImageJ software (National Institutes of Health, Bethesda, MD, USA).
Statistical analysis
The data are presented as means ± standard deviation, and SPSS 16.0 was used for data analysis. Student’s t-test was used for comparing the difference between the two groups, and one-way ANOVA for multiple comparisons. The three experiments were conducted under the same conditions, and P < 0.05 was recognized as statistically different.
RESULTS
The levels of thyroid hormones, thyroid-associate antibody and inflammatory cytokines in GD patients
The levels of FT3, FT4, TRAb, TPOAb, TgAb in serum from GD patients were significantly higher than those from healthy donors (P < 0.001). On the contrary, TSH level in GD patients was significantly lower than that in healthy individuals (P < 0.001, Fig. 1A-1F). The ELISA assay also presented that the levels of all the inflammatory-associated cytokines in GD patients (IFN-γ, IL-4, IL-17 and TGF-β) were significantly elevated (P < 0.05, Fig. 1G-1J).
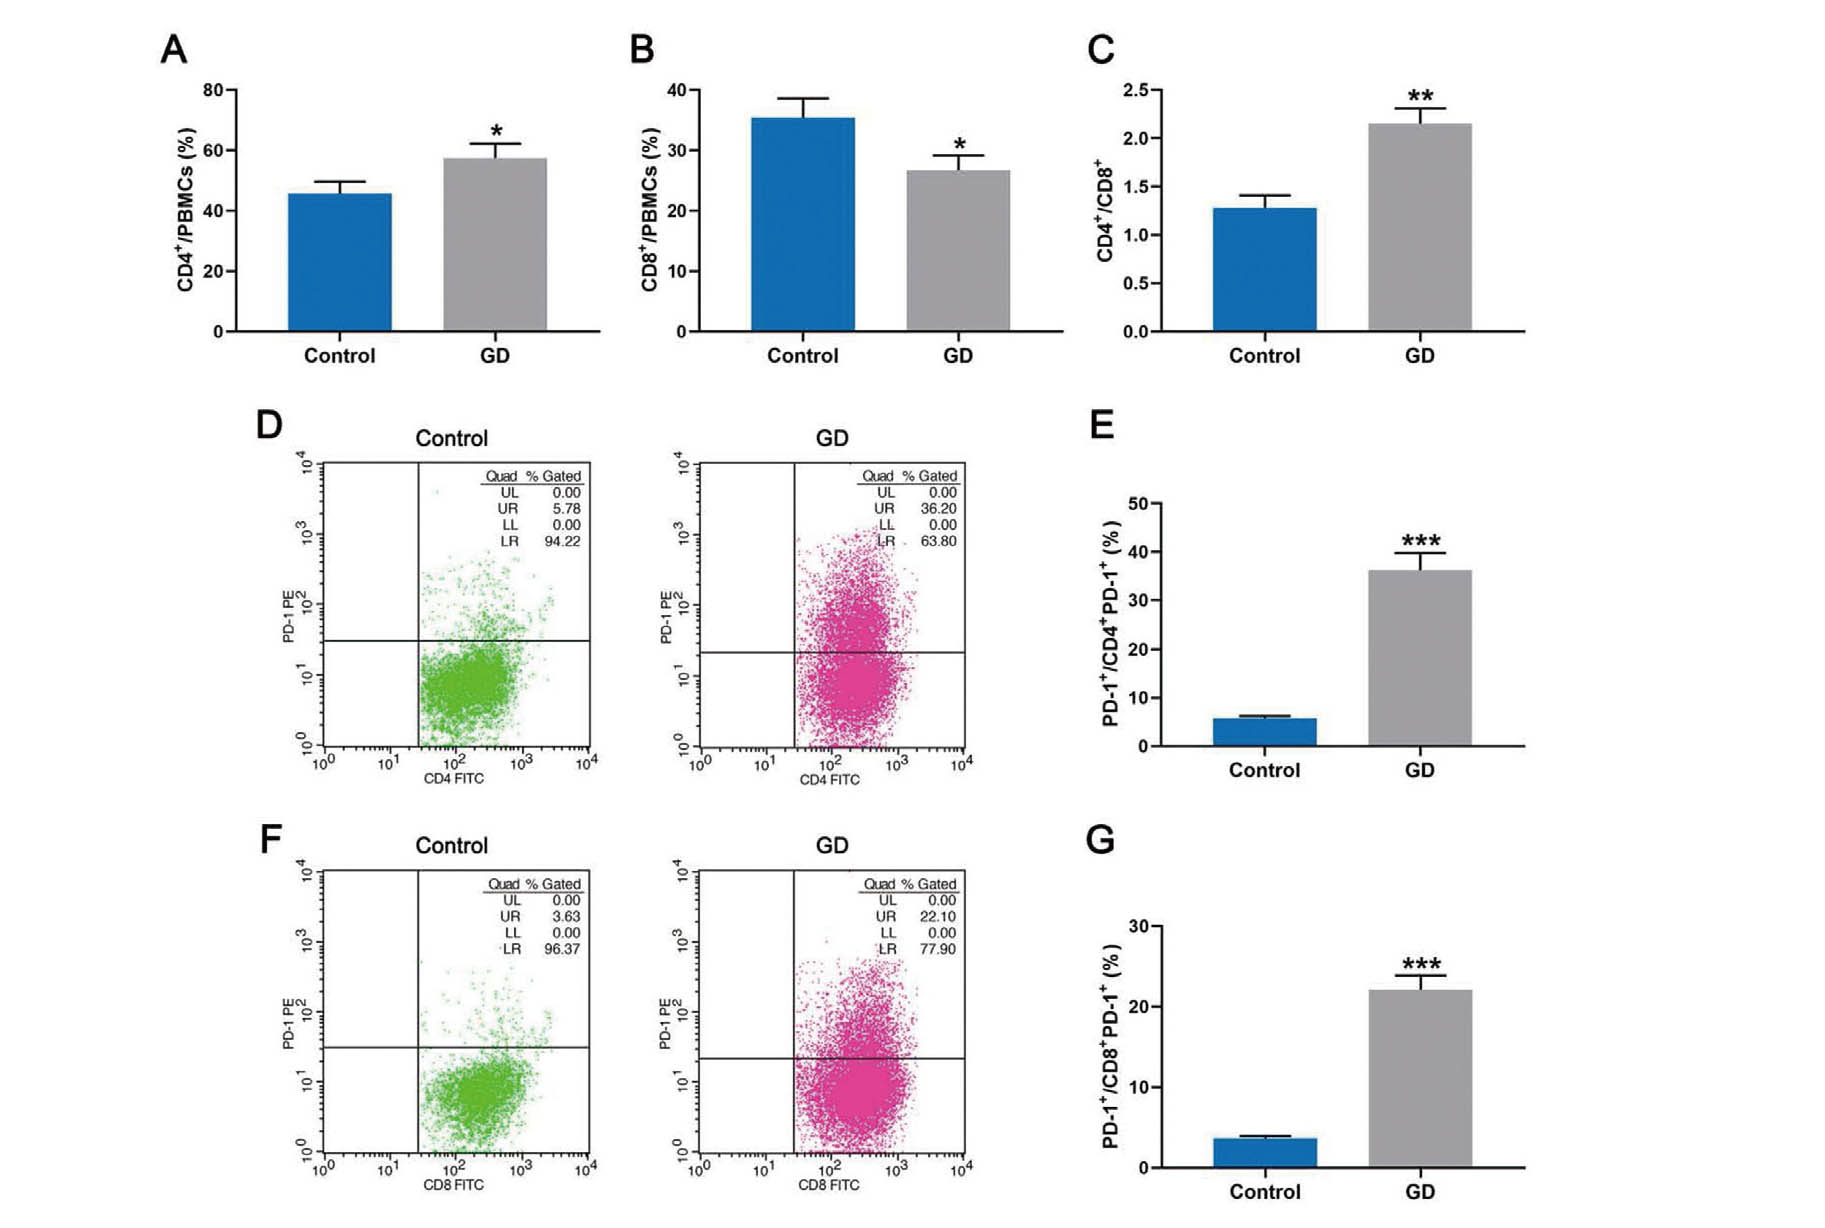
Elevated CD4+ and decreased CD8+ T lymphocytes levels with increased PD-1 level in GD patients
The percentages of CD4+ and CD8+ T cells in PBMCs from both GD patients and healthy donors were examined. An increasing amount of CD4+ T cells were detected while the amount of CD8+ T cells was reduced. The ratio of CD4+ to CD8+ in GD patients was elevated compared to that of healthy individuals (Fig. 2A-2C). In the meanwhile, the flow cytometry also detected the PD-1 level in both CD4+ and CD8+ T cells from GD patients, and a significant increase of PD-1 level was observed in both cells (Fig. 2D-2G).
PD-1+ T lymphocytes promoted proliferation and inhibited apoptosis in co-cultured mouse thyroid follicular epithelial cells
Mouse thyroid follicular epithelial cells were co-cultured with selected CD4+PD-1+, CD4+PD-1-, CD8+PD-1+, CD8+PD-1- T lymphocytes, and the cell morphology, surface marker, cell viability and apoptosis, as well as the expression of its related cytokines, were detected. We performed a morphological identification of mouse thyroid primary cells using an inverted microscope, and observed adherent cell growth and epithelioid and polygonal cells (Fig. 3A). At the same time, staining of the specific antigen Tg was performed on the thyroid cells on the 10th day of culture. Brown positive staining was observed in the cell cytoplasm. Both secondary follicular-like structures surrounded by positive cells and scattered positive cells were visible (Fig. 3B). Cell viability was significantly enhanced when PD-1 existed on both CD4+ and CD8+ lymphocytes; when PD-1 existed either on CD4+ or CD8+ cells, the viability of lymphoid follicles was still significantly higher than that of the cells without PD-1 (Fig. 3C). The LDH level associated with cytotoxicity demonstrated that the existence of PD-1 on both CD4+ and CD8+ cells led to the lowest cytotoxicity in co-cultured lymphoid follicles cells, and that its existence in only one kind of T lymphocytes (either CD4+ or CD8+ cells) led to the highest cytotoxicity in lymphoid follicles cells co-incubated with CD4+PD-1-+CD8+PD-1- T lymphocytes presented (Fig. 3D). In the subsequent apoptosis associated with the determination of cytokines, the group of CD4+PD-1++CD8+PD-1+ presented the highest Bcl-2 expression level, while the expression levels of p53 and cleaved caspase-3 were the lowest. In contrast, the group of CD4+PD-1++CD8+PD-1+ showed the completely opposite results, which further verified the above ELISA experiment (Fig. 4).


The existence of PD-1 on both CD4+ and CD8+ cells significantly elevated the expression levels of TH and TRAb and inhibited the TSH level in co-cultured mouse thyroid follicular epithelial cells. When PD-1 only existed in one kind of T lymphocytes, its effect on the membrane of T lymphocytes in co-cultured mouse thyroid follicular epithelial cells was decreased (Fig. 5A-5C). A similar trend occurred in the detection of inflammatory factors: the group of CD4+PD-1++CD8+PD-1- showed the highest expression levels of IFN-γ, IL-4, IL-17 and TGF-β in co-cultured mouse thyroid follicular epithelial cells; when PD-1 was absent in neither kind of T lymphocytes, the co-cultured mouse thyroid follicular epithelial cells showed the lowest expression levels of IFN-γ, IL-4, IL-17 and TGF-β (Fig. 5D-5G).
DISCUSSION
The present study firstly demonstrated the elevated levels of FT3, FT4, TRAb, TPOAb and TgAb, together with an inhibited TSH level in patients at GD diagnosis. FT3 and FT 4 levels are the most sensitive indicators for the diagnosis of hyperthyroidism, and also useful biomarkers for GD (Baral et al., 2017). Despite changes of thyroid-binding globulin, the levels of FT3 and FT4 have an important application value in the diagnosis of hyperthyroidism and hypothyroidism, assessment of disease severity, and monitoring of curative effect, due to their stable content (Gökmen et al., 2016; Yu et al., 2018). The level of TRAb, a thyrotropin receptor antibody, is the indicator of GD prognosis (Kumata et al., 2016; Dong et al., 2017). TPOAb, a thyroid peroxidase antibody, and TGAb, athyroglobulin antibody, are both closely associated with the initiation and development of autoimmune thyroid diseases (Ying et al., 2016; Dong et al., 2017). Stimulated by the thyroid, TSH is one of the hormones secreted by the anterior pituitary gland, with the main functions of controlling and regulating the activity of the thyroid (Chiaravalloti et al., 2017). What’s more, the elevated levels of IFN-γ, IL-4, IL-17 and TGF-β detected in GD patients in the current study again verified the correspondence between GD and inflammatory response as reported in other studies (Zloza et al., 2011; Shen et al., 2015). In non-obese mice, the activated T cells were likely to secrete more proinflammatory cytokines that led to the rapid development of diabetes, and anti-PD-1 can suppress the occurrence of diabetes. (Ansari et al., 2003). In GD patients, the percentage of CD4+ T cells was increased, while that of CD8+ T cells was decreased, with the expression of PD-1 on both T cells being up-regulated. The expression of PD-1 has been mostly related with the tumorigenesis and prognosis of cancer. In B-cell lymphomas, the high PD-1 level was pointed to be involved with the relapse of lymphoma by affecting the microenvironment of cancer, and the block of PD-1/PD-L1 pathway has been reported to aggravate the endogenous antitumor responses in some aspects (Salmaninejad et al., 2018; Xu-Monette et al., 2018).
Yuan et al. (2017) found that the pathogenesis of GD may be related to the decrease of Treg cells and the increase of IL-17 gene expression by injecting the recombinant adenovirus of TSHR289 into mice to construct the GD model. This shows that lymphocytes play an important role in the pathogenesis of GD. In this study, in order to further reveal the effect of PD-1/PD-L1 on the surface of lymphocytes on the GD process, we also established a mouse model. In the following investigations, a GD mouse model was used for the study. And we successfully collected, cultured and identified mouse thyroid follicular epithelial cells. Moreover, the co-culture of CD4+PD-1+, CD4+PD-1- and CD8+PD-1+, CD8+PD-1- T lymphocytes with mouse thyroid follicular epithelial cells revealed the potential involvement between PD-1+ T lymphocytes and thyroid follicular epithelial cells. PD-1+ T lymphocytes resulted in high cell viability, low apoptosis, high inflammatory factors and TSH values, and low TH and TRAb levels in the mouse thyroid follicular epithelial cells co-cultured with PD-1+CD4+/CD8+ T cells, which suggested that the presence of PD-1 in lymphocytes could possibly promote the growth of mouse thyroid follicular epithelial cells, inhibit apoptosis, and change the secretion levels of hormone, antibody and inflammatory cytokines, thus further aggravating GD. The role of PD-1 and PD-1/PD-L1 pathway in autoimmune diseases has been widely appreciated (Dai et al., 2014). PD-1 and its ligand genes were highly expressed in meningeal infiltrates during active experimental autoimmune encephalomyelitis, which was considered to be associated closely with the inflammatory processes in central nervous systems (Liang et al., 2003). And in type 1 diabetes, the block of PD-1 or PD-L1 antibodies significantly accelerated the development of diabetes in the established NOD mouse model, suggesting it was possible that PD-1 pathway could prevent the aggravation of type 1 diabetes (Wang et al., 2005; Keir et al., 2006).
The direct mechanism of GD for the dysregulation of immune functions is currently considered to lie in the imbalance of immune cells with different functions in the body. In GD, high PD-1 expression was observed not only in the present study, but also mentioned by other researchers, which indicated that the overexpression of PD-1 could possibly suppress the excessive activation of autoreactive T cells so as to alleviate the severity of GD (Álvarez-Sierra et al., 2019). It was also proved by the reported research that the deficiency of PD-1 was associated with the progression of autoimmune diseases as a result of no suppression of overactivation of lymphocyte (Pyzik et al., 2017). As reported by Nowicka et al. (2019), the changes of immune cells could possibly reveal the prognosis of patients with furunculosis, especially in the aspect of inflammatory reactions. Moreover, the aberrant distribution of T lymphocytes and B lymphocytes in peripheral blood was found to play a significant role in the development of autoimmunity in GD patients (Bossowski et al., 2003). However, as presented in this study, the continuing elevation of CD4+ T cells and the large amount of CD8+ T cells consumption implied that the modification of excessive activation of T cells was not effective, and that the negative regulation had lost its balance. In order to control the activation level of autoreactive T cells under such a situation, and to prevent the situation from becoming even serious, more and more PD-1 was expressed in the membrane of lymphocytes, which resulted in a vicious cycle, thus leading to the further development of GD.
In conclusion, the present study demonstrated the role of PD-1 on the membrane of lymphocytes in affecting the proliferation and apoptosis of mouse thyroid follicular epithelial cells. High PD-1 expression in GD patients was detected, with the results demonstrating an increased level of CD4+ T cells and a decreased level of CD8+ T cells. What’s more, the presence of PD-1 in lymphocytes could possibly cause a more accelerated development of GD by promoting the growth of thyroid follicular epithelial cells and inhibiting their apoptosis. Studies have found that the expression of MHC class I in IFN-α-induced human pancreatic cells was preferred (Coomans de Brachène et al., 2018), and cytomegalovirus evades CD8+ T cells by inhibiting MHC class I restriction antigen presentation (Yunis et al., 2018), However, it is unknown whether or not the MHC class I expression is being induced by invoular epithelial cells to evade the immune effect of CD8+ T cells. Furthermore, our current research content is still not deep enough, so we should also explore the effects of other factors on the surface of T lymphocytes on the proliferation of thyroid follicular epithelial cells, and the effect of lymphocytes on the expression of MHC class I cells in thyroid follicular epithelial cells.
ACKNOWLEDGMENTS
This work was supported by the Medical and Health Technology Program of Zhejiang Province [Grant Number 2019KY129]. Thanks for the financial support.
Conflict of interest
The authors declare that there is no conflict of interest.
REFERENCES
- Álvarez-Sierra, D., Marín-Sánchez, A., Ruiz-Blázquez, P., de Jesús Gil, C., Iglesias-Felip, C., González, Ó., Casteras, A., Costa, R.F., Nuciforo, P., Colobran, R. and Pujol-Borrell, R. (2019): Analysis of the PD-1/PD-L1 axis in human autoimmune thyroid disease: insights into pathogenesis and clues to immunotherapy associated thyroid autoimmunity. J. Autoimmun., 103, 102285.
- Ansari, M.J., Salama, A.D., Chitnis, T., Smith, R.N., Yagita, H., Akiba, H., Yamazaki, T., Azuma, M., Iwai, H., Khoury, S.J., Auchincloss, H. Jr. and Sayegh, M.H. (2003): The programmed death-1 (PD-1) pathway regulates autoimmune diabetes in nonobese diabetic (NOD) mice. J. Exp. Med., 198, 63-69.
- Baral, S., Shrestha, P.K. and Pant, V. (2017): Serum Free T3 to Free T4 Ratio as a Useful Indicator for Differentiating Destruction Induced Thyrotoxicosis from Graves’ Disease. J. Clin. Diagn. Res., 11, OC12-OC14.
- Bossowski, A., Urban, M. and Stasiak-Barmuta, A. (2003): Analysis of changes in the percentage of B (CD19) and T (CD3) lymphocytes, subsets CD4, CD8 and their memory (CD45RO), and naive (CD45RA) T cells in children with immune and non-immune thyroid diseases. J. Pediatr. Endocrinol. Metab., 16, 63-70.
- Chiaravalloti, A., Ursini, F., Fiorentini, A., Barbagallo, G., Martorana, A., Koch, G., Tavolozza, M. and Schillaci, O. (2017): Functional correlates of TSH, fT3 and fT4 in Alzheimer disease: a F-18 FDG PET/CT study. Sci. Rep., 7, 6220.
- Collins, M., Michot, J.M., Danlos, F.X., Mussini, C., Soularue, E., Mateus, C., Loirat, D., Buisson, A., Rosa, I., Lambotte, O., Laghouati, S., Chaput, N., Coutzac, C., Voisin, A.L., Soria, J.C., Marabelle, A., Champiat, S., Robert, C. and Carbonnel, F. (2017): Inflammatory gastrointestinal diseases associated with PD-1 blockade antibodies. Ann. Oncol., 28, 2860-2865.
- Coomans de Brachène, A., Dos Santos, R.S., Marroqui, L., Colli, M.L., Marselli, L., Mirmira, R.G., Marchetti, P. and Eizirik, D.L. (2018): IFN-α induces a preferential long-lasting expression of MHC class I in human pancreatic beta cells. Diabetologia, 61, 636-640.
- Cox, S.C., Tamatea, J.A., Conaglen, J.V. and Elston, M.S. (2016): The management of Graves’ disease in New Zealand 2014. N. Z. Med. J., 129, 10-24.
- Dai, S., Jia, R., Zhang, X., Fang, Q. and Huang, L. (2014): The PD-1/PD-Ls pathway and autoimmune diseases. Cell. Immunol., 290, 72-79.
- DeGroot, L.J. (2000): Graves’ Disease and the Manifestations of Thyrotoxicosis. In: Endotext (Feingold, K.R., Anawalt, B., Boyce, A. et al. eds.), MDText.com, Inc., South Dartmouth (MA).
- Dong, Q., Liu, X., Wang, F., Xu, Y., Liang, C., Du, W. and Gao, G. (2017): Dynamic changes of TRAb and TPOAb after radioiodine therapy in Graves’ disease. Acta Endocrinol. (Bucur.), 13, 72-76.
- Feng, M., Xiong, G., Cao, Z., Yang, G., Zheng, S., Song, X., You, L., Zheng, L., Zhang, T. and Zhao, Y. (2017): PD-1/PD-L1 and immunotherapy for pancreatic cancer. Cancer Lett., 407, 57-65.
- Gökmen, F.Y., Ahbab, S., Ataoğlu, H.E., Türker, B.C., Çetin, F., Türker, F., Mamaç, R.Y. and Yenigün, M. (2016): FT3/FT4 ratio predicts non-alcoholic fatty liver disease independent of metabolic parameters in patients with euthyroidism and hypothyroidism. Clinics (São Paulo), 71, 221-225.
- Jeker, L.T., Hejazi, M., Burek, C.L., Rose, N.R. and Caturegli, P. (1999): Mouse thyroid primary culture. Biochem. Biophys. Res. Commun., 257, 511-515.
- Jin, H.T., Ahmed, R. and Okazaki, T. (2011): Role of PD-1 in regulating T-cell immunity. Curr. Top. Microbiol. Immunol., 350, 17-37.
- Josephs, T.M., Grant, E.J. and Gras, S. (2017): Molecular challenges imposed by MHC-I restricted long epitopes on T cell immunity. Biol. Chem., 398, 1027-1036.
- Keir, M.E., Liang, S.C., Guleria, I., Latchman, Y.E., Qipo, A., Albacker, L.A., Koulmanda, M., Freeman, G.J., Sayegh, M.H. and Sharpe, A.H. (2006): Tissue expression of PD-L1 mediates peripheral T cell tolerance. J. Exp. Med., 203, 883-895.
- Khoo, T.K. and Bahn, R.S. (2007): Pathogenesis of Graves’ ophthalmopathy: the role of autoantibodies. Thyroid, 17, 1013-1018.
- Kumata, K., Nagata, K., Matsushita, M., Kuwamoto, S., Kato, M., Murakami, I., Fukata, S. and Hayashi, K. (2016): Thyrotropin Receptor Antibody (TRAb)-IgM Levels Are Markedly Higher Than TRAb-IgG Levels in Graves’ Disease Patients and Controls, and TRAb-IgM Production Is Related to Epstein-Barr Virus Reactivation. Viral Immunol., 29, 459-463.
- Liang, S.C., Latchman, Y.E., Buhlmann, J.E., Tomczak, M.F., Horwitz, B.H., Freeman, G.J. and Sharpe, A.H. (2003): Regulation of PD-1, PD-L1, and PD-L2 expression during normal and autoimmune responses. Eur. J. Immunol., 33, 2706-2716.
- Louis-Dit-Sully, C., Blumenthal, B., Duchniewicz, M., Beck-Garcia, K., Fiala, G.J., Beck-García, E., Mukenhirn, M., Minguet, S. and Schamel, W.W. (2014): Activation of the TCR complex by peptide-MHC and superantigens. Exp Suppl, 104 (Suppl 104), 9-23.
- McLeod, D.S. and Cooper, D.S. (2012): The incidence and prevalence of thyroid autoimmunity. Endocrine, 42, 252-265.
- Nowicka, D., Grywalska, E., Surdacka, A., Grafka, A. and Roliński, J. (2019): Frequencies of PD-1- and PD-L1- positive T CD3+CD4+, T CD3+CD8+ and B CD19+ lymphocytes and its correlations with other immune cells in patients with recurrent furunculosis. Microb. Pathog., 126, 85-91.
- Prado-Garcia, H., Romero-Garcia, S., Puerto-Aquino, A. and Rumbo-Nava, U. (2017): The PD-L1/PD-1 pathway promotes dysfunction, but not “exhaustion”, in tumor-responding T cells from pleural effusions in lung cancer patients. Cancer Immunol. Immunother., 66, 765-776.
- Pyzik, A., Grywalska, E., Matyjaszek-Matuszek, B., Smoleń, A., Pyzik, D. and Roliński, J. (2017): Frequencies of PD-1- positive T CD3+CD4+, T CD3+CD8+ and B CD19+ lymphocytes in female patients with Graves’ disease and healthy controls- preliminary study. Mol. Cell. Endocrinol., 448, 28-33.
- Salmaninejad, A., Khoramshahi, V., Azani, A., Soltaninejad, E., Aslani, S., Zamani, M.R., Zal, M., Nesaei, A. and Hosseini, S.M. (2018): PD-1 and cancer: molecular mechanisms and polymorphisms. Immunogenetics, 70, 73-86.
- Saxena, P., Charpin-El Hamri, G., Folcher, M., Zulewski, H. and Fussenegger, M. (2016): Synthetic gene network restoring endogenous pituitary-thyroid feedback control in experimental Graves’ disease. Proc. Natl. Acad. Sci. USA, 113, 1244-1249.
- Shen, J., Li, Z., Li, W., Ge, Y., Xie, M., Lv, M., Fan, Y., Chen, Z., Zhao, D. and Han, Y. (2015): Th1, Th2, and Th17 Cytokine Involvement in Thyroid Associated Ophthalmopathy. Dis. Markers, 2015, 609593.
- Wang, J., Yoshida, T., Nakaki, F., Hiai, H., Okazaki, T. and Honjo, T. (2005): Establishment of NOD-Pdcd1-/- mice as an efficient animal model of type I diabetes. Proc. Natl. Acad. Sci. USA, 102, 11823-11828.
- Xu-Monette, Z.Y., Zhou, J. and Young, K.H. (2018): PD-1 expression and clinical PD-1 blockade in B-cell lymphomas. Blood, 131, 68-83.
- Ying, H., Tang, Y.P., Bao, Y.R., Su, X.J., Cai, X., Li, Y.H. and Wang, D.F. (2016): Maternal TSH level and TPOAb status in early pregnancy and their relationship to the risk of gestational diabetes mellitus. Endocrine, 54, 742-750.
- Yu, T., Tian, C., Song, J., He, D., Wu, J., Wen, Z., Sun, Z. and Sun, Z. (2018): Value of the fT3/fT4 ratio and its combination with the GRACE risk score in predicting the prognosis in euthyroid patients with acute myocardial infarction undergoing percutaneous coronary intervention: a prospective cohort study. BMC Cardiovasc. Disord., 18, 181.
- Yuan, Q., Zhao, Y., Zhu, X. and Liu, X. (2017): Low regulatory T cell and high IL-17 mRNA expression in a mouse Graves’ disease model. J. Endocrinol. Invest., 40, 397-407.
- Yunis, J., Farrell, H.E., Bruce, K., Lawler, C., Sidenius, S., Wyer, O., Davis-Poynter, N. and Stevenson, P.G. (2018): Murine cytomegalovirus degrades MHC class II to colonize the salivary glands. PLoS Pathog., 14, e1006905.
- Zamani, M.R., Aslani, S., Salmaninejad, A., Javan, M.R. and Rezaei, N. (2016): PD-1/PD-L and autoimmunity: A growing relationship. Cell. Immunol., 310, 27-41.
- Zloza, A., Jagoda, M.C., Lyons, G.E., Graves, M.C., Kohlhapp, F.J., O’Sullivan, J.A., Lacek, A.T., Nishimura, M.I. and Guevara-Patiño, J.A. (2011): CD8 co-receptor promotes susceptibility of CD8+ T cells to transforming growth factor-β (TGF-β)-mediated suppression. Cancer Immunol. Immunother., 60, 291-297.