Abstract
A novel tobacco vapor product (NTV) contains tobacco leaves and generates nicotine-containing aerosols using heating elements. Subchronic biological effects have been evaluated previously using three-dimensional bronchial epithelial model cells by repeated exposure to cigarette smoke (CS) and the NTV aerosols; however, the intracellular exposure characteristics have not been studied in detail. In this study, cells were initially exposed to an aqueous extract (AqE) of cigarette smoke (CS) at two concentration levels, and the cell lysate underwent untargeted analysis by LC-high resolution mass spectrometry to determine the exogenous compounds present in the cells. Among the thousands of peaks detected, four peaks showed a CS-dependency, which were reproducibly detected. Two of the peaks were nicotine and nicotine N-oxide, and the other two putative compounds were myosmine and norharman. The cells were then exposed to an AqE of CS in various combinations of exposure and post-exposure culture durations. Post-exposure culturing of cells with fresh medium markedly decreased the peak areas of the four compounds. The in-vitro switching study of CS to NTV aerosols was investigated by intermittently exposing cells to an AqE of CS four times, followed by exposure to either an AqE of CS, NTV aerosol or medium another four times. Switching to NTV reduced myosmine and norharman levels, which are known CS constituents. The results indicate that extracellular compounds inside cells reflect the exposure state outside cells. Thus, monitoring functional changes to cells in these exposure experiments is feasible.
INTRODUCTION
Tobacco vapor products contain tobacco leaves and generate a nicotine-containing aerosol using heating elements. The novel tobacco vapor product (NTV) is a type of tobacco vapor product that consists of a battery, a cartridge with a liquid (that does not contain nicotine) equipped with heating elements and a tobacco capsule. The NTV generates an aerosol by electrically heating the liquid inside the cartridge, and the released aerosol absorbs the constituents of tobacco leaves including nicotine when passing through the tobacco capsule.
Cigarette smoke (CS) contains more than 6000 chemical constituents (Rodgman and Perfetti, 2013). Unlike CS, aerosols from tobacco vapor products, which do not contain components derived from combustion of tobacco leaves, are expected to contain fewer chemical constituents. The NTV produces low yields of potentially harmful constituents primarily derived from combustion (Takahashi et al., 2018). Previous research using an in vitro human bronchial epithelial cell line has revealed that the aqueous extract (AqE) of an aerosol from these products has low biological activity including induction of oxidative stress (Munakata et al., 2018). Although these assays are easy to perform and are cost-effective, such assays with monolayer-cultured cells may only reflect the acute effects from these aerosols. Thus, measured activities are limited to initial responses upon exposure and appropriate assay methods to evaluate subchronic responses are needed that mimic organotypic functions and tolerate long-term cultivation.
Using reconstructed in vitro three-dimensional (3D) model cells of airway epithelial cells is one such method. The model cells consist of functionally differentiated ciliated cells, goblet cells and basal cells, which represent beating cilia with secreted mucin, thus showing mucociliary clearance capacity. Baxter et al. (2015) also reported that 3D bronchial epithelial cells showed long-term maintenance of mucociliary clearance and metabolic capacity. Therefore, this model was considered a suitable approach to study subchronic responses to NTV-generated aerosols.
We previously performed repeated CS exposure studies and a switching study to the NTV using 3D model cells of bronchial epithelial cells to determine whether the cultures could recapitulate the actual situation of smoking by in vitro experiments, as well as the effects of switching to the NTV. Repeated exposure to CS showed cumulative effects such as augmentation of inflammatory cytokines (Ishikawa and Ito, 2017), and intermediate switching to the NTV attenuated such cellular responses in a manner that was similar to intermediate cessation from CS exposure (Ito et al., 2020). However, external exposure concentrations in the 3D experiments may not always fully align with intracellular exposure concentrations, and we did not examine whether exposed CS constituents were retained in the cells during these studies.
The uptake of constituents can be estimated by analysis of small molecules inside cells. Generic metabolomics approaches have been used to examine CS-exposed cells in the context of multi-omics analysis (Ishikawa et al., 2019; Zanetti et al., 2017), where target compounds are limited to well-known endogenous metabolites. CS-exposed cells contain a complex matrix of chemical constituents. To analyze complex matrices, untargeted approaches using liquid chromatography (LC)-high resolution mass spectrometry (HRMS) have been applied for drug metabolites (Vorrink et al., 2017) and environmental samples (Southam et al., 2014). The use of LC-HRMS to examine CS-exposed cell lysates is expected to provide the intracellular exposure levels of 3D cells under complex matrices. In order to characterize the intracellular exposure levels in repeated and long-term exposure experiments, we applied the untargeted approach for lysates from AqEs of CS- or NTV aerosol-exposed cells under various exposure conditions, which provides insights into the mechanism of action in subchronic exposures, as well as in switching experiments from CS to NTV by in vitro studies.
MATERIALS AND METHODS
Commercially available 3D model cells
MucilAir-Smoker (EP05MD), 3D cultured bronchial epithelial model cells and MucilAir culture medium were purchased from Epithelix Sàrl (Geneva, Switzerland). The cells were reconstituted using human primary cells into plastic inserts, which are retained in 24-well flat-bottom plates manufactured by CORNING (Corning, NY, USA) with culture medium. The donor was a 55-year-old Caucasian male smoker. Cell culturing was performed in accordance with the manufacturer’s instructions. The cells were acclimated for over 10 days before starting experiments.
Generation of CS and the NTV aerosol
Reference cigarettes 3R4F were purchased from the University of Kentucky (Lexington, KY, USA) and were conditioned at 22 ± 1°C and 60 ± 3% relative humidity for at least 48 hr before use in accordance with the International Organization for Standardization (ISO) 3402:1999 (ISO, 1999). CS was generated under ISO 20778:2018 for an intense smoking regimen (ISO, 2018). In brief, a 55 mL puff was taken over 2 sec, repeated every 30 sec using a bell-shape puff profile. The ventilation hole of the cigarettes must be blocked before use. Each cigarette was smoked until the butt lengths reached 35 mm from the filter end.
NTV (a prototype of PLOOM TECH, manufactured by Japan Tobacco Inc., Tokyo, Japan) was used without conditioning. Tobacco capsules were removed from their packaging just before use and combined with unused cartridges for each run. The NTV aerosol was generated under Recommended Method No. 81 (Cooperation Centre for Scientific Research Relative to Tobacco (CORESTA), 2015). Briefly, a 55 mL puff was taken over 3 sec, repeated every 30 sec using a square-shape puff profile.
Generation of CS and the NTV aerosol was carried out using an RM20H smoking machine (Hamburg, Germany) operating in a conditioned room at 22 ± 1°C and 60 ± 5% relative humidity. A stick of 3R4F produces approximately 10 puffs (depending on combusting state). In this study, three sticks were used to produce approximately 30 puffs per run. Mean puff counts of smoking are shown in Table 1. A stick of NTV was puffed 50 times according to the manufacturer’s instructions. In this study, five sticks of NTV were puffed to produce exactly 250 puffs per run.
Table 1. Puff counts of smoking and nicotine concentration in medium exposed to CS and NTV.
Timing of
AqE preparation |
Puff counts for reference cigarette (counts/cigarette) |
Nicotine concentration in medium for exposure (μg/mL) |
| CS, 20 puffs/L |
NTV, 200 puffs/L |
| Study 1, 0 hr |
10.7 |
- (Sample loss) |
- |
| Study 1, 48 hr |
10.7 |
0.860 |
- |
| Study 2, day 1 |
11.3 |
0.880 |
- |
| Study 2, day 3 |
10.6 |
0.797 |
- |
| Study 2, day 5 |
10.4 |
0.897 |
- |
| Study 2, day 8 |
10.7 |
0.857 |
- |
| Study 2, day 10 |
10.8 |
0.737 |
1.54 |
| Study 2, day 12 |
10.4 |
0.898 |
1.56 |
| Study 2, day 15 |
10.3 |
0.902 |
1.54 |
| Study 2, day 17 |
10.0 |
0.867 |
1.29 |
| Mean |
10.6 |
0.855 |
1.48 |
| CV |
3.4% |
6.4% |
8.8% |
Preparation of AqEs of CS and NTV aerosol
AqEs of CS and NTV aerosol were prepared in accordance with a previous report (Munakata et al., 2018). AqEs of CS and NTV aerosol was prepared by bubbling mainstream smoke or aerosol into 15 mL of ice-cold Dulbecco’s modified Eagle’s medium (DMEM) (Life Technologies, Waltham, MA, USA) in a 70 mL-size amber impinger manufactured by Maeda Seisakusyo (Hongo, Tokyo, Japan). DMEM was used because the MucilAir culture medium generated excessive bubbles that caused overflow during bubbling, which interfered with further bubbling. The AqE of CS was diluted slightly with DMEM to obtain a 2,000 puffs/L solution. The AqE of the NTV aerosol was a 16,667 puffs/L solution. The nicotine concentration in each solution was analyzed to check the quality of the AqEs. The solution was further diluted with the MucilAir culture medium to obtain solutions with the designated number of puffs (5 or 20 puffs/L for CS, and 200 puffs/L for the NTV aerosol). The AqE preparation and subsequent exposure periods were performed within an hour, and each AqE used for nicotine analysis was stored at –20°C until analysis.
Calculating the nicotine concentration in the medium exposed to CS or NTV
The nicotine concentration in each AqE was measured using an Acquity UPLC system with a photodiode array detector (Waters, Milford, MA, USA). Separation was achieved using a CAPCELL CORE AQ column (2.1 mm i.d., 150-mm long, 2.7-µm particle size; Shiseido, Tokyo, Japan) and an isocratic mobile phase (99% water containing 0.1% formic acid and 1% acetonitrile). The mobile phase flow rate was 0.4 mL/min, and the injection volume was 5 µL. The detection wavelength was 260 nm, and the column temperature was 40°C. Each AqE was diluted by a factor of 100 with ultra-pure water generated by a Milli-Q system (Merck Millipore, Burlington, MA, USA) prior to analysis. Nicotine used for quantification was distilled to have purity above 99% (purchased from Sumika Chemical Analysis Service (Osaka, Japan)). The nicotine concentrations in each medium exposed to CS or NTV aerosol are shown in Table 1, which were calculated from the analytical results of each AqE of 2,000 puffs/L for CS and 16,667 puffs/L for NTV aerosols by multiplying by the dilution factors to give 20 puffs/L for CS and 200 puffs/L for NTV aerosols. Coefficient of variation (CV) values for nicotine concentration in medium for exposure to CS and NTV were 6.4% and 8.8%, respectively. These low CV values, as well as the value for puff counts (3.4%, CS only), support the precision of using AqEs.
Design of short-term exposure experiments
The study design is shown in Table 2. The AqE of CS was freshly prepared for operations at 0 and 48 hr. Cells were exposed to the AqE of CS by culturing with this extract (5 puffs/L unless otherwise stated) for different exposure durations (4, 24, 48 and 96 hr). Some of the samples were subjected to various durations of the post-exposure culture by exchanging to fresh medium (20, 44 and 48 hr; ‘mc’ in the operation column of Table 2). In the sample codes, ‘S’ denotes exposure (in hours) to CS for the number given after the ‘S’ and ‘m’ denotes post-exposure culturing by a exchanging the medium for the number of hours given by the subsequent numeric. For example, ‘S4m44S4’ of No. 6 describes 4 hr exposure to CS that is followed by a medium change and 44 hr culturing, 4 hr exposure to CS and finally the cells are harvested for extraction (‘H’ in the operation column of Table 2). A control sample (No. 1 (c4)) was cultured with the medium containing 1% DMEM as the AqE without exposure to CS. No. 3 (S(20)4) describes cells exposed to an AqE of CS (20 puffs/L) for 4 hr, and these cells were used for selecting CS exposure-derived peaks.
Table 2. Study design of the short-term exposure experiment.
| No. |
Sample Code |
Exposure condition |
Operation |
| 0 |
4 |
24 |
48 |
52 |
72 |
96 (hr) |
| 1 |
c4 |
Control (1% DMEM, 4 hr culture) |
Control |
H |
|
|
|
|
|
| 2 |
S4 |
4 hr exposure, no post-exposure culture |
CS(5) |
H |
|
|
|
|
|
| 3 |
S(20)4 |
4 hr exposure to AqE of CS (20 puffs/L) |
CS(20) |
H |
|
|
|
|
|
| 4 |
S4m20 |
4 hr exposure with 20 hr post-exposure culture |
CS(5) |
mc |
H |
|
|
|
|
| 5 |
S4m44 |
4 hr exposure with 44 hr post-exposure culture |
CS(5) |
mc |
|
H |
|
|
|
| 6 |
S4m44S4 |
4 hr exposure after (S4m44) |
CS(5) |
mc |
|
CS(5) |
H |
|
|
| 7 |
S4m44S4m44 |
(S4m44), repeated |
CS(5) |
mc |
|
CS(5) |
mc |
|
H |
| 8 |
S24 |
24 hr exposure, no post-exposure culture |
CS(5) |
|
H |
|
|
|
|
| 9 |
S24m24 |
24 hr exposure with 24 hr post-exposure culture |
CS(5) |
|
mc |
H |
|
|
|
| 10 |
S24m24S24 |
24 hr exposure after (S24m24) |
CS(5) |
|
mc |
CS(5) |
|
H |
|
| 11 |
S24m24S24m24 |
(S24m24), repeated |
CS(5) |
|
mc |
CS(5) |
|
mc |
H |
| 12 |
S48 |
48 hr exposure, no post-exposure culture |
CS(5) |
|
|
H |
|
|
|
| 13 |
S48m48 |
48 hr exposure with 48 hr post-exposure culture |
CS(5) |
|
|
mc |
|
|
H |
| 14 |
S96 |
96 hr exposure (AqE replaced at 48 hr) |
CS(5) |
|
|
CS(5)* |
|
|
H |
In the column titled ‘Sample Code’, ‘S’ denotes exposure to the AqE of CS for the number of hours stated by the number that follows ‘S’, and ‘m’ denotes post-exposure culture time following exchange of the medium for the period (hr) defined by the number that follows ‘m’ (see Materials and Methods). In the column titled ‘Operation’, ‘CS(5)’ denotes exposure to the AqE of CS (5 puffs/L), ‘CS(20)’ denotes exposure to the AqE of CS (20 puffs/L), ‘Control’ denotes exposure to 1% DMEM, ‘mc’ denotes exchange to fresh medium for the post-exposure culture and ‘H’ denotes harvest for extraction. *Replacement of the AqE of CS to a freshly prepared AqE to replace old medium components supplied at the beginning of the operation.
Nine cell inserts were subjected to each condition examined and extracts from three cell inserts were pooled to increase constituent concentrations in each analyte, and sample preparation was done in triplicate for each condition.
Design of the switching study
The study design is shown in Table 3. The AqE of CS and NTV aerosols were prepared freshly for each operation day. The cells were exposed to the AqE of CS by culturing cells with AqE of CS (20 puffs/L) or NTV aerosols (200 puffs/L) for 4 hr once every 2 or 3 days and this was followed by exchange to fresh medium, except for No. 15 (ctrl1) and No. 17 (SMK1). No. 19 (SMK8) represents continuous smoking, where the cells were repeatedly exposed to CS eight times. No. 20 (SMK4NTV4) represents switching to NTV, where the cells were repeatedly exposed to CS four times, followed by exposure to NTV for a further four times. No. 21 (SMK4ctrl4) represents smoking cessation, where the cells were repeatedly exposed to CS four times, followed by exposure to the medium containing 1% DMEM for another four times. No. 15 (ctrl1) and No. 16 (ctrl8) are control samples where cells were exposed to the medium containing 1% DMEM once and eight times, respectively. No. 17 (SMK1) and No. 18 (SMK4) are reference samples to check the intermediate states, where the cells were exposed to an AqE of CS one time and four times, respectively.
Table 3. Study design for the switching study.
| No. |
Sample Code |
Exposure condition |
Operation |
| 1 |
3 |
5 |
8 |
10 |
12 |
15 |
17 (day) |
| 15 |
ctrl1 |
1% DMEM 1 time |
Control,
H |
|
|
|
|
|
|
|
| 16 |
ctrl8 |
1% DMEM 8 times |
Control,
mc |
Control,
mc |
Control,
mc |
Control,
mc |
Control,
mc |
Control,
mc |
Control,
mc |
Control,
H |
| 17 |
SMK1 |
AqE of CS 1 time |
CS(20),
H |
|
|
|
|
|
|
|
| 18 |
SMK4 |
AqE of CS 4 times |
CS(20),
mc |
CS(20),
mc |
CS(20),
mc |
CS(20),
H |
|
|
|
|
| 19 |
SMK8 |
AqE of CS 8 times (Contiunous Smoking) |
CS(20),
mc |
CS(20),
mc |
CS(20),
mc |
CS(20),
mc |
CS(20),
mc |
CS(20),
mc |
CS(20),
mc |
CS(20),
H |
| 20 |
SMK4NTV4 |
AqE of CS 4 times, followed by AqE of NTV 4 times (Switching to NTV) |
CS(20),
mc |
CS(20),
mc |
CS(20),
mc |
CS(20),
mc |
NTV,
mc |
NTV,
mc |
NTV,
mc |
NTV,
H |
| 21 |
SMK4ctrl4 |
AqE of CS 4 times, followed by 1% DMEM 4 times (Smoking Cessation) |
CS(20),
mc |
CS(20),
mc |
CS(20),
mc |
CS(20),
mc |
Control,
mc |
Control,
mc |
Control,
mc |
Control,
H |
In the ‘Sample Code’ column, ‘SMK’ denotes exposure to the AqE of CS for the intermittent repetition defined by the number that follows ‘SMK’. ‘NTV’ denotes exposure to the AqE of the NTV aerosol for the intermittent repetition defined by the number that follows ‘NTV’ and ‘ctrl’ denotes exposure to 1% DMEM in the medium for the intermittent repetition defined by the number that follows ‘ctrl’. In the ‘Operation’ column, ‘CS(20)’ denotes exposure to the AqE of CS (20 puffs/L) for 4 hr, ‘NTV’ denotes exposure to the AqE of NTV aerosols (200 puffs/L) for 4 hr, ‘Control’ denotes exposure to 1% DMEM for 4 hr, ‘mc’ denotes exchange to fresh medium for the post-exposure culture and ‘H’ denotes harvest for extraction.
As described for the short-term experiments, nine cell inserts were exposed to each condition to produce triplicate analytes.
LC-HRMS analysis of cellular model lysates
After exposure, cells were harvested from culture inserts and washed with 5% mannitol aq. and water, then the cells were frozen by submerging in liquid nitrogen. Frozen cells were stored at -30°C until lysate preparation; lysates were prepared at once after completion of the individual experiments. Cells from the three inserts for each set of samples were pooled, added to 500 μL of 50% acetonitrile aq., and sonicated for 20 min. The samples were then centrifuged at 2,300 × g for 5 min and the supernatant was ultrafiltered using Ultrafree MC-PLHCC for metabolome analysis (Human Metabolome Technologies, Yamagata, Japan) at 9,100 × g, dried and dissolved in 300 μL of 90% acetonitrile aq. Pooled samples were prepared by collecting 200 μL of each sample and mixed together.
LC separation was performed using a Vanquish Flex UHPLC system (Thermo Fisher Scientific, Waltham, MA, USA), equipped with a ZIC-pHILIC column (2.1 × 100 mm, 2.7 μm, Merck Millipore) at 40°C with a 5-μL injection volume. The mobile phase consisted of a linear gradient from 90% (at 1 min) to 30% (at 22 min) acetonitrile with 20 mM ammonium bicarbonate. The flow rate of the mobile phase was 200 μL/min. Each sample was injected once, except for the pooled sample without dilution, which was injected at least six times in advance of the other analytes and once every 12 analytes.
Mass spectrometry (MS) detection was performed using a Q Exactive mass spectrometer (Thermo Fisher Scientific). Ionization was performed with an ESI ion source operating in the positive and negative (data not shown) ionization modes. Vaporizer heater temperature, capillary temperature, spray voltage, sheath gas and auxiliary gas were set at 400°C, 250°C, +3.5 kV (positive)/–2.5 kV (negative), 45 a.u. and 10 a.u., respectively. The acquisition mode was set to the data dependent acquisition (DDA) mode. MS/MS spectra were simultaneously acquired for each of the five highest MS signals found in a full scan acquisition. The full scan acquisition was performed at a resolution of 70,000 (FWHM) with an m/z range of 60-900, whereas MS/MS spectra were acquired at a resolution of 17,500 (FWHM). The collision energy for MS/MS acquisition was set to accumulating spectra acquired with 20, 50 and 80 V.
Data analysis
LC-HRMS chromatograms were processed using a Progenesis QI (Waters) unless otherwise stated, and the resulting raw peak areas were used to calculate the relative peak areas of each compound within the individual experiments. The lysate samples are complex mixtures that gave numerous peaks in the chromatograms. Results for the short-term exposure experiment initially detected 4,791 peaks. Some of these peaks were determined to be noise peaks and were excluded from data analysis. The exclusion of the noise peaks was performed using repeated analysis of the pooled samples in the short-term exposure experiment. The pooled samples were analyzed at least 10 times within a run, and peaks with low repeatability were excluded. The calculation was done using R version 3.5.1 (R Core Team, 2016). Initially, very low absolute areas below 1 (including 0) were set as 1 to avoid dividing by low values when calculating relative values. The results obtained from the first injection were not used because the coefficient of determination of all peak areas with that first run by the second injection was below 0.995. Areas with CV values over 30% were then excluded from further analysis (Saigusa et al., 2016). This process selected 2,279 peaks for compound annotation. Comprehensive compound annotation was achieved using a list of tobacco smoke components (Rodgman and Perfetti, 2013), HMDB 4.0 (Wishart et al., 2018) and the LC-MS/MS library of the MassBank of North America (MoNA) (http://mona.fiehnlab.ucdavis.edu/); no RTs were used here. From the peaks selected with pooled samples, 1180 peaks had at least one annotation, in which 279 peaks had MS/MS spectra. Both peaks with or without MS/MS spectra were subjected to picking up CS exposure-derived peaks.
CS exposure-derived peaks were selected using the mean areas of the samples prepared in triplicate, which were obtained from samples exposed to CS for 4 hr in the short-term exposure experiment. Peaks with areas above 1,000 in the 5 puffs/L AqE of CS exposed samples (No. 2 (S4) in Table 2), peaks with areas more than two-fold in the 20 puffs/L exposed samples (No. 3 (S(20)4)) when compared with 5 puffs/L exposed samples (No. 2 (S4)), and peaks with areas more than two-fold in the 5 puffs/L exposed samples (No. 2 (S4)) when compared with control samples (No. 1 (c4)) were selected as CS exposure-derived.
Compound identification of the selected peaks was performed using chemical reagents based on the candidate names in the comprehensive compound annotation. The chromatograms of chemical reagents were processed using MZMine 2 (Pluskal et al., 2010) to obtain individual retention times (RT) and m/z.
RESULTS AND DISCUSSION
Selection of CS exposure-derived peaks
Lysates from model cells exposed to the AqE of CS contained a complex matrix of absorbed CS constituents and their metabolites, as well as endogenous metabolites. The lysate prepared from cells exposed to 5 puffs/L AqE of CS (No. 2 (S4) in Table 2) was analyzed by LC-HRMS, and 1,180 peaks were selected as peaks representing chemical constituents. The variation in the peak areas are shown in Fig. 1. The peaks with larger areas had lower CV values. Here, 811 peaks had an area above 1,000 (dark grey points in Fig. 1) and were selected as reproducibly detected peaks above the background noise.

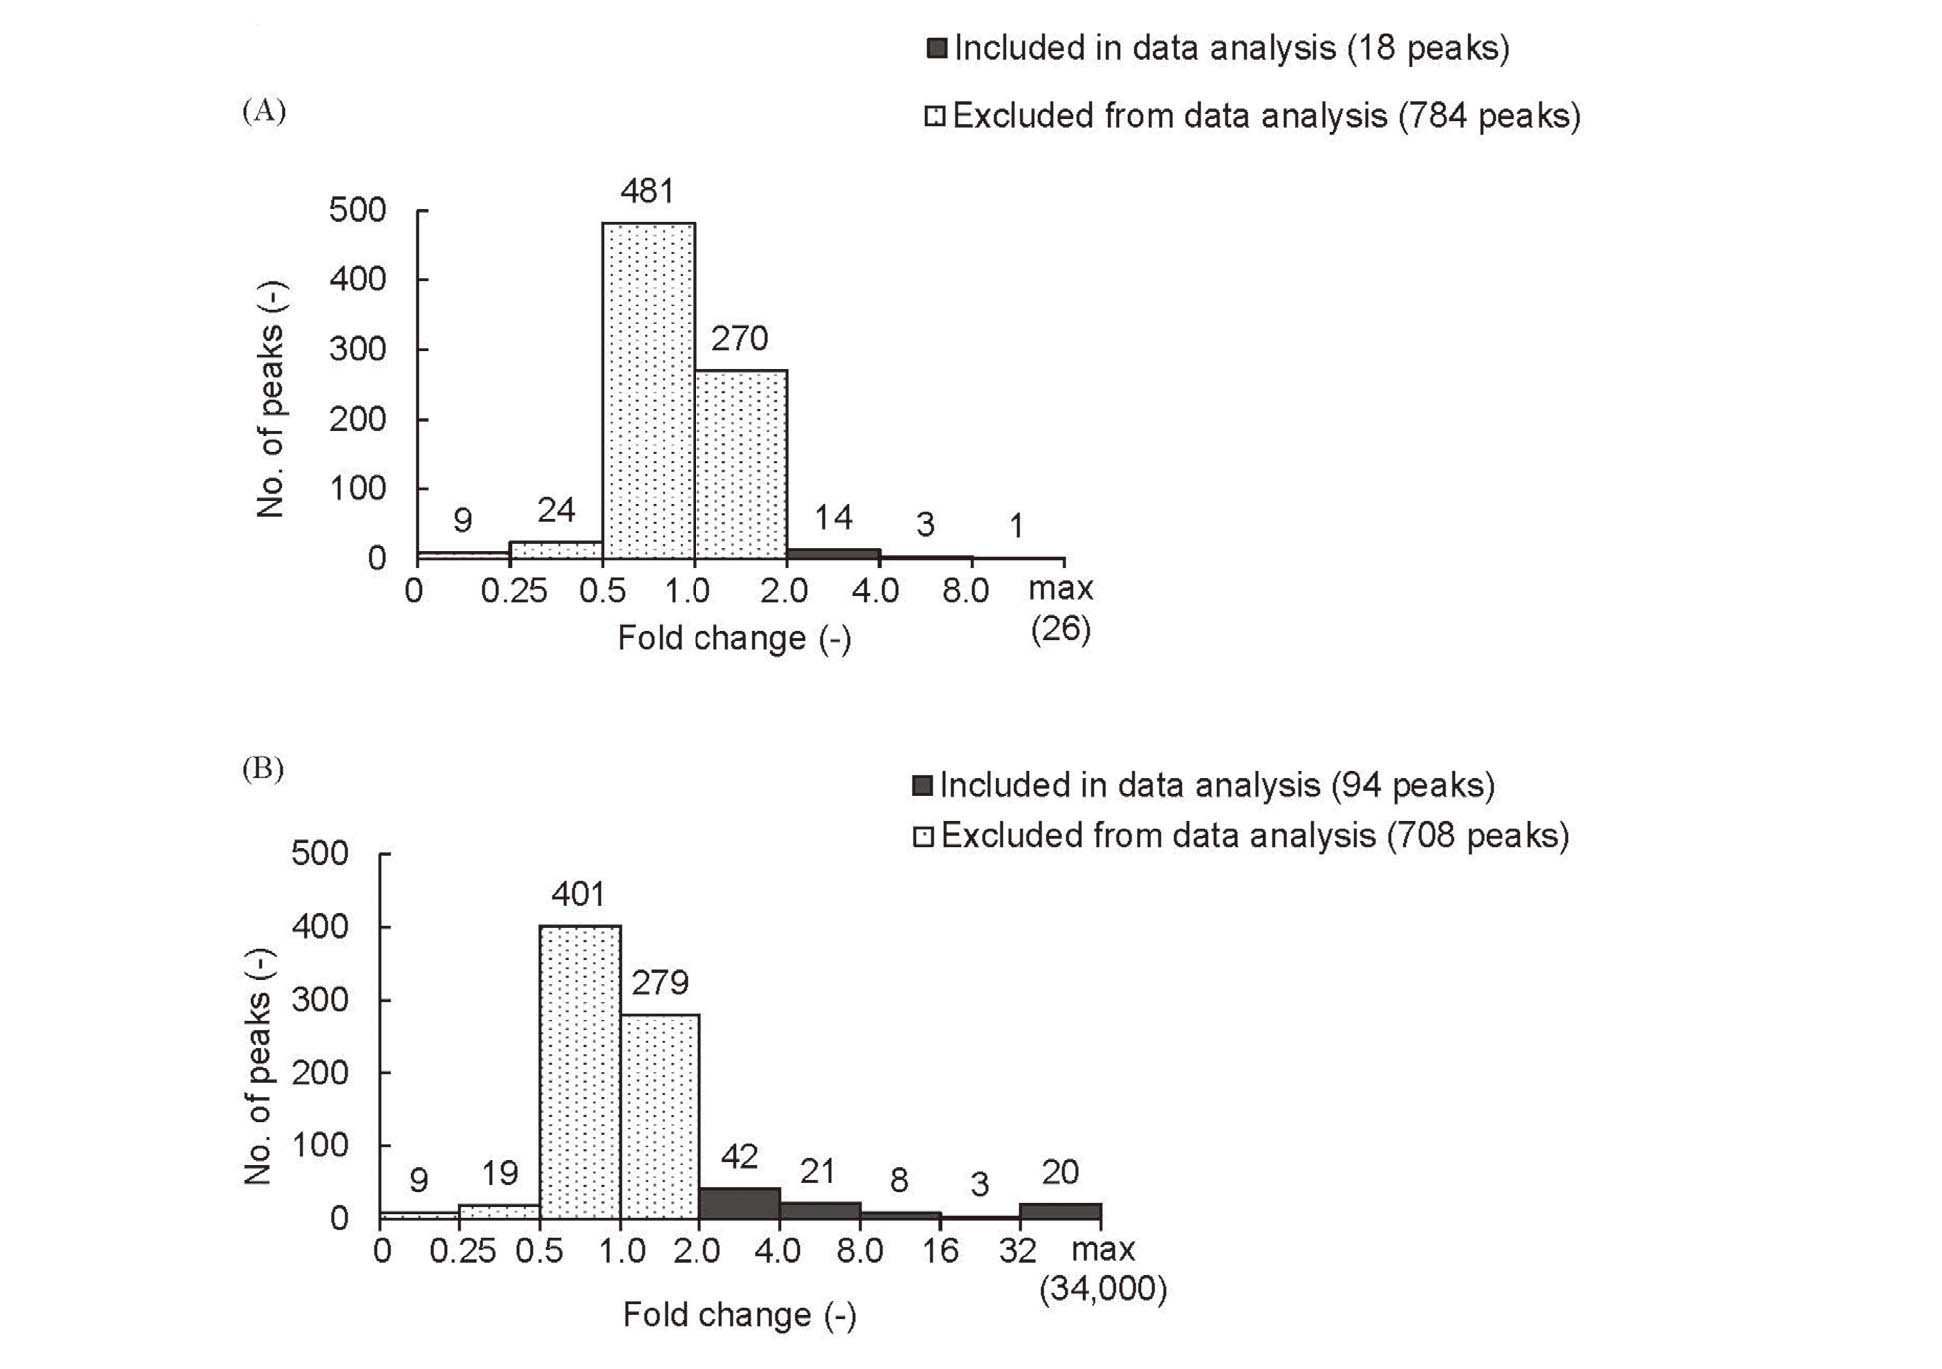
Exposure to CS was anticipated to cause an increase in peak areas and the fold change to the peak areas following exposure to CS was calculated. The peaks were selected by two tentative criteria because no standard criteria have been established to select peaks representing constituents following exposure to CS. The number of peaks with the fold changes are plotted in Fig. 2. The first criterion was that 20 puffs/L exposed samples (No. 3 (S(20)4)) were assumed to cause an increase in the peak area by at least two-fold when compared with the corresponding peaks from a lysate of cells exposed to 5 puffs/L (No. 2 (S4)), i.e., exposure of samples to CS by four-fold may cause an increase in peak area by at least two-fold. The fold changes are shown in Fig. 2A; only 18 peaks showed an increase by at least two-fold (dark grey bars in Fig. 2A). The second criterion is that lysates prepared from cells exposed to 5 puffs/L samples (No. 2 (S4)) were assumed to show an increase in peak area by at least two-fold when compared with that of the control samples (No. 1 (c4)), i.e., cell lysates not exposed to CS were expected to contain no or very low amounts of the compounds identified to be present in CS-exposed samples. The fold changes are shown in Fig. 2B; 94 peaks had such characteristics (dark grey bars in Fig. 2B). Ten peaks satisfied both criteria, which were subjected to compound identification.
The peaks selected as CS exposure-derived in the short-term exposure experiment are listed in Table 4. Among the ten peaks, seven corresponding peaks were found in the switching study. Of the seven peaks commonly found in the two experiments, nicotine and nicotine N-oxide peaks were confirmed by comparing RTs and m/z with standard compound analysis. Nicotine is a major constituent of tobacco leaves, whereas nicotine N-oxide is a primary metabolite of nicotine (Benowitz et al., 2009). Although myosmine and norharman peaks did not have MS/MS spectra in the switching experiment, they had RTs and m/z values that matched standard compound analyses. Myosmine is found in tobacco leaves (Benowitz et al., 2009; Zhang et al., 2018), whereas norharman is generated primarily from the combustion of tobacco (Zhang et al., 2011). In this study, 901 peaks out of 1,180 did not have MS/MS spectra; however, identification can be supported by these experimental contexts (Schymanski et al., 2014). Two other peaks that had the same RT as nicotine were annotated as quinoline and 2- or 3-methylindole, but these compounds had different RTs to nicotine when these compounds were analyzed on the same day in a different day of lysate analysis. These peaks are postulated to be fragments of nicotine because nicotine produces approximately 130.07 and 132.08 fragments with areas of a few percent of the molecular ion peak (approximate m/z 163.12) in MS1 spectra. A peak with an RT of 1.09 min and m/z of 188.1174 was unresolved. Here, the elemental composition was calculated as C10H18ClN but the isotopic ion for 37Cl was not detected. Finally, four peaks of nicotine, nicotine N-oxide, myosmine and norharman were selected as target compounds.
Table 4. List of selected peaks for compound identification.
| Short-term exposure experiment |
|
Repeated exposure experiment |
|
Analysis of candidate compounds |
Reported yield
(μg/cigarette)* |
Confidence level |
| Retention time (min) |
m/z of [M+H]+ |
Retention time (min) |
m/z of [M+H]+ |
Candidate name |
Library |
Retention time (min) |
m/z of [M+H]+ |
|
|
| 1.09 |
188.1174 |
|
1.06 |
188.1178 |
(unresolved) |
- |
|
- |
- |
- |
- |
| 1.32 |
130.0645 |
|
1.37 |
130.0648 |
quinoline |
A,B,C |
|
1.13 |
130.0651 |
0.366a |
x |
| 1.32 |
132.0802 |
|
1.37 |
132.0804 |
2-methylindole or 3-methylindole |
A,C
A,B |
|
1.05
1.13 |
132.0806
132.0715 |
0.19b
10.4b |
x |
| 1.32 |
163.1222 |
|
1.37 |
163.1225 |
nicotine |
A,B,C |
|
1.60 |
163.1227 |
20,300a |
confirmed |
| 1.36 |
147.0910 |
|
1.53 |
147.0912 |
myosmine (No MS/MS) |
A,B,C |
|
1.27 |
147.0912 |
20.5c |
probable |
| 1.47 |
169.0753 |
|
1.49 |
169.0756 |
norharman (No MS/MS) |
A,B,C |
|
1.45 |
169.0753 |
43.9c |
probable |
| 1.66 |
123.0910 |
|
Not detected |
- |
- |
- |
|
- |
- |
- |
- |
| 2.24 |
282.1131 |
|
Not detected |
- |
- |
- |
|
- |
- |
- |
- |
| 4.28 |
179.1171 |
|
4.46 |
179.1174 |
nicotine N-oxide |
A,B |
|
5.08 |
179.1176 |
10.8c |
confirmed |
| 5.47 |
149.1067 |
|
Not detected |
- |
(nornicotine) |
A,B,C |
|
- |
- |
- |
- |
*For Kentucky Reference Cigarette 3R4F. In ‘Library’, A denotes Rodgman and Perfetti (2013), B denotes HMDB and C denotes MoNA. Values in ‘Reported yield’ refer aTakahashi et al. (2018), bKnorr et al. (2019) and cBentley et al. (2020). In ‘Confidence Level’, x denotes denial of candidate name (possible a fragment of nicotine).
For the three missing peaks in the switching study, a peak with an RT of 5.47 min and m/z ([M+H]+ for all following values) of 149.1067 was possibly nornicotine according to the library search. Nornicotine is a metabolite of nicotine and generally found in CS (Zhang et al., 2018; Rodgman and Perfetti, 2013); however, nornicotine is not reproducibly detected in experiments using a standard compound because of the drying steps required for sample preparation (Mathon et al., 2019).
The mean peak areas of the four target compounds in all samples are shown in Table 5. More than half of the peaks had CV values for peak areas less than 30% when analyzed in triplicate. Samples with high CV over 100% for myosmine are considered to be background-level values or deviations caused by a time-dependent change. The same solution was subjected to cell exposure in triplicate for each set of exposure conditions, so observed deviations were mainly derived from inherent variations in biological samples or sample processing.
Table 5. Mean peak areas for all samples.
| No. |
Sample code |
Mean peak area (-) |
| Nicotine |
Nicotine N-oxide |
Myosmine |
Norharman |
| 1 |
c4 |
5,325a |
3,508a |
33b |
173a |
| 2 |
S4 |
349,261 |
23,573 |
2,083 |
2,574 |
| 3 |
S(20)4 |
1,512,802 |
84,103 |
6,349 |
9,663 |
| 4 |
S4m20 |
72,794a |
7,761 |
239a |
318a |
| 5 |
S4m44 |
27,813 |
7,009 |
72b |
99 |
| 6 |
S4m44S4 |
441,930 |
26,791 |
1,558 |
2,551 |
| 7 |
S4m44S4m44 |
37,344 |
6,821 |
822b |
739 |
| 8 |
S24 |
448,802a |
43,706a |
1,346 |
1,175 |
| 9 |
S24m24 |
64,125a |
11,796 |
120a |
365a |
| 10 |
S24m24S24 |
390,945 |
41,152a |
1,231 |
1,209a |
| 11 |
S24m24S24m24 |
58,834a |
9,667 |
288a |
505a |
| 12 |
S48 |
291,436 |
39,194 |
813 |
613 |
| 13 |
S48m48 |
43,569 |
10,218a |
371b |
561a |
| 14 |
S96 |
430,111 |
35,546 |
1,099a |
791a |
| 15 |
ctrl1 |
11,143 |
4,780 |
474a |
878 |
| 16 |
ctrl8 |
12,009 |
2,349a |
1,923a |
1,304 |
| 17 |
SMK1 |
842,463a |
68,754 |
7,839 |
11,656 |
| 18 |
SMK4 |
989,008a |
50,822a |
7,805 |
10,246 |
| 19 |
SMK8 |
983,770 |
110,041 |
9,905 |
15,257 |
| 20 |
SMK4NTV4 |
1,653,793 |
133,320a |
3,036a |
2,031a |
| 21 |
SMK4ctrl4 |
16,159 |
2,023a |
981 |
1,284 |
No. of samples and sample codes are described in Tables 2 and 3. The peak areas were used to calculate the relative areas of each compound. aCV ≥ 30%, bCV ≥ 100%.
Trends in the target compounds observed in the short-term exposure experiment
Relative peak areas to No. 2 (S4) (i.e., S4 = 1.0) for single exposure experiments in Table 2 against the elapsed time after starting the exposure are plotted in Fig. 3. The figures for nicotine, nicotine N-oxide, myosmine and norharman are plotted separately in Figs. 3A, 3B, 3C and 3D, respectively. The transitions in the exposure state of each sample are described by the lines, which do not describe the linearity of the changes. The relative areas of the four compounds were higher in the 4 hr exposure sample (No. 2 (S4)) when compared with that of the control sample (No. 1 (c4)). Exposure for an additional 20 hr caused an increase in the areas of No. 8 (S24) for nicotine (Fig. 3A) and nicotine N-oxide (Fig. 3B), whereas the areas for myosmine (Fig. 3C) and norharman (Fig. 3D) did not increase. Further increases in the exposure duration did not increase the peak areas representing these compounds (No. 12 (S48) and No. 14 (S96)). The relative areas decreased following a change in medium, e.g., by 0.21 for nicotine in No. 4 (S4m20). Compared with No. 4 (S4m20), the areas of peaks for No. 5 (S4m44), which was cultured with fresh medium for 44 hr, were lowered further (0.08 as an example for nicotine). The compounds were absorbed once by the cells and then metabolized in and/or excreted from the cells; presumably accumulation of these compounds rarely occurred. The areas of peaks representing myosmine and norharman in samples exposed for 24 hr (No. 8 (S24)) were lower than those samples exposed for 4 hr (No. 2 (S4)), suggesting that uptake of these compounds occurred during the initial 4 hr period and that some fraction of these compounds were then metabolized and/or excreted from the cells during the remaining exposure period. With the exception of the peak representing nicotine, the peak areas in 96 hr samples (No. 14 (S96)) varied, which may be caused by the conditions of the cells varying after exposure for 96 hr.

The transition, including the repetition of exposure, No. 6 (S4m44S4), No. 7 (S4m44S4m44), No. 10 (S24m24S24) and No. 11 (S24m24S24m24) are plotted in Fig. 4. The results for nicotine, nicotine N-oxide, myosmine and norharman are plotted separately in Figs. 4A, 4B, 4C and 4D, respectively. In the graph, No. 10 (S24m24S24)) was not connected to No. 6 (S4m44S4) because No. 10 was not a transition of No.6, which should be ‘S24m24S4’ and was not tested in the experiment. The graph indicates the simple repetition of patterns in the first and second exposure, reflecting the repeat uptake, metabolism and excretion of compounds. From the pattern, the speed of uptake during the initial 4 hr in the secondary 24 hr exposure might not be that different to the first and second 4 hr exposures.
Thus, 4 hr exposure combined with subsequent medium exchange was selected as the repeat exposure in the switching study.
Effect of switching exposure of AqE from CS to NTV aerosol
Relative peak areas to the mean areas for corresponding compounds in the single exposure (No. 17 (SMK1)) were calculated (i.e. SMK1 = 1.0) for all samples presented in Table 3. The relative peak areas against the exposure counts are plotted in Fig. 5. The results for nicotine, nicotine N-oxide, myosmine and norharman are plotted separately in Figs. 5A, 5B, 5C and 5D, respectively. When the cells were exposed four times to the AqE (No. 18 (SMK4)), the relative peak area for each targeted compound did not change significantly from those observed for a single exposure. When the cells were exposed eight times to the AqE (No. 19, SMK8), the areas for nicotine (Fig. 5A) and myosmine (Fig. 5C) did not change significantly, whereas those for nicotine N-oxide (Fig. 5B) and norharman (Fig. 5D) increased. Because of the fluctuating trend versus exposure counts, more points of exposure counts are needed to clarify whether there is an accumulating trend. The area of No. 21 (SMK4ctrl4) was as low as those of No. 16 (ctrl8), indicating that the cells were still able to metabolize and excrete the compounds.

The effect of switching from AqE of CS to NTV aerosol was evaluated by calculating the relative exposure level (REL) from the relative peak area for each compound as follows:

where REL represents the exposure level relative to smoking cessation as a baseline, RASMK8, RASMK4ctrl4, and RASMK4NTV4 represent the relative peak areas of No. 19 (SMK8), No. 21 (SMK4ctrl4), and No. 20 (SMK4NTV4), respectively, which represent continuous smoking, smoking cessation, and switching to NTV, respectively.
The RELs for nicotine, nicotine N-oxide, myosmine and norharman were 1.69, 1.22, 0.23 and 0.05, respectively. The peak areas for myosmine and norharman found in No. 20 (SMK4NTV4) were clearly lower than those in No. 19 (SMK8); however, those for nicotine and nicotine N-oxide found in No. 20 (SMK4NTV4) were higher than those in No. 19 (SMK8). The results showed that switching to NTV leads to a clear reduction in myosmine and norharman, which are constituents of CS. Nicotine is a major constituent in NTV aerosols and CS, whereas nicotine N-oxide is a primary metabolite of nicotine. The nicotine concentrations of AqEs used for the last exposure of CS and NTV aerosol contained 0.867 µg/mL and 1.288 µg/mL, respectively (the ratio was 1.49). The result suggests that the peak areas for the two compounds directly correlate with the nicotine concentration present in the sample. In this study, the dilution factor for each AqE was determined before starting the experiments based on the number of puffs. Though the dilution factors were determined to result in similar nicotine concentrations, the actual nicotine concentration in the last-exposed AqE of NTV was 1.49-fold of that in CS. We could not set dilution factors giving the same nicotine concentration for all the samples for either the CS or NTV aerosols because the nicotine concentrations could not be measured during the exposure operations. The operation was completed within an hour of CS or NTV aerosol collection as the AqEs contain volatile compounds. Exposure experiments using multiple dilution factors for both the AqEs may yield complementary results.
Analytical aspects of the untargeted analysis of AqE-exposed 3D cells
Although CS-exposed 3D model cells often undergo transcriptome analysis, very few studies have reported a metabolome analysis. Zanetti et al. (2017) reported a metabolite analysis of 3D model cells directly exposed to CS for 4 hr by using (UP)LC-MS/MS. They reported a list of 482 compounds; however, most of the compounds identified were endogenous. Three of the four target compounds in our study, myosmine, norharman and nicotine N-oxide, were not included in this list because these compounds are not usually targeted in generic metabolomic analyses. For the first time we have shown the trends of such compounds inside repeat exposures to AqEs and under intermittent exposure conditions. Therefore, the untargeted approach has worked effectively for cells exposed to CS that have a very complex matrix.
Despite the coverage for such subject-specific compounds, the approach used in this study may have limited sensitivity. In the DDA mode, the full range of the m/z area was always scanned, which shows lower sensitivity than selective-reaction monitoring used in targeted approaches. The lower sensitivity causes a higher deviation in peak area values, which may mask real changes in peak areas of interest. Although we pooled three cell inserts for each analysis to raise constituent concentrations, we had to exclude most of the detected peaks because of insufficient peak areas and/or changes. Therefore, a targeted approach may be suitable for monitoring endogenous compounds.
Biological implications of the results
The ratio of uptake to metabolism and/or excretion of each compound would theoretically depend on their concentrations and the metabolic pathways associated with these compounds. Despite this, short-term exposure showed that four target compounds were experimentally taken up by the 3D cell culture, and their levels in these cells decreased following 20 hr of subsequent culturing in fresh medium. The switching study is a repetition of 4 hr exposure and subsequent culturing with fresh medium. Considering the trends shown in Fig. 5, these compounds did not show a clear accumulation, indicating that the cells were under an intermittent exposure period during the experiment.
An advantage of using 3D cells for the CS-exposure experiment is that whole CS, in a form of smoke, can be directly (i.e. without collection by bubbling) exposed to an apical layer of cells using the air-liquid interface. Repeated exposure of cells to CS was found to cause secretion of inflammatory mediators such as IL-8, GRO-α, IL-1β and GM-CSF, and repeated exposure to whole CS augmented the secretion process (Ishikawa and Ito, 2017). As cells were exposed to CS during an exposure time of once in 2 days, the results of the current study suggest that the augmentation effect is not caused by accumulation or retention of exogenous compounds but is indirectly caused by functional changes inside the cells. The results suggest that extracellular compounds inside cells basically reflect the exposure state outside of cells for both CS and NTV experiments. Thus, monitoring functional changes in long-term exposure experiments should be feasible.
A short-term clinical study reported that smokers who switched to NTV showed a decrease in levels for biomarkers that indicate CS exposure (Yuki et al, 2018). The study provides the difference in the state of exposure, whereas in vitro studies using 3D cells provide the difference in functional change and organizational morphology. The current study provides characteristics of 3D cells under intermittent exposure in view of the exposed state, as well as technical aspects of analyzing chemical constituents. Further studies clarifying the mechanisms of functional changes and factors that cause such responses will help validate assays using 3D cells for evaluating subchronic effects.
ACKNOWLEDGMENTS
We are grateful to Dr. Hitoshi Fujimoto for helpful discussions and suggestions on this research, Ms. Kanae Ishimori for technical support, Dr. Mai Tsukahara for valuable advice on the manuscript, and Mr. Hiroshi Ito and Ms. Asami Goto for the generation of CS and the NTV aerosol. We thank Edanz Group (https://en-author-services.edanzgroup.com/)for editing a draft of this manuscript.
Conflict of interest
This work was funded by the Japan Tobacco Inc., and all authors are employees of this company.
REFERENCES
- Baxter, A., Thain, S., Banerjee, A., Haswell, L., Parmar, A., Phillips, G. and Minet, E. (2015): Targeted omics analyses, and metabolic enzyme activity assays demonstrate maintenance of key mucociliary characteristics in long term cultures of reconstituted human airway epithelia. Toxicol. In Vitro, 29, 864-875.
- Benowitz, N.L., Hukkanen, J. and Jacob, P. 3rd. (2009): Nicotine chemistry, metabolism, kinetics and biomarkers. Handb. Exp. Pharmacol., 192, 29-60.
- Bentley, M.C., Almstetter, M., Arndt, D., Knorr, A., Martin, E., Pospisil, P. and Maeder, S. (2020): Comprehensive chemical characterization of the aerosol generated by a heated tobacco product by untargeted screening. Anal. Bioanal. Chem., 412, 2675-2685.
- CORESTA (2015): Routine analytical machine for e-cigarette aerosol generation and collection – Definitions and standard conditions. CORESTA recommended method Nº 81.
- Ishikawa, S. and Ito, S. (2017): Repeated whole cigarette smoke exposure alters cell differentiation and augments secretion of inflammatory mediators in air-liquid interface three-dimensional co-culture model of human bronchial tissue. Toxicol. In Vitro, 38, 170-178.
- Ishikawa, S., Matsumura, K., Kitamura, N., Takanami, Y. and Ito, S. (2019): Multi-omics analysis: repeated exposure of a 3D bronchial tissue culture to whole-cigarette smoke. Toxicol. In Vitro, 54, 251-262.
- ISO 20778:2018 (2018): Cigarettes -- Routine analytical cigarette smoking machine -- Definitions and standard conditions with an intense smoking regime. International Organization for Standardization, Geneva.
- ISO 3402:1999 (1999): Tobacco and tobacco products -- Atmosphere for conditioning and testing. International Organization for Standardization, Geneva.
- Ito, S., Matsumura, K., Ishimori, K. and Ishikawa, S. (2020): In vitro long-term repeated exposure and exposure switching of a novel tobacco vapor product in a human organotypic culture of bronchial epithelial cells. J. Appl. Toxicol., 40, 1248-1258.
- Knorr, A., Almstetter, M., Martin, E., Castellon, A., Pospisil, P. and Bentley, M.C. (2019): Performance evaluation of a nontargeted platform using two-dimensional gas chromatography time-of-flight mass spectrometry integrating computer-assisted structure identification and automated semiquantification for the comprehensive chemical characterization of a complex matrix. Anal. Chem., 91, 9129-9137.
- Mathon, C., Bovard, D., Dutertre, Q., Sendyk, S., Bentley, M., Hoeng, J. and Knorr, A. (2019): Impact of sample preparation upon intracellular metabolite measurements in 3D cell culture systems. Metabolomics, 15, 92.
- Munakata, S., Ishimori, K., Kitamura, N., Ishikawa, S., Takanami, Y. and Ito, S. (2018): Oxidative stress responses in human bronchial epithelial cells exposed to cigarette smoke and vapor from tobacco- and nicotine-containing products. Regul. Toxicol. Pharmacol., 99, 122-128.
- Pluskal, T., Castillo, S., Villar-Briones, A. and Orešič, M. (2010): MZmine 2: modular framework for processing, visualizing, and analyzing mass spectrometry-based molecular profile data. BMC Bioinformatics, 11, 395.
- R Core Team. (2016): R: A language and environment for statistical computing. R Foundation for Statistical Computing, Vienna, Austria.
- Rodgman, A. and Perfetti, T.A. (2013): The chemical components of tobacco and tobacco smoke, 2nd edition. CRC press, Boca Raton.
- Saigusa, D., Okamura, Y., Motoike, I.N., Katoh, Y., Kurosawa, Y., Saijyo, R., Koshiba, S., Yasuda, J., Motohashi, H., Sugawara, J., Tanabe, O., Kinoshita, K. and Yamamoto, M. (2016): Establishment of protocols for global metabolomics by LC-MS for biomarker discovery. PLoS One, 11, e0160555.
- Schymanski, E.L., Jeon, J., Gulde, R., Fenner, K., Ruff, M., Singer, H.P. and Hollender, J. (2014): Identifying small molecules via high resolution mass spectrometry: communicating confidence. Environ. Sci. Technol., 48, 2097-2098.
- Southam, A.D., Lange, A., Al-Salhi, R., Hill, E.M., Tyler, C.R. and Viant, M.R. (2014): Distinguishing between the metabolome and xenobiotic exposome in environmental field samples analysed by direct-infusion mass spectrometry based metabolomics and lipidomics. Metabolomics, 10, 1050-1058.
- Takahashi, Y., Kanemaru, Y., Fukushima, T., Eguchi, K., Yoshida, S., Miller-Holt, J. and Jones, I. (2018): Chemical analysis and in vitro toxicological evaluation of aerosol from a novel tobacco vapor product: A comparison with cigarette smoke. Regul. Toxicol. Pharmacol., 92, 94-103.
- Vorrink, S.U., Ullah, S., Schmidt, S., Nandania, J., Velagapudi, V., Beck, O., Ingelman-Sundberg, M. and Lauschke, V.M. (2017): Endogenous and xenobiotic metabolic stability of primary human hepatocytes in long-term 3D spheroid cultures revealed by a combination of targeted and untargeted metabolomics. FASEB J., 31, 2696-2708.
- Wishart, D.S., Feunang, Y.D., Marcu, A., Guo, A.C., Liang, K., Vázquez-Fresno, R., Sajed, T., Johnson, D., Li, C., Karu, N., Sayeeda, Z., Lo, E., Assempour, N., Berjanskii, M., Singhal, S., Arndt, D., Liang, Y., Badran, H., Grant, J., Serra-Cayuela, A., Liu, Y., Mandal, R., Neveu, V., Pon, A., Knox, C., Wilson, M., Manach, C. and Scalbert, A. (2018): HMDB 4.0: the human metabolome database for 2018. Nucleic Acids Res., 46 (D1), D608-D617.
- Yuki, D., Takeshige, Y., Nakaya, K. and Futamura, Y. (2018): Assessment of the exposure to harmful and potentially harmful constituents in healthy Japanese smokers using a novel tobacco vapor product compared with conventional cigarettes and smoking abstinence. Regul. Toxicol. Pharmacol., 96, 127-134.
- Zanetti, F., Titz, B., Sewer, A., Lo Sasso, G., Scotti, E., Schlage, W.K., Mathis, C., Leroy, P., Majeed, S., Torres, L.O., Keppler, B.R., Elamin, A., Trivedi, K., Guedj, E., Martin, F., Frentzel, S., Ivanov, N.V., Peitsch, M.C. and Hoeng, J. (2017): Comparative systems toxicology analysis of cigarette smoke and aerosol from a candidate modified risk tobacco product in organotypic human gingival epithelial cultures: A 3-day repeated exposure study. Food Chem. Toxicol., 101, 15-35.
- Zhang, L., Ashley, D.L. and Watson, C.H. (2011): Quantitative analysis of six heterocyclic aromatic amines in mainstream cigarette smoke condensate using isotope dilution liquid chromatography-electrospray ionization tandem mass spectrometry. Nicotine Tob. Res., 13, 120-126.
- Zhang, X., Wang, R., Zhang, L., Ruan, Y., Wang, W., Ji, H., Lin, F. and Liu, J. (2018): Simultaneous determination of tobacco minor alkaloids and tobacco-specific nitrosamines in mainstream smoke by dispersive solid-phase extraction coupled with ultra-performance liquid chromatography/tandem orbitrap mass spectrometry. Rapid Commun. Mass Spectrom., 32, 1791-1798.
