Abstract
In silico models for predicting chemical-induced side effects have become increasingly important for the development of pharmaceuticals and functional food products. However, existing predictive models have difficulty in estimating the mechanisms of side effects in terms of molecular targets or they do not cover the wide range of pharmacological targets. In the present study, we constructed novel in silico models to predict chemical-induced side effects and estimate the underlying mechanisms with high general versatility by integrating the comprehensive prediction of potential chemical-protein interactions (CPIs) with machine learning. First, the potential CPIs were comprehensively estimated by chemometrics based on the known CPI data (1,179,848 interactions involving 3,905 proteins and 824,143 chemicals). Second, the predictive models for 61 side effects in the cardiovascular system (CVS), gastrointestinal system (GIS), and central nervous system (CNS) were constructed by sparsity-induced classifiers based on the known and potential CPI data. The cross validation experiments showed that the proposed CPI-based models had a higher or comparable performance than the traditional chemical structure-based models. Moreover, our enrichment analysis indicated that the highly weighted proteins derived from predictive models could be involved in the corresponding functions of the side effects. For example, in CVS, the carcinogenesis-related pathways (e.g., prostate cancer, PI3K-Akt signal pathway), which were recently reported to be involved in cardiovascular side effects, were enriched. Therefore, our predictive models are biologically valid and would be useful for predicting side effects and novel potential underlying mechanisms of chemical-induced side effects.
INTRODUCTION
Pharmacological side effects are life-threatening and one of the major reasons for drug withdrawal after marketing (Siramshetty et al., 2016). Moreover, many active ingredients have been identified in food components, and several adverse events have been reported when these ingredients are consumed in excess (Lystrup and Leggit, 2015). Therefore, safety pharmacological evaluation plays a key role in the development of not only pharmaceuticals, but also functional foods, and the in silico model-based prediction of chemical-induced side effects in the early stages of development is gaining more and more attention to reduce the time and costs of research and development.
During the initial research of in silico prediction models, the models were constructed based on the idea that toxicity of a chemical is related to its structure [i.e., (Quantitative) Structure-Activity Relationship: (Q)SAR]. Although the use of the (Q)SAR approach provides critical conclusions, it cannot be used to estimate the biological mechanisms. Since the side effect-inducing substances interact with not only therapeutic target proteins, but also with unexpected proteins (off-targets), identifying the key off-targets is important to understand mode of actions and predict side effects.
On the other hand, several relationships between chemical-protein interactions (CPIs) and side effects have been found to date. For instance, astemizole, which is an inhibitor of histamine H1 receptors, and cisapride, which is a stimulator of 5-hydroxytryptamine (5-HT4), interact with the human ether-a-go-go-related gene (hERG) ion channel, and such events are known to be involved in QT prolongation (Finlayson et al., 2004; Tack et al., 2012). Thus, several in silico models for predicting side effects have been constructed by simulating interactions between chemical substances and their key off-targets (Chen and Ung, 2001; Wang et al., 2013). Otherwise, models have been derived by a machine learning technique using the “known CPI-side effect profiles” as the training data (Chen et al., 2013; Yamanishi et al., 2012). However, these models could be improved for practical use since the known CPI data were quite limited, and many missing CPIs must be included in the reference data. Furthermore, because of the same reason, these models cannot be used for identifying novel mechanisms important for predicting side effects. Therefore, if the CPI data treated as a training set are sufficiently expanded, in silico models could predict side effects more precisely and thus contribute to the identification of molecular targets that induce side effects.
To expand the CPI data, an in vitro profiling assay is considered useful as it can identify direct CPIs (Bowes et al., 2012; Lee and Lee, 2016). However, this assay requires extensive efforts and resources to fill the missing CPI data, and the extensibility is not high because of the limited number of evaluable proteins. Therefore, the in silico interactome analysis, which is categorized into docking-based and ligand-based types, is considered as an alternative way to expand the CPI data. Although the docking-based analysis could predict the binding pocket of a target protein (LaBute et al., 2014; Wallach et al., 2010) and has been employed to construct prediction models (LaBute et al., 2014; Liu and Altman, 2015), the predictability was limited because of the requirement of 3D protein structure data. Alternatively, the ligand-based analysis, in which compounds are represented as descriptors, could predict all target proteins when at least one ligand is known. Therefore, the ligand-based analysis is a more favorable approach for predicting unknown CPIs comprehensively than the docking-based analysis. However, a few studies expanded the CPI data using the ligand-based analysis to construct in silico side effect predictive models (Zhou et al., 2015).
Thus, in the present study, we developed side effect prediction models for the diseases of the cardiovascular system (CVS), gastrointestinal system (GIS), and central nervous system (CNS) by employing the known and predicted (unknown) CPI data (Fig. 1). The unknown CPI data were predicted by the ligand-based method, and the L1-regularized logistic regressions were employed in side effect prediction to identify the molecular targets important for predicting side effects. The L1/L2-regularized logistic regressions have been used to identify important molecules and to predict toxicity (Liu et al., 2017). Moreover, the proteins that were weighted in the L1-regularized logistic regressions were subjected to enrichment and pathway analyses to interpret their biological meanings. The enriched function should have some relationship with the predicted side effect and thus the derived important protein sets could provide new insights into safety pharmacology.
MATERIALS AND METHODS
Side effect data
The information regarding the side effects of compounds was obtained from the SIDER database (http://side effects.embl.de/). In this study, we focused on the side effect terms involving CVS, GIS, and CNS. We removed the side effects that were associated with less than ten compounds because it would be difficult to perform machine learning on such rare side effects. This process produced a dataset consisting of 1,320 compounds and 61 side effect terms (CVS; 36, GIS; 10, CNS; 15), and these compounds cover all anatomical therapeutic chemical (ATC) classifications (Fig. 2 and Table 1). This dataset was used as the gold standard data in the cross-validation experiment during performance evaluation. The compounds in a set were called “reference compounds” in this study. Each compound was represented by a high-dimensional feature vector y = (y1, y2,..., yq)T, where each element encodes for the presence and absence of each of the side effect terms by 1 and −1, respectively, and q is the number of side effects. The feature vector is referred to as the “side effect profile”.

Table 1. Side effects predicted in this study and their counts reported in the SIDER database.

Chemical structure data
The accuracy of the statistical model depends heavily on the kinds of chemical descriptors or fingerprints. To date, many descriptors and fingerprints, such as ECFP (Rogers and Hahn, 2010), FCFP (Rogers et al., 2005), Estate (Hall and Kier, 1995), Dragon (http://talete.mi.it/products/dragon_description.htm), MACCS (Durant et al., 2002), and PubChem (Chen et al., 2009), have been reported. Among them, the KEGG Chemical Function and Substructures (KCF-S) descriptors (Kotera et al., 2013), which showed the highest predictive performance in the CPI prediction of drugs (Sawada et al., 2014), was employed in this study.
In this study, 24,401 chemical substructures were used. Each compound was represented by a high-dimensional feature vector x(chem) = (x1, x2,..., xp_chem)T, where each element encodes for the frequency of a chemical substructure defined by KCF-S by an integer, and p_chem is the number of chemical substructures. The feature vector is referred to as the “chemical structure profile”. In addition to the KCF-S descriptor, compounds were also represented by ECFP, FCFP, Estate, Dragon, MACCS, and PubChem for performance comparison (Table 2). For the KCF-S descriptor, we implemented the procedure proposed in previous work (Kotera et al., 2013). For the Dragon descriptor, we used the commercial software Dragon 6. For the other descriptors (ECFP, FCFP, Estate, MACC, and PubChem), we used Python and RDKit library (http://www.rdkit.org). We used the default setting for the calculation of each descriptor and used compounds for which the descriptors were calculated. The three dimensional chemical structures were not used; however, the two dimensional chemical structures in spatial data file format were used in this study.
Table 2. Chemical structure descriptors used in this study.
| Name |
KCF-S |
ECFP |
FCFP |
Estate |
Dragon |
MACCS |
PubChem |
Klekota Roth |
| descriptor number |
24,401 |
1,024 |
1024 |
79 |
4,885 |
166 |
881 |
4,860 |
Target protein data
CPIs were obtained from seven public databases: ChEMBL (Bento et al., 2014), MATADOR (Günther et al., 2008), DrugBank (Knox et al., 2011), Psychoactive Drug Screening Program Ki (Roth et al., 2000), KEGG DRUG (Kanehisa et al., 2010), BindingDB (Liu et al., 2007), and Therapeutic Target Database (Zhu et al., 2012). For experimental data, we selected only the CPI pairs that were clearly denoted as active interactions or had binding affinities of <1 μM (e.g., IC50) following a previous study (Keiser et al., 2009); this yielded 1,179,848 CPIs involving 824,143 compounds and 3,905 proteins. Each compound was represented by a high-dimensional feature vector x(target) = (x1, x2,..., xp_target)T, where each element encodes for the presence and absence of each target protein by 1 and 0, respectively, and p_target is the number of target proteins in the training set. The feature vector is referred to as the “target protein profile”.
Limited target protein information is available. In practical applications, all compounds do not always have target protein information, and their off-target proteins remain mostly unknown. To overcome this limitation, we proposed to identify the potential target proteins of compounds based on their chemical structures in the framework of ligand-based approaches. After completing the target protein profiles for reference and query compounds, the side effect prediction was performed (see “Target protein prediction” subsection for more details).
Sparsity-induced classifier
We overcame the problems associated with the prediction of both side effects and target proteins in the framework of supervised classification. We used a sparsity-induced classifier, a sparse modeling technique for easier interpretability. A brief review of this methodology is presented below.
A classifier is constructed by a linear model that represents each sample (e.g., a compound in this study) by the feature vector representation x ∈ Rd, where d is the number of features. It then estimates a linear function f (x) = wTx, and the resulting sign is used to predict whether the sample is classified as positive or negative (e.g., presence or absence of a side effect in this study). The weight vector w ∈ Rd is estimated based on its ability to correctly predict the classes of samples in the training set. Since each element of the feature vector x corresponds to an element of its weight vector w, it is possible to determine effective features contributing to the prediction by sorting the elements of x according to the weight values of w.
Here, we constructed a predictive model by using the logistic regression algorithm. The weight vector in a model is determined by minimizing an objective function with regularization. The use of regularization is necessary to allow models to generalize to unseen data, particularly if the number of features is very high relative to the number of samples in the training data. A common approach is the L2 regularization, but the resulting weight vector tends to have many non-zero elements, which makes it difficult to interpret the model. Another approach is the L1 regularization that forces most elements in the weight vector to have zero values, and the resulting weight vector tends to be sparse, making it easier to interpret the model. The operation with L1 regularization is suitable for handling high-dimensional feature vectors because it enables us to extract representative features in the descriptor and solve the feature redundancy problem. Here, we used logistic regression with L1 regularization, referred to as “L1-regularized logistic regression”.
Given a training set of n samples and labels , a logistic regression model is formulated by minimizing its loss function. To induce sparsity, the weight vector in the logistic regression model is optimized with L1 regularization as follows:

where ||w||1 is the L1 norm (the sum of absolute values in the vector) and C is a hyper-parameter to control over-fitting. In the minimization problem, we emphasized the error terms for positive samples more than those for negative examples to solve the unbalanced problem. The cut-off value for the probability of logistic regression was set to 0.5.
Side effect prediction
We predicted the potential side effect profile of a query compound from its target protein profile x(target) using L1-regularized logistic regression. Given a learning set of n compounds with the labels on q side effects, we constructed q sparsity-induced classifiers that would predict whether a query compound causes the j-th side effect (j=1,2,…,q). Our task also included extracting discriminative features (e.g., informative target proteins) that positively contribute to the prediction of the j-th side effect. The hyper-parameter in the model was optimized for each side effect by grid searches based on cross-validation.
Target protein prediction
Given that the target proteins of a query compound are mostly unknown, we predicted the potential target protein profile x(target) of a query compound from its chemical structure profile x(chem), utilizing L1-regularized logistic regression. Given a learning set of n compounds with the labels on r target proteins, we constructed r sparsity-induced classifiers that would predict whether a query compound interacts with the k-th target protein (k=1,2,…,r). The hyper-parameter in the model was optimized for each target protein by grid searches based on cross-validation.
Performance evaluation
We employed 5-fold cross-validation experiments; the compounds in the gold standard set were split into five subsets of roughly equal size. Each subset in turn was taken as a test set, and a predictive model was learned on the remaining four subsets. The model was applied to the test compounds, and the accuracy of the test set was evaluated. The same experimental conditions were retained, using the same training and test compounds across all methods in each cross-validation fold.
We evaluated the predictive performance of the model by using the receiver operating characteristic (ROC) and precision-recall (PR) curves. The ROC curve is a plot of true positive rates against false positive rates, and the area under the ROC curve (AUC) returns a score of 1 for perfect inference and 0.5 for random inference. The PR curve shows a plot of precision (positive predictive value) against recall (sensitivity), and the area under the PR curve (AUPR) returns a score of 1 for perfect inference and the ratio of positive samples to all samples for random inference. The hyper-parameters in each method were optimized using grid searches with the AUC and AUPR scores as objective functions. It is known that the PR curve is more practical than the ROC curve, especially when the number of positive samples is much less than that of negative samples (Davis and Goadrich, 2006). For the numerical investigations, we used two cores of Intel Xeon Gold 6154 (3.0 GHz, 18 cores) with 192 GB of memory.
Biological interpretation of constructed models
In L1-regularized logistic regressions, the positively weighted target proteins are considered to be associated with the cause of side effects. To analyze the biological meaning of the weighted proteins, we used enrichment and pathway analyses. However, since functionally different side effects existed in one category (e.g., electrophysiological and mental side effects in CNS), we focused on the proteins involving side effects with similar symptoms to make it easier to understand the results of enrichment analyses. We re-defined the categories of similar side effects as electrocardiogram (tachycardia, arrhythmia, atrial fibrillation, ventricular tachycardia, and ventricular fibrillation) in CVS, enterokinesis-related pain (abdominal pain, gastrointestinal pain, constipation, dyspepsia, and abdominal tenderness) in GIS, and motor function (convulsion, ataxia, gait disturbance, dyskinesia, and myoclonus) in CNS.
First, the target proteins with positive weight were summarized in each side effect category and input as gene list corresponding to the proteins to conduct an enrichment clustering analysis using the Database for Annotation, Visualization and Integration Discovery (DAVID) v6.8 (https://david.ncifcrf.gov/), according to a previous study (Huang et al., 2009). The enrichment clustering analysis was conducted on each side effect categories of CVS, GIS, and CNS, using the KEGG pathway and Gene Ontology-biological process terms. Since the enrichment of various annotations makes biological interpretation difficult, a functional annotation clustering analysis could combine several annotations composed of similar proteins into a single category to reduce the redundancy (https://david.ncifcrf.gov/helps/functional_annotation.html#E4). The annotations in the clusters of high enrichment score should be associated with the cause of the corresponding side effect. Furthermore, the functions and diseases relating to proteins in the annotations in enriched clusters were explored by Ingenuity® Pathway Analysis (IPA, Ingenuity Systems, Qiagen, Redwood City, CA, USA). Using the IPA software, the target proteins were set as query compounds and the relating functions and diseases were identified from the knowledge of literatures and Ingenuity® original database.
RESULTS
Performance evaluation on side effect prediction
The distribution of the known CPI numbers of evaluated proteins and the AUC of CPI prediction are summarized in Fig. 3. Performance evaluation and comparison to previous approaches, which included the chemical structure-based models using seven descriptors (ECFP, FCFP, Estate, Dragon, MACCS, PubChem, and KCF-S) and known CPI-based model using the same dataset, are shown in Fig. 4. Table 3, Table 4, and Table 5 show the performance of the CVS, GIS, and CNS models, respectively. Among the chemical structure-based models, KCF-S worked the best in most cases, suggesting that KCF-S could capture more relevant information from the chemical graph structures of compounds for accurate side effect prediction. Moreover, it was observed that the proposed CPI-based model worked better than or was comparable to the chemical structure-based model. In particular, the CPI-based model outperformed the chemical structure-based model for CVS and GIS in terms of higher AUC and AUPR scores and for CNS in terms of higher AUPR. In the case of CNS, the AUC score of the chemical structure-based model with KCF-S was slightly higher than that of the CPI-based model, but the difference was very small. Moreover, the proposed model outperformed the known CPI-based model in sensitivity for all categories. Since sensitivity was considered important in the screening that focused on detecting the hidden side effects, these results suggest that the known and newly estimated target protein profiles are useful for side effect prediction.


Table 3. Average of performance measures of individual side effects for cardiovascular system. Bold:the highest values among methods.
| Method |
AUC |
AUPR |
Sensitivity |
Specificity |
Accuracy |
| Chemical profile: ECFP |
0.6367 |
0.2057 |
0.4223 |
0.8975 |
0.8634 |
| Chemical profile: FCFP |
0.6572 |
0.2042 |
0.4434 |
0.8993 |
0.8649 |
| Chemical profile: Estate |
0.608 |
0.1373 |
0.5388 |
0.8651 |
0.8414 |
| Chemical profile: Dragon |
0.6319 |
0.1568 |
0.444 |
0.8883 |
0.8545 |
| Chemical profile: MACCS |
0.6327 |
0.152 |
0.4689 |
0.864 |
0.8389 |
| Chemical profile: PubChem |
0.6555 |
0.1816 |
0.4739 |
0.88 |
0.8494 |
| Chemical profile: KlekotaRoth |
0.6455 |
0.1877 |
0.4738 |
0.8943 |
0.8624 |
| Chemical profile: KCF-S |
0.6618 |
0.2031 |
0.5189 |
0.9097 |
0.8739 |
| Target profile: known target proteins only |
0.6104 |
0.193 |
0.3783 |
0.9886 |
0.9019 |
| Target profile: known and newly estimated target proteins |
0.668 |
0.2201 |
0.4902 |
0.898 |
0.8636 |
Table 4. Average of performance measures of individual side effects for gastrointestinal system. Bold:the highest values among methods.
| Method |
AUC |
AUPR |
Sensitivity |
Specificity |
Accuracy |
| Chemical profile: ECFP |
0.6156 |
0.3838 |
0.4914 |
0.7329 |
0.7402 |
| Chemical profile: FCFP |
0.6063 |
0.3922 |
0.5188 |
0.7427 |
0.7371 |
| Chemical profile: Estate |
0.6033 |
0.361 |
0.5835 |
0.6723 |
0.7262 |
| Chemical profile: Dragon |
0.6066 |
0.3758 |
0.4828 |
0.7468 |
0.7446 |
| Chemical profile: MACCS |
0.6538 |
0.3883 |
0.5457 |
0.74 |
0.7438 |
| Chemical profile: PubChem |
0.6112 |
0.3838 |
0.5196 |
0.7363 |
0.7461 |
| Chemical profile: KlekotaRoth |
0.6318 |
0.3844 |
0.5522 |
0.7465 |
0.7461 |
| Chemical profile: KCF-S |
0.6324 |
0.397 |
0.5628 |
0.7634 |
0.7596 |
| Target profile: known target proteins only |
0.619 |
0.3944 |
0.3894 |
0.9561 |
0.7342 |
| Target profile: known and newly estimated target proteins |
0.6736 |
0.4167 |
0.5464 |
0.8043 |
0.7542 |
Table 5. Average of performance measures of individual side effects for central nervous system. Bold:the highest values among methods.
| Method |
AUC |
AUPR |
Sensitivity |
Specificity |
Accuracy |
| Chemical profile: ECFP |
0.6486 |
0.3462 |
0.5 |
0.7836 |
0.7397 |
| Chemical profile: FCFP |
0.6575 |
0.3454 |
0.5141 |
0.7867 |
0.7394 |
| Chemical profile: Estate |
0.601 |
0.2946 |
0.5816 |
0.658 |
0.6733 |
| Chemical profile: Dragon |
0.6645 |
0.3283 |
0.5327 |
0.7826 |
0.7366 |
| Chemical profile: MACCS |
0.661 |
0.3302 |
0.5828 |
0.731 |
0.7186 |
| Chemical profile: PubChem |
0.6764 |
0.3491 |
0.5567 |
0.7663 |
0.7293 |
| Chemical profile: KlekotaRoth |
0.6783 |
0.3601 |
0.5498 |
0.7777 |
0.737 |
| Chemical profile: KCF-S |
0.6989 |
0.3761 |
0.5587 |
0.8109 |
0.7615 |
| Target profile: known target proteins only |
0.6656 |
0.3882 |
0.4825 |
0.9595 |
0.7815 |
| Target profile: known and newly estimated target proteins |
0.6869 |
0.3866 |
0.5602 |
0.7936 |
0.7496 |
Biological meaning of the predictive model
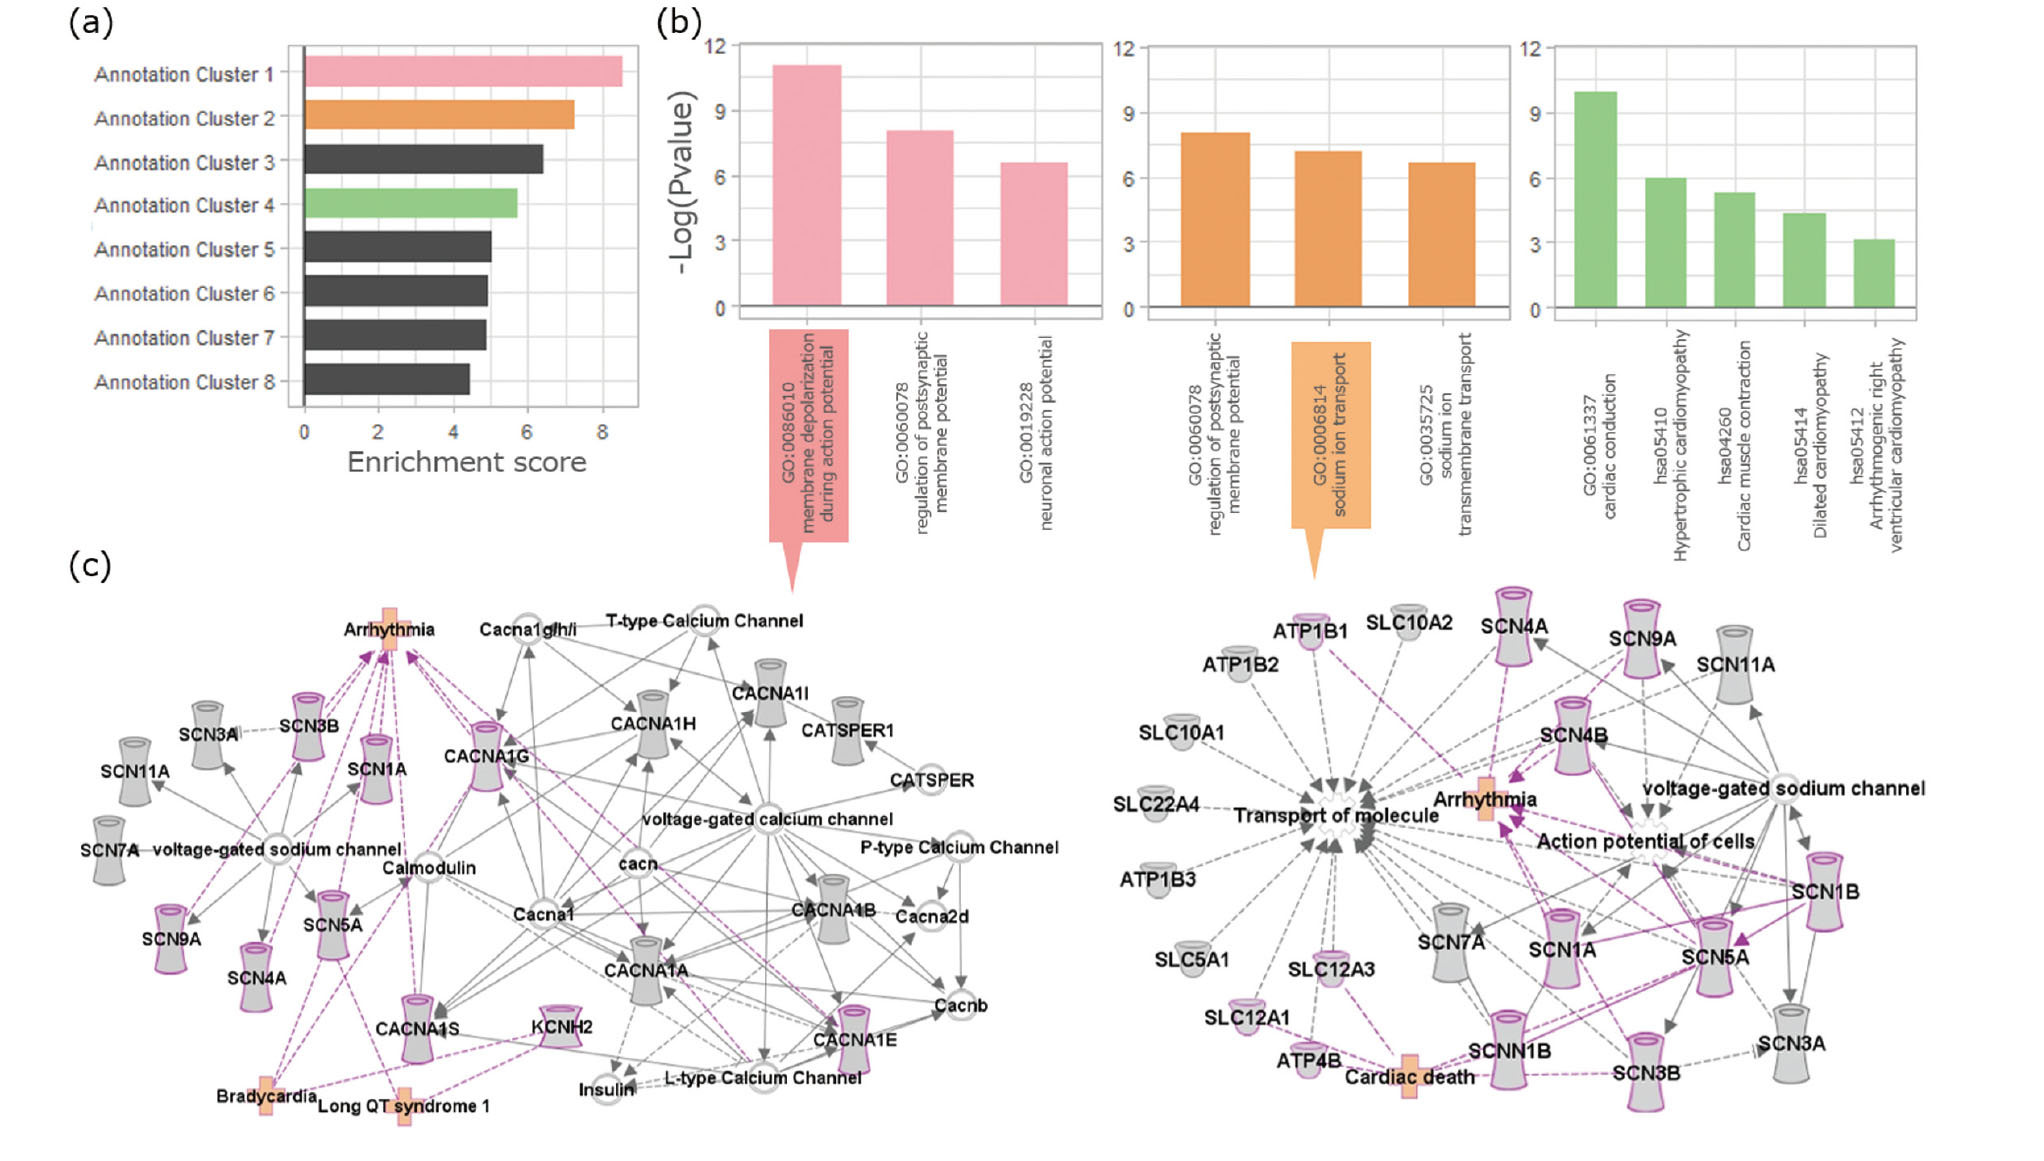
The −log(p-value) of the annotations in the highly enriched cluster and its pathways were drawn by IPA (Figs. 5-7). To confirm the validity of the predicted models, we focused on the functions and diseases relating to the weighed proteins in prediction models. In the CVS, the membrane depolarization during action potential (GO:0086010) in cluster 1 and sodium ion transporter-related functions (GO:0006814, GO:0035725) in cluster 2, which are considered as the key functions in the CVS, were highly enriched (Fig. 5). In fact, the cardiotoxic terms arrhythmia, bradycardia, and long QT syndrome 1 were detected as the diseases related to the proteins of GO:0086010 in IPA. Moreover, annotation cluster 4 was composed of the annotations related to CVS function. In the GIS model, cluster 3 included GIS-related pathways such as, gastric acid secretion (hsa04971), pancreatic secretion (hsa04972), and insulin secretion (hsa04911) (Fig. 6). Abnormal morphology of gastric parietal cells and gastric adenocarcinoma were detected, relating disease with proteins in these annotations. Additionally, synaptic activities, such as postsynaptic membrane potential (GO:0060078) and neuronal action potential (GO:0019228), were enriched in cluster 2 of the CNS model (Fig. 7). Furthermore, annotation cluster 3 was composed of the neurotransmission system-related pathways, such as, morphine addiction (hsa05032), retrograde endocannabinoid signaling (hsa04723), GABAergic synapse (hsa04727), and nicotine addiction (hsa05033). Lastly, cluster 5 in the CNS model included synaptic transmission (GO:0007271). Seizure, Myoclonic dystonia, and Localization-related Epilepsy were further detected, relating disease with proteins in GO:0019228. All proteins employed in the enrichment analysis and its results, which include annotation terms, composing gene names, and p-values of the top five enrichment clusters, are shown in supplementary Tables 1 and 2.
DISCUSSION
In silico prediction models for 61 side effects on CVS, GIS, and CNS were constructed using sparsity-induced classifiers. We revealed that the accuracies of the present CPI models, which were derived via predicting comprehensive potential CPIs (CVS: AUC = 0.67 and AUPR = 0.22, GIS: 0.67 and 0.42, CNS: 0.69 and 0.39), are equivalent or greater than the chemical structure-based models and known CPI-based models. Especially in CVS and GIS, the present models showed the highest performances in AUC and AUPR. Previously, Mizutani et al. (2012) proposed a prediction model for drug side effects with known CPI data and predicted 1,339 side effects on the basis of 5,074 CPIs using sparse canonical correlation analysis (SCCA), and Zhang et al. (2015) improved the SCCA model by employing the multi-label learning method. The main objective of these previous works was to extract the correlated sets of proteins and side effects, and it was difficult to extract important proteins specific to each side effect in the framework of SCCA. In addition, the use of only known CPIs suffers from the lack of biological interpretability and prediction coverage. The comprehensive prediction of CPIs could contribute to the improvement in SCCA model performance.
Our proposed method has a unique function to predict key target proteins for each side effect, while it was difficult for the previous models to predict novel CPIs because of the limitation of training data. Indeed, the enrichment analysis revealed that the weighted proteins in predictive models were involved in the biological functions related to the predicted side effects. In CVS, some weighted proteins [voltage-dependent T-type calcium channel subunit alpha-1G (CACNA1G), potassium voltage-gated channel subfamily H member 2 (KCNH2), and sodium channel protein type 5 subunit alpha (SCN5A)] were known to be associated with arrhythmia and Long QT syndrome when it was inactivated or mutated (Green et al., 2013; Kapplinger et al., 2009; Mangoni et al., 2006; Neu et al., 2010). In CNS, the dysfunction or mutation of sodium channel type 3 subunit alpha (SCN3A)/ subunit beta-2 (SCN2B), voltage-dependent P/Q-type calcium channel subunit alpha-1A (CACNA1A), and gamma-aminobutyric acid (GABA) receptors were reported to cause epilepsy and seizure (Andrade, 2009; Chen et al., 2002; Jouvenceau et al., 2001; Zaman et al., 2018). Moreover, the PKG/PKA-PLCβ pathway was suspected to be associated with the post-diabetes gastric motility disorder (Guo et al., 2018) of GIS. These results indicated that the proposed models correctly weighted the target proteins, and the investigation of weighted proteins would be useful for understanding the complex mechanisms of various side effects.
Moreover, investigating target proteins in enriched annotations, which have not been reported to have a direct relationship with predicted side effects, might aid further understanding of side effects. For instance, annotation cluster 3 in the CVS model is composed of cancer-related annotations including, prostate cancer (hsa05215), pathways in cancer (hsa05200), and PI3K-Akt signaling pathway (hsa04151). These annotations were not directly related to CVS; however, some drugs used in cancer chemotherapy were reported to induce cardiotoxicity. For instance, anthracycline drugs (e.g., doxorubicin) and molecular targeting drugs (e.g., trastuzumab) were considered to cause cardiotoxicity via cardiomyocyte toxicity and disruption of biological pathways, respectively (Chang et al., 2017; Guglin et al., 2008; Yeh et al., 2004). Likewise, the other proteins in the annotation clusters identified in the present study might be the novel targets of side effects.
These models can be used to estimate the abilities of chemical substances to induce side effects via CPI prediction based on chemical structure descriptors; however, these models are not applicable to chemicals with unknown chemical structures and it is difficult to apply these models to mixtures of chemicals. Therefore, when the models are applied to the estimation of functional food products, the determination of chemical structure is required. Moreover, there are several limitations to this study. First, the amount of learning data and accuracy are different among models. Therefore, when positive results were predicted by models, the model user should pay attention to the model accuracy (sensitivity and specificity) to verify the reliability. Second, we could not verify specificities of weighted proteins because negative data (such as “Protein X is not related to Side Effect A”) was not available in general. Therefore, further experiments are needed to confirm whether the weighted proteins truly interact with the chemicals and are associated with the side effects. An in vitro protein binding assay would derive correct CPIs and improve model accuracies.
In conclusion, we first applied a comprehensive CPI prediction to construct the in silico prediction models for side effects. Integrating the predicted CPI data with the known CPI data contributed to the improvement of model accuracies. Furthermore, the biological processes suggested by enrichment analyses corresponded to the side effect responses; therefore, the models were considered scientifically valid. The proteins identified in this study could be involved in novel mechanisms and could provide new insights into safety pharmacology; however, further experiments are required to confirm this. Nowadays, the testing based on molecular mechanisms rather than animals has become important to animal welfare as well as efficient research and development. Furthermore, in addition to drugs, the pharmacological evaluation of functional food ingredients has attracted much attention for various reasons (Amano et al., 2019). Therefore, we hope that the present models contribute to promoting efficient drug development, developing novel in vitro tests using identified key molecular targets, reducing animal testing, and evaluating various types of chemicals (e.g., food ingredients and industrial chemicals).
ACKNOWLEDGMENTS
We are grateful to the members of the Japanese Society of Toxicology for their discussions related to this study at their 46th annual meeting in 2019.
Conflict of interest
The authors declare that there is no conflict of interest.
REFERENCES
- Amano, Y., Honda, H., Nukada, Y., Ikeda, N., Yamane, M., Nakano, K., Kameyama, A. and Morita, O. (2019): Safety pharmacological evaluation of the coffee component, caffeoylquinic acid, and its metabolites, using ex vivo and in vitro profiling assays. Pharmaceuticals (Basel), 12, 110.
- Andrade, D.M. (2009): Genetic basis in epilepsies caused by malformations of cortical development and in those with structurally normal brain. Hum. Genet., 126, 173-193.
- Bento, A.P., Gaulton, A., Hersey, A., Bellis, L.J., Chambers, J., Davies, M., Krüger, F.A., Light, Y., Mak, L., McGlinchey, S., Nowotka, M., Papadatos, G., Santos, R. and Overington, J.P. (2014): The ChEMBL bioactivity database: an update. Nucleic Acids Res., 42, D1083-D1090.
- Bowes, J., Brown, A.J., Hamon, J., Jarolimek, W., Sridhar, A., Waldron, G. and Whitebread, S. (2012): Reducing safety-related drug attrition: the use of in vitro pharmacological profiling. Nat. Rev. Drug Discov., 11, 909-922.
- Chang, H.M., Moudgil, R., Scarabelli, T., Okwuosa, T.M. and Yeh, E.T. (2017): Cardiovascular Complications of Cancer Therapy: Best practices in diagnosis, prevention, and management: Part 1. J. Am. Coll. Cardiol., 70, 2536-2551.
- Chen, B., Wild, D. and Guha, R. (2009): PubChem as a source of polypharmacology. J. Chem. Inf. Model., 49, 2044-2055.
- Chen, C., Bharucha, V., Chen, Y., Westenbroek, R.E., Brown, A., Malhotra, J.D., Jones, D., Avery, C., Gillespie, P.J. 3rd, Kazen-Gillespie, K.A., Kazarinova-Noyes, K., Shrager, P., Saunders, T.L., Macdonald, R.L., Ransom, B.R., Scheuer, T., Catterall, W.A. and Isom, L.L. (2002): Reduced sodium channel density, altered voltage dependence of inactivation, and increased susceptibility to seizures in mice lacking sodium channel β 2-subunits. Proc. Natl. Acad. Sci. USA, 99, 17072-17077.
- Chen, L., Huang, T., Zhang, J., Zheng, M.Y., Feng, K.Y., Cai, Y.D. and Chou, K.C. (2013): Predicting drugs side effects based on chemical-chemical interactions and protein-chemical interactions. BioMed Res. Int., 2013, 485034.
- Chen, Y.Z. and Ung, C.Y. (2001): Prediction of potential toxicity and side effect protein targets of a small molecule by a ligand-protein inverse docking approach. J. Mol. Graph. Model., 20, 199-218.
- Davis, J. and Goadrich, M. (2006): The Relationship Between Precision-Recall and ROC Curves. In: Proceedings of the Twenty Third International Conference on Machine Learning; Pittsburgh, PA, June 25-29, 2006 (Cohen, W. and Moore, A., Ed.), pp.233-240, ACM Press, PA.
- Durant, J.L., Leland, B.A., Henry, D.R. and Nourse, J.G. (2002): Reoptimization of MDL keys for use in drug discovery. J. Chem. Inf. Comput. Sci., 42, 1273-1280.
- Finlayson, K., Witchel, H.J., McCulloch, J. and Sharkey, J. (2004): Acquired QT interval prolongation and HERG: implications for drug discovery and development. Eur. J. Pharmacol., 500, 129-142.
- Green, R.C., Berg, J.S., Grody, W.W., Kalia, S.S., Korf, B.R., Martin, C.L., McGuire, A.L., Nussbaum, R.L., O’Daniel, J.M., Ormond, K.E., Rehm, H.L., Watson, M.S., Williams, M.S. and Biesecker, L.G.; American College of Medical Genetics and Genomics. (2013): ACMG recommendations for reporting of incidental findings in clinical exome and genome sequencing. Genet. Med., 15, 565-574.
- Guglin, M., Cutro, R. and Mishkin, J.D. (2008): Trastuzumab-induced cardiomyopathy. J. Card. Fail., 14, 437-444.
- Günther, S., Kuhn, M., Dunkel, M., Campillos, M., Senger, C., Petsalaki, E., Ahmed, J., Urdiales, E.G., Gewiess, A., Jensen, L.J., Schneider, R., Skoblo, R., Russell, R.B., Bourne, P.E., Bork, P. and Preissner, R. (2008): SuperTarget and Matador: resources for exploring drug-target relationships. Nucleic Acids Res., 36, D919-D922.
- Guo, J.Y., Zhang, M.H., Jiang, J.Z., Piao, L.H., Fang, X.S., Jin, Z. and Cai, Y.L. (2018): The role of CNP-mediated PKG/PKA-PLCβ pathway in diabetes-induced gastric motility disorder. Peptides, 110, 47-55.
- Hall, L.H. and Kier, L.B. (1995): Electrotopological state indices for atom types: A novel combination of electronic, topological, and valence state information. J. Chem. Inf. Comput. Sci., 35, 1039-1045.
- Huang, W., Sherman, B.T. and Lempicki, R.A. (2009): Systematic and integrative analysis of large gene lists using DAVID bioinformatics resources. Nat. Protoc., 4, 44-57.
- Jouvenceau, A., Eunson, L.H., Spauschus, A., Ramesh, V., Zuberi, S.M., Kullmann, D.M. and Hanna, M.G. (2001): Human epilepsy associated with dysfunction of the brain P/Q-type calcium channel. Lancet, 358, 801-807.
- Kanehisa, M., Goto, S., Furumichi, M., Tanabe, M. and Hirakawa, M. (2010): KEGG for representation and analysis of molecular networks involving diseases and drugs. Nucleic Acids Res., 38, D355-D360.
- Kapplinger, J.D., Tester, D.J., Salisbury, B.A., Carr, J.L., Harris-Kerr, C., Pollevick, G.D., Wilde, A.A. and Ackerman, M.J. (2009): Spectrum and prevalence of mutations from the first 2,500 consecutive unrelated patients referred for the FAMILION ® long QT syndrome genetic test. Heart Rhythm, 6, 1297-1303.
- Keiser, M.J., Setola, V., Irwin, J.J., Laggner, C., Abbas, A.I., Hufeisen, S.J., Jensen, N.H., Kuijer, M.B., Matos, R.C., Tran, T.B., Whaley, R., Glennon, R.A., Hert, J., Thomas, K.L., Edwards, D.D., Shoichet, B.K. and Roth, B.L. (2009): Predicting new molecular targets for known drugs. Nature, 462, 175-181.
- Knox, C., Law, V., Jewison, T., Liu, P., Ly, S., Frolkis, A., Pon, A., Banco, K., Mak, C., Neveu, V., Djoumbou, Y., Eisner, R., Guo, A.C. and Wishart, D.S. (2011): DrugBank 3.0: a comprehensive resource for ‘Omics’ research on drugs. Nucleic Acids Res., 39, D1035-D1041.
- Kotera, M., Tabei, Y., Yamanishi, Y., Moriya, Y., Tokimatsu, T., Kanehisa, M. and Goto, S. (2013): KCF-S: KEGG Chemical Function and Substructure for improved interpretability and prediction in chemical bioinformatics. BMC Syst. Biol., 7 (Suppl 6), S2.
- LaBute, M.X., Zhang, X., Lenderman, J., Bennion, B.J., Wong, S.E. and Lightstone, F.C. (2014): Adverse drug reaction prediction using scores produced by large-scale drug-protein target docking on high-performance computing machines. PLoS One, 9, e106298.
- Lee, H. and Lee, J.W. (2016): Target identification for biologically active small molecules using chemical biology approaches. Arch. Pharm. Res., 39, 1193-1201.
- Liu, S., Kawamoto, T., Morita, O., Yoshinari, K. and Honda, H. (2017): Discriminating between adaptive and carcinogenic liver hypertrophy in rat studies using logistic ridge regression analysis of toxicogenomic data: the mode of action and predictive models. Toxicol. Appl. Pharmacol., 318, 79-87.
- Liu, T. and Altman, R.B. (2015): Relating essential proteins to drug side-effects using canonical component analysis: A structure-based approach. J. Chem. Inf. Model., 55, 1483-1494.
- Liu, T., Lin, Y., Wen, X., Jorissen, R.N. and Gilson, M.K. (2007): BindingDB: a web-accessible database of experimentally determined protein-ligand binding affinities. Nucleic Acids Res., 35, D198-D201.
- Lystrup, R.M. and Leggit, J.C. (2015): Caffeine toxicity due to supplement use in caffeine—naïve individual: A cautionary tale. Mil. Med., 180, e936-e940.
- Mangoni, M.E., Traboulsie, A., Leoni, A.L., Couette, B., Marger, L., Le Quang, K., Kupfer, E., Cohen-Solal, A., Vilar, J., Shin, H.S., Escande, D., Charpentier, F., Nargeot, J. and Lory, P. (2006): Bradycardia and slowing of the atrioventricular conduction in mice lacking CaV3.1/α1G T-type calcium channels. Circ. Res., 98, 1422-1430.
- Mizutani, S., Pauwels, E., Stoven, V., Goto, S. and Yamanishi, Y. (2012): Relating drug-protein interaction network with drug side effects. Bioinformatics, 28, i522-i528.
- Neu, A., Eiselt, M., Paul, M., Sauter, K., Stallmeyer, B., Isbrandt, D. and Schulze-Bahr, E. (2010): A homozygous SCN5A mutation in a severe, recessive type of cardiac conduction disease. Hum. Mutat., 31, E1609-E1621.
- Rogers, D., Brown, R.D. and Hahn, M. (2005): Using extended-connectivity fingerprints with Laplacian-modified Bayesian analysis in high-throughput screening follow-up. J. Biomol. Screen., 10, 682-686.
- Rogers, D. and Hahn, M. (2010): Extended-connectivity fingerprints. J. Chem. Inf. Model., 50, 742-754.
- Roth, B.L., Lopez, E., Patel, S. and Kroeze, W.K. (2000): The multiplicity of serotonin receptors: uselessly diverse molecules or an embarrassment of riches? Neuroscientist, 6, 252-262.
- Sawada, R., Kotera, M. and Yamanishi, Y. (2014): Benchmarking a wide range of chemical descriptors for drug-target interaction prediction using a chemogenomic approach. Mol. Inform., 33, 719-731.
- Siramshetty, V.B., Nickel, J., Omieczynski, C., Gohlke, B.O., Drwal, M.N. and Preissner, R. (2016): WITHDRAWN--a resource for withdrawn and discontinued drugs. Nucleic Acids Res., 44 (D1), D1080-D1086.
- Tack, J., Camilleri, M., Chang, L., Chey, W.D., Galligan, J.J., Lacy, B.E., Müller-Lissner, S., Quigley, E.M., Schuurkes, J., De Maeyer, J.H. and Stanghellini, V. (2012): Systematic review: cardiovascular safety profile of 5-HT4 agonists developed for gastrointestinal disorders. Aliment. Pharmacol. Ther., 35, 745-767.
- Wallach, I., Jaitly, N. and Lilien, R. (2010): A structure-based approach for mapping adverse drug reactions to the perturbation of underlying biological pathways. PLoS One, 5, e12063.
- Wang, S., Li, Y., Xu, L., Li, D. and Hou, T. (2013): Recent developments in computational prediction of HERG blockage. Curr. Top. Med. Chem., 13, 1317-1326.
- Yamanishi, Y., Pauwels, E. and Kotera, M. (2012): Drug side-effect prediction based on the integration of chemical and biological spaces. J. Chem. Inf. Model., 52, 3284-3292.
- Yeh, E.T., Tong, A.T., Lenihan, D.J., Yusuf, S.W., Swafford, J., Champion, C., Durand, J.B., Gibbs, H., Zafarmand, A.A. and Ewer, M.S. (2004): Cardiovascular complications of cancer therapy: diagnosis, pathogenesis, and management. Circulation, 109, 3122-3131.
- Zaman, T., Helbig, I., Božović, I.B., DeBrosse, S.D., Bergqvist, A.C., Wallis, K., Medne, L., Maver, A., Peterlin, B., Helbig, K.L., Zhang, X. and Goldberg, E.M. (2018): Mutations in SCN3A cause early infantile epileptic encephalopathy. Ann. Neurol., 83, 703-717.
- Zhang, W., Liu, F., Luo, L. and Zhang, J. (2015): Predicting drug side effects by multi-label learning and ensemble learning. BMC Bioinformatics, 16, 365.
- Zhou, H., Gao, M. and Skolnick, J. (2015): Comprehensive prediction of drug-protein interactions and side effects for the human proteome. Sci. Rep., 5, 11090.
- Zhu, F., Shi, Z., Qin, C., Tao, L., Liu, X., Xu, F., Zhang, L., Song, Y., Liu, X., Zhang, J., Han, B., Zhang, P. and Chen, Y. (2012): Therapeutic target database update 2012: a resource for facilitating target-oriented drug discovery. Nucleic Acids Res., 40, D1128-D1136.

;%0A%09%09%09newWindow.document.open();%0A%09%09%09newWindow.document.write('<img src=%22./Graphics/45_137-t1.jpg%22>');%0A%09%09%09newWindow.document.close();%0A%09%09)

