Abstract
Nonalcoholic fatty liver disease, which has been rapidly increasing in the world in recent years, is roughly classified into nonalcoholic fatty liver (NAFL) and nonalcoholic steatohepatitis. This study was based on our previous reports that stated that the combination treatment of N1-methylnicotinamide (MNA) and hydralazine (HYD) improves fatty liver in NAFL model rats. This finding was attributed to the MNA metabolism inhibition by HYD, which is a strong inhibitor of aldehyde oxidase (AO); this results in an increase in hepatic MNA and improved fatty liver. We hypothesized that orally administered nicotinamide (NAM), which is the precursor of MNA and is a form of niacin, would be efficiently metabolized by nicotinamide N-methyltransferase in the presence of exogenous S-adenosylmethionine (SAM) in NAFL rats. To address this issue, NAFL model rats were orally administered with NAM, SAM, and/or HYD. As a result, liver triglyceride (TG) and lipid droplet levels were barely altered by the administration of NAM, SAM, NAM+SAM, or NAM+HYD. By contrast, the triple combination of NAM+SAM+HYD significantly reduced hepatic TG and lipid droplet levels and significantly increased hepatic MNA levels. These findings indicated that the combination of exogenous SAM with AO inhibitors, such as HYD, has beneficial effects for improving fatty liver with NAM.
INTRODUCTION
Obesity causes health hazards in many countries around the world, and 10%-30% of adults suffers from nonalcoholic fatty liver disease (NAFLD) on a global average (Li et al., 2014; Vernon et al., 2011; Younossi et al., 2016). NAFLD is roughly divided into a nonalcoholic fatty liver (NAFL) and a nonalcoholic steatohepatitis (NASH). NAFL is characterized by hepatocyte steatosis, but NASH that has worsened and progressed is accompanied by findings of liver injury such as cell degeneration, inflammation, and fibrosis (Kleiner et al., 2005). NASH may progress to cirrhosis and liver cancer (Bhala et al., 2011). Many types of NAFLDs are caused by lifestyle-related diseases such as obesity, dyslipidemia, diabetes, and hypertension and are considered liver lesions of metabolic syndrome (Chon et al., 2012; Huh et al., 2015; Younossi et al., 2016). Therefore, “environmental factors” such as diet and lifestyle are important, but “genetic factors” such as racial differences and genetic polymorphisms are also considered important, together with environmental factors (Browning et al., 2004; Romeo et al., 2008).
Drug treatment for NAFLD is generally started after the disease progresses, such as progression into NASH, but there are few drugs that are currently available for treating NASH (Friedman et al., 2018). Given that approximately 30% of liver cancers are due to simple fatty liver without fibrosis (Takuma and Nouso, 2010), drug treatment from the early NAFL stage is also considered important. From this perspective, we examined the effect of some compounds on fatty liver improvement by using NAFL model rats induced by orotic acid with a high-sucrose diet, in which the disease level of fatty liver is relatively mild. Our previous research showed that some compounds alleviated fatty liver following the administration of the peroxisome proliferator dehydroepiandrosterone sulfate (DHEAS) and/or the administration of the cytochrome P450 (CYP) inducer phenobarbital (PB) to NAFL model rats induced by orotic acid with a high-sucrose diet (Goto et al., 1998a, 1998b; Takeuchi et al., 2015). The lipid droplets were significantly reduced from the fatty liver as a consequence of enhancing the metabolic reaction (Goto et al., 1998a, 1998b; Takeuchi et al., 2015). Furthermore, we have reported that the combination treatment of the niacin metabolite N1-methylnicotinamide (MNA) and the aldehyde oxidase (AO) inhibitor hydralazine (HYD) improved fatty liver in the same NAFL model rats (Takeuchi et al., 2018). MNA has been reported to stabilize sirtuin 1 (SIRT1), which is a protein responsible for fatty acid β-oxidation in the liver, thus reducing hepatic lipid levels (Hong et al., 2015). MNA is easily metabolized by AO in the liver, and its oxidation products, namely, N1-methyl-2-pyridone-5-carboxamide (2-PY) and N1-methyl-4-pyridone-3-carboxamide (4-PY), are immediately excreted into urine (Felsted and Chaykin, 1967; Leifer et al., 1951; Shibata, 1989). Considering that HYD is known as a typical potent AO inhibitor (Obach et al., 2004), it was considered that the rapid metabolism of MNA by AO in the liver was strongly suppressed; as a result, the MNA concentration in the liver was maintained (Takeuchi et al., 2018).
Nicotinamide (NAM), which is the precursor of MNA and is known as a form of niacin, has also been reported to have steatosis- and fibrosis-improving effects (Loza-Medrano et al., 2020). NAM is also biosynthesized from tryptophan via the kynurenine pathway, and the amount of NAM may be decreased in fatty liver (Fukuwatari et al., 2002; Shibata, 1987). Thus far, the detailed role of NAM on fatty liver improvement has been superficial. NAM is rapidly absorbed from the small intestine when taken orally through meals and/or supplements, is methylated at the N atom of the pyridine ring of NAM by nicotinamide N-methyltransferase (NNMT) localized in the cytosolic fraction of the liver (Aksoy et al., 1994; D’Souza et al., 1980), and then produces a metabolite, namely, MNA (Leifer et al., 1951). Given that NAM is excreted into the urine only after its methylation reaction, it can be said that NNMT facilitates the excretion of excess niacin (Shibata, 1989). Although NAM seems to be easier and cheaper to take orally than MNA, SAM, which is a coenzyme of NNMT is essential for the methylation of NAM to form MNA by NNMT in the liver (Cantoni, 1951). It was completely unknown whether endogenous SAM alone was sufficient or whether additional exogenous SAM was needed to improve fatty liver in the NAFL model rat. On the basis of this background, we conducted a new related study for the improvement of fatty liver by using NAFL model rats induced by orotic acid with a high-sucrose diet. We hypothesized that the improvement of fatty liver by NAM would be confirmed if it is sufficiently metabolized by NNMT in the presence of exogenous SAM and that hepatic MNA as a consequent metabolite is further retained by suppressing its rapid hepatic metabolism by AO with the potent AO inhibitor HYD. To address this issue, in the present study, NAFL model rats were orally dosed with NAM+SAM+HYD, and detailed liver section pathology, including electron microscopy, was evaluated.
MATERIALS AND METHODS
Materials
NAM, MNA chloride, HYD hydrochloride, and SAH were obtained from Sigma-Aldrich Co. (St. Louis, MO, USA). Potassium Chloride (KCl) was obtained from FUJIFILM Wako Pure Chemical Co. (Osaka, Japan). SAM was obtained from Biorbyt (Cambridge, UK). 2-PY and 4-PY and stable isotope-labeled NAM (d4-NAM), SAM sulfate salt (13C5-SAM), 2-PY (d3-2-PY), and 4-PY (d3-4-PY) were obtained from Toronto Research Chemicals (Toronto, Canada). Stable isotope-labeled MNA iodide (d7-MNA) was procured from BDG Synthesis (Wellington, New Zealand). Stable isotope-labeled SAH (d4-SAH) was obtained from Cayman Chemical Company (Ann Arbor, MI, USA). Other reagents were of the suitable grades for evaluation.
Animals and treatments
Male Sprague Dawley rats at 4 weeks of age were purchased from Charles River Laboratories Japan, Inc. (Shiga, Japan). The rats were bred in stainless steel wire-mesh cages, fed a solid CRF-1 (Oriental Yeast, Tokyo, Japan), and were freely supplied with water under controlled environmental conditions (23°C ± 2°C temperature, 60% ± 10% humidity, and 12 hr light/dark cycle). Rats were divided into 7 groups (n = 6 per group) to obtain the comparable mean body weight among the groups. Figure 1 shows the schedules used for animal treatment in the study. Control rats (the intact group) were fed powdered CRF-1 (Oriental Yeast) for 8 weeks. Rats other than the control rats were fed powdered CRF-1 containing 50% sucrose and 1% orotic acid for 8 weeks to induce fatty liver. Some rats suffering from fatty liver were treated with NAM (100 mg/kg/day, p.o., once daily), SAM (15 mg/kg/day, p.o., once daily), or HYD (50 mg/kg/day, p.o., once daily) for 4 weeks alone or in combination (Fig. 1). Because it was reported that liver SIRT1 activation was observed after administering 100 mg/kg NAM for 4 weeks in rats with type 2 diabetes (Yang et al., 2014), the NAM dose was set to 100 mg/kg in this study. The SAM dose was set to 15 mg/kg in this study because a previous study reported improvement of injured blood vessels and anti-inflammatory effect after administering 15 mg/kg SAM for 3 weeks in rats with type 2 diabetes (Lim et al., 2011). Because treatment with 50 mg/kg HYD prevented orotic acid/sucrose-induced fatty liver in rats in a previous study (Takeuchi et al., 2018), the HYD dose was set at 50 mg/kg in this study. Body weight and food consumption were measured once a week. One day after the last dosing, with 20 to 22 hr of fasting, the rats were weighed and sacrificed. Thereafter, each liver was excised and weighed. The liver weights show absolute and relative (liver per body weight) weights. The experimental protocols were approved by the Animal Ethical Committee of Otsuka Pharmaceutical Co., Ltd.

All animals were deeply anesthetized with isoflurane 1 day after the final dosing of the test materials and were sacrificed by exsanguination from the posterior vena cava and aorta following blood sampling for the blood chemistry test. Then, the liver of each animal was excised and weighed. The plasma was prepared by centrifuging blood gathered in a heparinized tube at 4°C and 3000 rpm for 20 min. The following blood components were assayed using an automatic analyzer (Model 7180, Hitachi, Tokyo, Japan): aspartate aminotransferase (AST), alanine aminotransferase (ALT), and triglyceride (TG). The liver homogenate was prepared as follows: The rat liver was minced with scissors, added with 4 vol. of 1.15% KCl, and was homogenized 5 times at 2000 rpm in ice water (EUROSTAR 20 digital, IKA, Osaka, Japan). The TG contents in rat liver homogenates was determined according to Maglich et al., (2009).
Histopathological and electron microscopic examination
For light microscopic analysis, the liver was fixed in 10% neutral buffered formalin, embedded in paraffin, sectioned at 3 μm, and stained with hematoxylin and eosin. Additionally, the liver was cryoprotected overnight in 30% sucrose with 0.1 M phosphate buffer at room temperature, frozen in isopentane cooled with liquid nitrogen, sectioned at 8 μm by using a Leica CM3050S cryostat (Leica Microsystem, Wetzlar, Germany), and subjected to Oil Red O staining according to the standard procedures. The slides were examined by the study pathologist and the reviewing pathologist. The fatty change of hepatocyte was graded according to a grade scale of 0 to 4 on the basis of the degree of hepatocellular steatosis (< 5%, grade 0; 5%-25%, grade 1; > 25%-50%, grade 2; > 50%-75%, grade 3; > 75%, grade 4). One animal from each group was subjected to transmission electron microscopic examination. The liver was prefixed in a mixture of 2.5% glutaraldehyde and 2% paraformaldehyde for 2 hr and was postfixed in 1% osmium tetroxide for 2 hr. The fixed tissue was stained en bloc with uranyl acetate, dehydrated with increasing concentrations of acetone, embedded in epoxy resin, sectioned ultra-thinly by using an ultramicrotome, stained with lead citrate, and observed using a JEM-1400Plus transmission electron microscope (Japan Electron Optics Laboratory, Tokyo, Japan).
MNA, NAM, 2-PY, 4-PY, SAM, and SAH levels in rat liver homogenates
The quantification of the six compounds was performed using liquid chromatography-mass spectrometry (LC-MS/MS). The liver homogenate of each animals, six levels of calibration curve sample (n = 1) and three levels of quality control (QC) sample (n = 2) were prepared for each substance to be measured. To each sample, methanol containing a stable isotope-labeled compounds was added and mixed so that the final concentration was 80% or more methanol. After centrifugation, the total amount of the supernatant was dried by nitrogen, and the pellet was dissolved with water/formic acid (1000:1, v/v) and subjected to LC-MS/MS analysis. The LC-MS/MS system was configured with a Prominence UFLC (Shimadzu, Kyoto, Japan) coupled to with a QTRAP 4500 (AB Sciex, Darmstadt, Germany). The ionization method was electrospray ionization with a positive mode. Multiple reaction monitoring (MRM) mode utilizing the precursor and product ions of the analyte and stable isotope-labeled internal standard was employed. The analytical column used was a Discovery® HS F5-5 column 5 cm × 2.1 mm 3 µm (Merck, Darmstadt, Germany), and the column oven was set at 40°C. A gradient was formed with solvents A (purified water-formic acid [1000:1, v/v]) and B (acetonitrile-formic acid [1000:1, v/v]) at a flow rate of 0.25 mL/min. The gradient was set at 0% B, (0-1 min), 95% B (5 min) for NAM, MNA, 2PY, 4PY. The gradient was set at 0% B, (0-1 min), 95% B (10 min) for SAM, SAH. MRM transitions was set at m/z 123→80 and m/z 127→84 for NAM and d4-NAM, m/z 137→94 and m/z 144→101 for MNA and d7-MNA, m/z 153→110 and m/z 156→113 for 2-PY and d3-2-PY, m/z 153→136 and m/z 156→139 for 4-PY and d3-4-PY, m/z 399→250 and m/z 404→255 for SAM and 13C5-SAM, and m/z 385→134 and m/z 389→138 for SAH and d4-SAH. Data processing was performed using Analyst®: 1.6.2 (AB Sciex).
Statistical analysis
Statistical differences were estimated by one-way ANOVA, then by Tukey’s post-hoc test using Statistical Analysis System (SAS) software (Release 9.4, SAS Institute, Cary, NC, USA). When the P value was below 0.01 or 0.05, the difference was judged to be statistically significant.
RESULTS
Orotic acid/sucrose-induced fatty liver and its improvement effect
The body weight and relative liver weight of rats treated with orotic acid/sucrose tended to decrease and increased, respectively (Table 1, Figs. 2A, and 2B). The decrease in body weight could not be reversed by cotreatment with NAM, SAM, NAM+SAM, and NAM+HYD and was further reduced by cotreatment with NAM+SAM+HYD (Table 1). The increase in liver weight could not be reversed by cotreatment with NAM, SAM, NAM+SAM, and NAM+HYD (Table 1, Figs. 2C, 2D, 2E, and 2F). However, the increase in liver weight and the hepatomegaly could be reversed by cotreatment with NAM+SAM+HYD (Table 1 and Fig. 2G). Regarding the outward appearance, a whitish-colored fatty liver (Fig. 2B) was also observed in the NAM, SAM, NAM+SAM, and NAM+HYD treatment groups (Figs. 2C, 2D, 2E, and 2F). A liver-specific reddish color, similar to that in the control liver, was observed in cotreatment group of NAM+SAM+HYD (Figs. 2A and 2G).
Table 1. Change in the body and liver weight of orotic acid/sucrose-treated rats by treatment with NAM, SAM, NAM+SAM, NAM+HYD, and NAM+SAM+HYD.
| Group |
Final body weight (g) |
Liver weight |
| Absolute (g) |
Relative (%) |
| Control |
455.8 |
± |
39.5 |
12.7 |
± |
1.7 |
2.8 |
± |
0.2 |
| Fatty liver |
414.2 |
± |
34.5 |
17.1 |
± |
3.8 * |
4.1 |
± |
0.6 ** |
| + NAM |
422.2 |
± |
17.9 |
15.8 |
± |
2.2 |
3.7 |
± |
0.4 ** |
| + SAM |
415.5 |
± |
33.2 |
16.5 |
± |
2.5 |
4.0 |
± |
0.5 ** |
| + NAM & SAM |
397.2 |
± |
29.7 * |
15.9 |
± |
2.6 |
4.0 |
± |
0.4 ** |
| + NAM & HYD |
395.2 |
± |
33.4 * |
15.6 |
± |
2.4 |
4.0 |
± |
0.4 ** |
| + NAM & SAM & HYD |
363.3 |
± |
30.2 ** |
11.8 |
± |
1.8 # |
3.2 |
± |
0.3 # |
Each value represents the mean ± S.D. for 6 rats in each group, except for the fatty liver group (n = 5, death of 1 animal). Significantly different from the control (**P < 0.01, *P < 0.05) and the fatty liver group (#P < 0.05).

Histopathological examination revealed numerous vacuoles in hepatocytes in the orotic acid/sucrose-treated rat liver from the centrilobular zone to the peripheral zone (Table 2 and Fig. 3B). The vacuoles reacted positively to Oil Red O staining, thus indicating that they were lipid droplets (Fig. 4B). Lipid droplets were macrovesicular, and hepatocytes were enlarged owing to fat accumulation (Fig. 3B). In electron microscopic examination, no lipid droplets were seen in the cytoplasmic matrix at the control liver (data not shown). Increased in lipid droplets, large lipid droplets in the cytoplasmic matrix, and small lipid inclusion in the dilated/vesicular rough endoplasmic reticulum (rER) were observed in the orotic acid/sucrose-treated rat liver (Fig. 5A). In the cotreatment with NAM, SAM, and NAM+SAM, the degree and distribution of hepatocyte steatosis were similar to those in the orotic acid/sucrose-treated rat liver (Table 2, Figs. 3C, 3D, 3E, 4C, 4D, and 4E). On the other hand, with the simultaneous treatment with NAM+HYD, a small number of small fat droplets remained, but hepatic steatosis tended to improve (Table 2, Figs. 3F, and 4F). In particular, the improvement was remarkable from the centrilobular zone to the intermediate zone (Table 2, Figs. 3F, and 4F). The size of hepatocytes also tended to return to the original size with the improvement of hepatic steatosis (Fig. 3F). With the simultaneous treatment of NAM+SAM+HYD, an improvement of hepatic steatosis was observed in all lobules (Table 2, Figs. 3G, and 4G). The hepatocytes recovered to the same size as that of the control liver with the improvement of the hepatic steatosis (Table 2, Figs. 3A, and 3G). The cotreatment with NAM+SAM+HYD reduced the area that showed positive Oil Red O staining to the level of the control liver, thus confirming the improvement of fatty liver in the NAM+SAM+HYD group (Figs. 4A and 4G). In electron microscopic examination, the cotreatment with NAM+SAM+HYD decreased lipid droplets and lipid inclusions compared with the fatty liver (Figs. 5A and 5B). There were no abnormal findings in other organelles in all groups.
Table 2. Histopathological findings of livers in orotic acid/sucrose-treated rats by treatment with NAM, SAM, NAM+SAM, NAM+HYD, and NAM+SAM+HYD.
| Findings |
Score |
Control |
Fatty liver |
+NAM |
+SAM |
+NAM & SAM |
+NAM & HYD |
+NAM & SAM & HYD |
| n = 6 |
n = 5 |
n = 6 |
n = 6 |
n = 6 |
n = 6 |
n = 6 |
| Fatty change of hepatocytesin the centrilobular zone |
- |
6 |
0 |
0 |
0 |
0 |
0 |
6 |
| 1+ |
0 |
1 |
1 |
1 |
1 |
5 |
0 |
| 2+ |
0 |
0 |
1 |
0 |
1 |
0 |
0 |
| 3+ |
0 |
1 |
2 |
2 |
1 |
1 |
0 |
| 4+ |
0 |
3 |
2 |
3 |
3 |
0 |
0 |
| Fatty change of hepatocytesin the intermediate zone |
- |
6 |
0 |
0 |
0 |
0 |
0 |
5 |
| 1+ |
0 |
1 |
1 |
1 |
1 |
2 |
1 |
| 2+ |
0 |
0 |
0 |
0 |
1 |
2 |
0 |
| 3+ |
0 |
0 |
3 |
2 |
1 |
1 |
0 |
| 4+ |
0 |
4 |
2 |
3 |
3 |
1 |
0 |
| Fatty change of hepatocytesin the peripheral zone |
- |
6 |
0 |
0 |
0 |
0 |
0 |
6 |
| 1+ |
0 |
0 |
1 |
0 |
0 |
0 |
0 |
| 2+ |
0 |
0 |
0 |
0 |
0 |
2 |
0 |
| 3+ |
0 |
2 |
3 |
1 |
1 |
2 |
0 |
| 4+ |
0 |
3 |
2 |
5 |
5 |
2 |
0 |
Histopathological features were graded using the following grade scores: -: < 5%; 1+: 5%-25%; 2+: > 25%-50%; 3+: > 50%-75%; and 4+: > 75%.
Plasma AST, ALT, TG, and liver TG levels
The activity of AST and ALT, which are both markers for liver injury, has an increasing tendency following treatment with orotic acid/sucrose (Figs. 6A and 6B). These liver injury markers were significantly increased in rats treated with NAM+SAM, and these elevated levels of AST and ALT have an attenuating tendency following treatment with NAM+HYD and NAM+SAM+HYD (Figs. 6A and 6B). The plasma TG value in rats treated with orotic acid/sucrose has an increasing tendency, and this level was not attenuated by drug administration (Fig. 6C). A significant increase (3.9-fold increase) in liver TG was observed in rats treated with orotic acid/sucrose (Fig. 7). This liver TG level in cotreatment with NAM, SAM, NAM+SAM, and NAM+HYD were almost equivalent to that of the fatty liver group (Fig. 7). On the other hand, cotreatment with NAM+SAM+HYD significantly attenuated the liver TG to the same level as the control (Fig. 7).
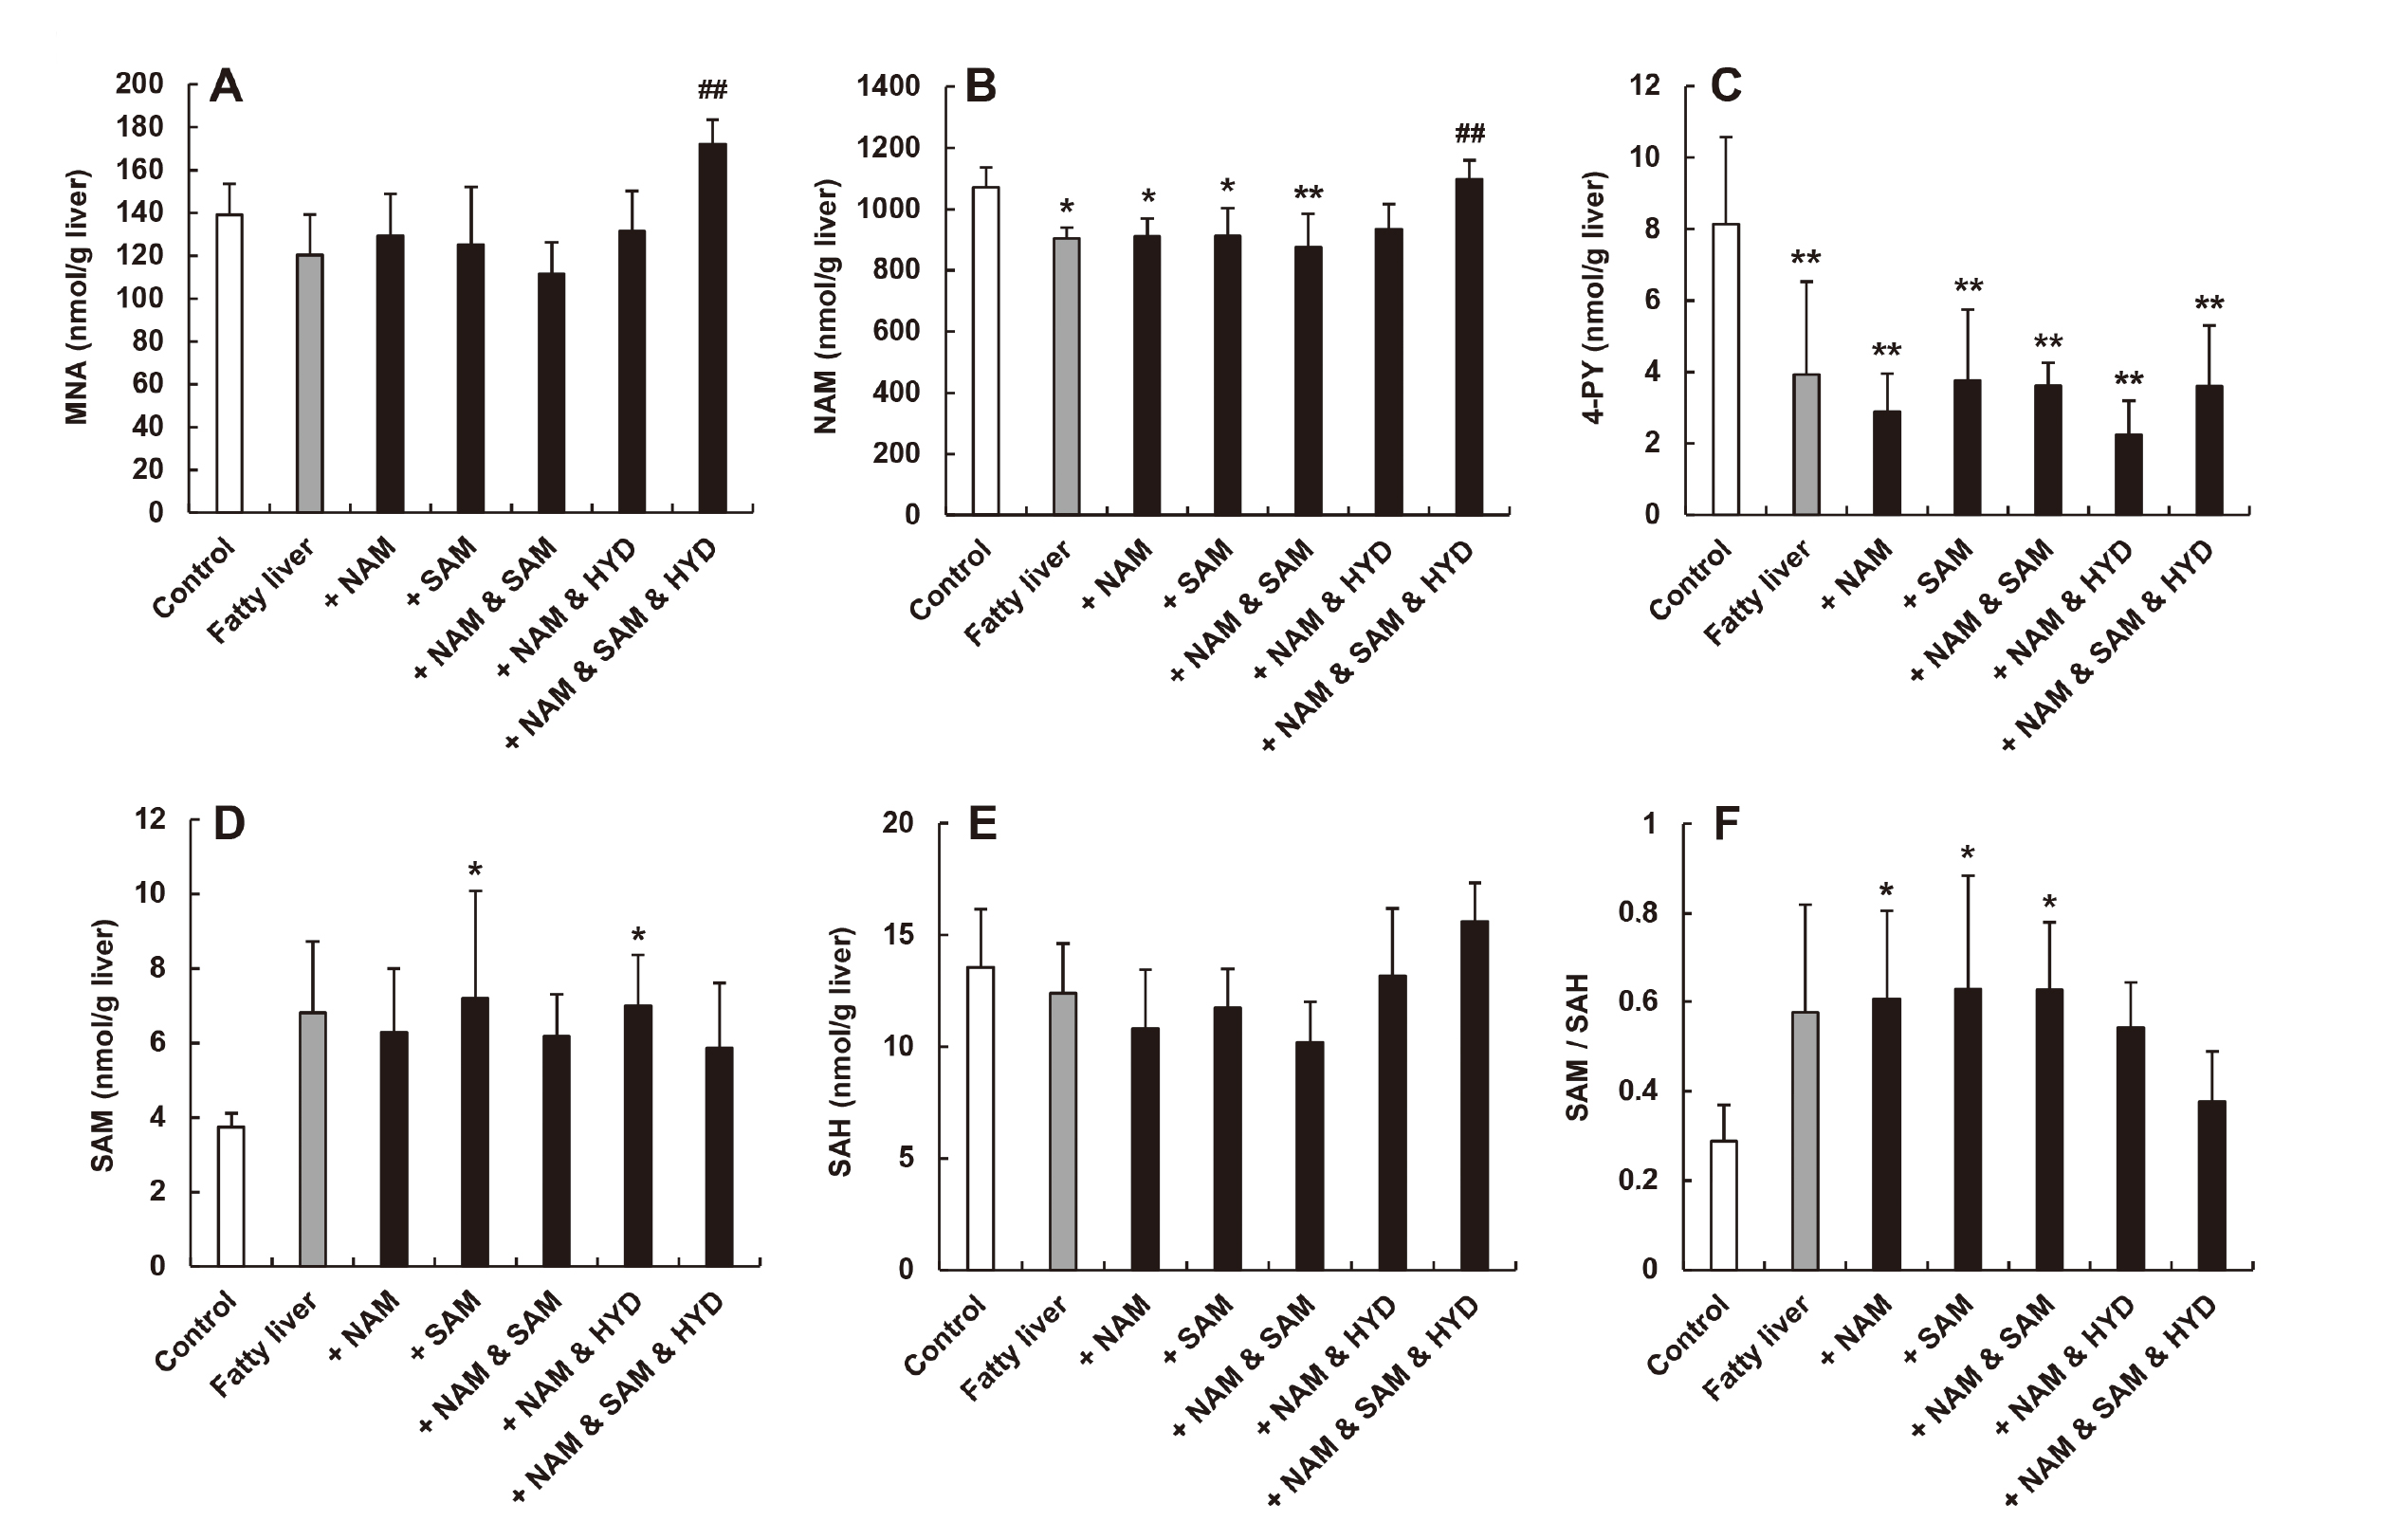
Hepatic MNA, NAM, 2-PY, 4-PY, SAM, and SAH content
The accuracies of the all calibration curve samples ([back-calculated concentration/nominal concentration] × 100) were 85.9% to 108.5% (data not shown). The accuracies of the all QC samples ([measured concentration/nominal concentration] × 100) were 89.5% to 113.3% (data not shown). To investigate the underlying mechanisms of the dosing effects of NAM+SAM+HYD on fatty liver, the contents of MNA, NAM, 2-PY, 4-PY, SAM, and SAH in liver homogenate were analyzed by LC-MS/MS. Figure 8 shows the hepatic content data for MNA, NAM, 4-PY, SAM, and SAH and SAM/SAH. The hepatic MNA level in the fatty liver group was almost equivalent to that of the control group, and those of the medicated groups were comparable with that of the control, except for the NAM+SAM+HYD group, in which a significant increase compared with the fatty liver group was observed (Fig. 8A). The hepatic NAM levels of fatty liver and medicated groups were significantly decreased compared with that of the control, except for the NAM+HYD and NAM+SAM+HYD groups, and only the NAM+SAM+HYD group showed a significant increase compared with that in the fatty liver group (Fig. 8B). Regarding 4-PY concentrations, the hepatic levels in the fatty liver group and in all medicated groups were significantly decreased compared with that of the control (Fig. 8C). The hepatic 2-PY value in all test groups were below the lower limit of quantitation (0.1 nmol/g liver). The hepatic SAM level in the SAM and NAM+HYD groups showed a significant increase compared with that of the control, and the fatty liver and the other medicated groups also showed similar trends (Fig. 8D). Although there was some variation between test groups in regard to SAH concentration in the liver, no significant increase or decrease was confirmed (Fig. 8E). The SAM/SAH ratio in the fatty liver and medicated groups, represented an increasing tendency or a significant increase compared with that of the control (Fig. 8F).
DISCUSSION
It has long been reported that orotic acid, which is a precursor to pyrimidine nucleotide biosynthesis, induces fatty liver in rats (Jatlow et al., 1965). The mechanism of orotic acid-induced fatty liver formation involves the addition of orotate-damaging sugars to the apoprotein of the Golgi complex (Sabesin et al., 1977) and the excretion of very low density lipoprotein due to impaired translocation from the liver to the blood (Windmueller, 1964; Windmueller and Levy, 1967). Furthermore, orotate-induced TG accumulation is promoted by a high-sucrose diet (Novikoff et al., 1974). Sucrose is a disaccharide composed of glucose and fructose, and fructose, which is a decomposition product of sucrose, is highly migrating to the liver after ingestion and is a constituent of TG. Considering that fructose is easily metabolized to glycerin and fatty acid, it is quickly converted to TG. In our previous studies, a combination of orotic acid/sucrose was used for 4 weeks to recapitulate the marked accumulation of lipid droplets in hepatocytes (Goto et al., 1998a, 1998b; Takeuchi et al., 2015, 2018). These observations were also supported by the present study, in which the supplementation period of orotic acid/sucrose was extended to 8 weeks to reduce variations in fatty liver formation. Rat liver that was treated with orotic acid/sucrose clearly showed hepatomegaly (Table 1, Figs. 2A, and 2B). Moreover, the accumulation of lipid droplets in the cytoplasm and rER (Figs. 3A, 3B, 4A, 4B, and 5A), the increasing trend of plasma AST and ALT activities (Figs. 6A and 6B), and the increase of TG content in the liver (Fig. 7) were confirmed, to the same extent as the results of previous 4-week supplementation studies. These results suggest that treatment with orotic acid/sucrose for 8 weeks also induces the desired fatty liver pathology, and the effects of drug administration in the present study may indicate an improvement effect on simple fatty liver that is almost completely formed at 4 weeks.
N1-methylnicotinamide (MNA) has been reported to stabilize SIRT1, which is responsible for fatty acid β-oxidation in the liver, thereby reducing hepatic lipid levels (Takeuchi et al., 2018; Hong et al., 2015). MNA also has antithrombotic, anti-inflammatory, gastroprotective, and treatment of rosacea (Brzozowski et al., 2008; Bryniarski et al., 2008; Domagala et al., 2012; Wozniacka et al., 2005). In recent years, MNA can be taken from supplements. According to the European Food Safety Authority (EFSA), MNA is recognized as a safe food under the proposed usage and dosage (Turck et al., 2017). On the other hand, the NAM of the MNA precursor has also been reported to improve steatosis and fibrosis (Loza-Medrano et al., 2020). Given that NAM is easier to obtain and is cheaper than MNA, it may be useful to use NAM in treating human fatty liver diseases in clinical settings. Considering that the role of NAM in fatty liver alleviation is still unclear, the present study pursued the effect of repeated oral administration of NAM with and without SAM for the improvement of NAFL in rats. Approximately 60% of orally administrated NAM is metabolized by NNMT in the liver, and NNMT catalyzes the transfer of methyl groups from SAM to the ring nitrogen of NAM; this process consequently produces a metabolite, namely, MNA (Aksoy et al., 1994; Cantoni, 1951; D’Souza et al., 1980; Menon et al., 2007b). Reports stated that NNMT expression is increased and activated in obese and NASH patients (Lee et al., 2005). Furthermore, SAM is a component of the methionine metabolic pathway in vivo and is most abundant in the liver. However, in fatty liver, SAM might be depleted because of the increased expression and activation of NNMT, and there are reports stating that the methionine metabolic pathway is not functioning normally in fatty liver (Komatsu et al., 2018). It was speculated that exogenous SAM should be added to generate enough MNA to improve fatty liver. MNA is immediately metabolized by AO in the liver and excreted into the urine (Felsted and Chaykin, 1967; Leifer et al., 1951). Therefore, we thought that it was necessary to use AO inhibitors, such as HYD, in combination to improve fatty liver with NAM, similar to that in a previous study (Takeuchi et al., 2018). From these perspectives, the present study focused on the alleviation effect of NAM+SAM+HYD combination on orotic acid/sucrose-induced fatty liver in male rats.
We showed that the administration of HYD, which is a typical antihypertensive agent, to orotic acid/sucrose-induced NAFL rats resulted in a slight alleviation in fatty liver. However, fatty liver treatment with HYD administration only has not reached the same level of improvement as the cotreatment with MNA+HYD (Takeuchi et al., 2018). NAM is known to improve fatty liver (Loza-Medrano et al., 2020), and SAM is effective in treating liver disease (Feo et al., 1986). However, the current study showed that NAM, SAM, or NAM+SAM could not improve fatty liver (Table 2, Figs. 2C, 2D, 2E, 3C, 3D, 3E, 4C, 4D, and 4E). Cotreatment with NAM+HYD tended to improve fatty liver but not completely (Table 2, Figs. 2F, 3F, and 4F). On the other hand, improvements in liver weight and hepatomegaly were observed in the triple treatment with NAM+SAM+HYD (Table 1 and Fig. 2G). Reddish-brown liver, similar to that in the control group, was observed (Figs. 2A and 2G). Furthermore, reduced hepatic steatosis (Table 2, Figs. 3G, 4G, and 5B), the decreasing trend of plasma AST and ALT activities (Figs. 6A and 6B), and reduced liver TG content (Fig. 7) were also confirmed as characteristic phenomena of this triple combination group. These results suggest that the cotreatment with NAM+SAM+HYD is the most effective in improving fatty liver under the conditions examined in the present study. However, because we examined liver samples collected at only one time point, i.e., 24 hr, time-dependent effects of this triple combination were not assessed. This is a key issue that should be investigated further in the near future.
We investigated the underlying mechanism of the alleviation effect of NAM+SAM+HYD on fatty liver. In cotreatment with NAM+SAM+HYD, the liver MNA concentration was significantly higher than those in the groups that did not showed improvements in fatty liver (Fig. 8A). This finding shows the possibility that the administration of exogenous SAM enhanced the efficiency of the methylation of NAM to MNA in the liver and that the combination treatment of HYD inhibited hepatic AO and increased intrahepatic MNA exposure (Fig. 9). Liver NAM was reduced in the fatty liver compared with the control liver (Fig. 8B). It is speculated that this is because the conversion rate of tryptophan to NAM that occurs in the liver might be reduced in orotic acid-induced fatty liver (Fukuwatari et al., 2002). On the other hand, in cotreatment with NAM+SAM+HYD, the NAM concentration in the liver was significantly higher than that in the fatty liver (Fig. 8B). There are two possible reasons for this. First, the improvement in fatty liver returned to the normal conversion of tryptophan to NAM. Second, given that MNA is known to inhibit NNMT (Kraus et al., 2014), it was speculated that increased MNA inhibited NNMT and increased NAM. In the present study, SAM content in the fatty liver had an increasing tendency compared with that of the control (Fig. 8D). This result was unexpected because it has been indicated that SAM in fatty liver can be depleted owing to the increased expression and activation of NNMT, and the methionine metabolic pathway is not functioning normally in fatty liver condition (Komatsu et al., 2018). Recently, it has been reported that SAM content increased in the liver of hamsters in which NASH was induced (Maria Del Bas et al., 2019). This suggests that hepatic SAM may not always decrease in NAFLD-induced models. In cotreatment with NAM+SAM+HYD, the SAM/SAH ratio decreased compared with that in the fatty liver group and similar to that in the control (Fig. 8F).

NAM is known to generate not only MNA but also nicotinamide mononucleotide (NMN) via nicotinamide phosphoribosyl transferase and further generate nicotinamide adenine dinucleotide (NAD+) (Menon et al., 2007a, 2007b). Increased NMN and NAD+ have been reported to improve fatty liver (Gariani et al., 2016; Uddin et al., 2020). NAD+ is required for β-oxidation or the TCA cycle, and the improved fatty liver situation supports this. In the cotreatment with NAM+SAM+HYD, not only MNA but also NMN and NAD+ might be increased, and this consequently contribute to improvements in fatty liver in the present study. It is known that at physiological NAM levels (11-500 μmol/L), NAM is preferentially converted to MNA but not NAD+ (Hoshino et al., 1984). It has been reported that increasing the NAM concentration (1-10 mmol/L or more) dramatically increases the NAD+ synthesis rate, which is 6 times higher than that of MNA (Hoshino et al., 1984). The NAM concentration in the liver with NAM+SAM+HYD in the present study was approximately 1.1 mmol/L (calculated from nmol/g liver in nmol/mL unit); therefore, NAM might be partially converted to NAD+.
In conclusion, the combination treatment of NAM with SAM and HYD is considered effective for improving fatty liver. The findings in this study may lead to clinically useful treatments of NAFL/NASH in the future, but further studies are needed to determine the detailed mechanisms of fatty liver alleviation.
ACKNOWLEDGMENTS
We would like thank Mr. Susumu Kataoka, Mr. Toshiaki Saito, Mr. Hironobu Kodama, Mr. Shogo Matsumoto, and Mr. Shouji Miki for their technical assistance with the histopathology and electron microscopy analyses.
Conflict of interest
The authors declare that there is no conflict of interest.
REFERENCES
- Aksoy, S., Szumlanski, C.L. and Weinshilboum, R.M. (1994): Human liver nicotinamide N-methyltransferase. cDNA cloning, expression, and biochemical characterization. J. Biol. Chem., 269, 14835-14840.
- Bhala, N., Angulo, P., van der Poorten, D., Lee, E., Hui, J.M., Saracco, G., Adams, L.A., Charatcharoenwitthaya, P., Topping, J.H., Bugianesi, E., Day, C.P. and George, J. (2011): The natural history of nonalcoholic fatty liver disease with advanced fibrosis or cirrhosis: an international collaborative study. Hepatology, 54, 1208-1216.
- Browning, J.D., Szczepaniak, L.S., Dobbins, R., Nuremberg, P., Horton, J.D., Cohen, J.C., Grundy, S.M. and Hobbs, H.H. (2004): Prevalence of hepatic steatosis in an urban population in the United States: impact of ethnicity. Hepatology, 40, 1387-1395.
- Bryniarski, K., Biedron, R., Jakubowski, A., Chlopicki, S. and Marcinkiewicz, J. (2008): Anti-inflammatory effect of 1-methylnicotinamide in contact hypersensitivity to oxazolone in mice; involvement of prostacyclin. Eur. J. Pharmacol., 578, 332-338.
- Brzozowski, T., Konturek, P.C., Chlopicki, S., Sliwowski, Z., Pawlik, M., Ptak-Belowska, A., Kwiecień, S., Drozdowicz, D., Pajdo, R., Slonimska, E., Konturek, S.J. and Pawlik, W.W. (2008): Therapeutic potential of 1-methylnicotinamide against acute gastric lesions induced by stress: role of endogenous prostacyclin and sensory nerves. J. Pharmacol. Exp. Ther., 326, 105-116.
- Cantoni, G.L. (1951): Activation of methionine for transmethylation. J. Biol. Chem., 189, 745-754.
- Chon, C.W., Kim, B.S., Cho, Y.K., Sung, K.C., Bae, J.C., Kim, T.W., Won, H.S. and Joo, K.J. (2012): Effect of nonalcoholic Fatty liver disease on the development of type 2 diabetes in nonobese, nondiabetic korean men. Gut Liver, 6, 368-373.
- Domagala, T.B., Szeffler, A., Dobrucki, L.W., Dropinski, J., Polanski, S., Leszczynska-Wiloch, M., Kotula-Horowitz, K., Wojciechowski, J., Wojnowski, L., Szczeklik, A. and Kalinowski, L. (2012): Nitric oxide production and endothelium-dependent vasorelaxation ameliorated by N1-methylnicotinamide in human blood vessels. Hypertension, 59, 825-832.
- D’Souza, J., Caldwell, J. and Smith, R.L. (1980): Species variations in the N-methylation and quaternization of [14C]pyridine. Xenobiotica, 10, 151-157.
- Felsted, R.L. and Chaykin, S. (1967): N1-methylnicotinamide oxidation in a number of mammals. J. Biol. Chem., 242, 1274-1279.
- Feo, F., Pascale, R., Garcea, R., Daino, L., Pirisi, L., Frassetto, S., Ruggiu, M.E., Di Padova, C. and Stramentinoli, G. (1986): Effect of the variations of S-adenosyl-L-methionine liver content on fat accumulation and ethanol metabolism in ethanol-intoxicated rats. Toxicol. Appl. Pharmacol., 83, 331-341.
- Friedman, S.L., Neuschwander-Tetri, B.A., Rinella, M. and Sanyal, A.J. (2018): Mechanisms of NAFLD development and therapeutic strategies. Nat. Med., 24, 908-922.
- Fukuwatari, T., Morikawa, Y., Sugimoto, E. and Shibata, K. (2002): Effects of fatty liver induced by niacin-free diet with orotic acid on the metabolism of tryptophan to niacin in rats. Biosci. Biotechnol. Biochem., 66, 1196-1204.
- Gariani, K., Menzies, K.J., Ryu, D., Wegner, C.J., Wang, X., Ropelle, E.R., Moullan, N., Zhang, H., Perino, A., Lemos, V., Kim, B., Park, Y.-K., Piersigilli, A., Pham, T.X., Yang, Y., Ku, C.S., Koo, S.I., Fomitchova, A., Cantó, C., Schoonjans, K., Sauve, A.A., Lee, J.-Y. and Auwerx, J. (2016): Eliciting the mitochondrial unfolded protein response by nicotinamide adenine dinucleotide repletion reverses fatty liver disease in mice. Hepatology, 63, 1190-1204.
- Goto, H., Yamashita, S. and Makita, T. (1998a): Prevention of orotic-acid-induced fatty liver in male rats by dehydroepiandrosterone and/or phenobarbital. J. Vet. Med. Sci., 60, 513-517.
- Goto, H., Yamashita, S. and Makita, T. (1998b): Preventive effects of dehydroepiandrosterone acetate on the fatty liver induced by orotic acid in male rats. Exp. Anim., 47, 257-260.
- Hong, S., Moreno-Navarrete, J.M., Wei, X., Kikukawa, Y., Tzameli, I., Prasad, D., Lee, Y., Asara, J.M., Fernandez-Real, J.M., Maratos-Flier, E. and Pissios, P. (2015): Nicotinamide N-methyltransferase regulates hepatic nutrient metabolism through Sirt1 protein stabilization. Nat. Med., 21, 887-894.
- Hoshino, J., Schlüter, U. and Kröger, H. (1984): Nicotinamide methylation and its relation to NAD synthesis in rat liver tissue culture. Biochemical basis for the physiological activities of 1-methylnicotinamide. Biochim. Biophys. Acta, 801, 250-258.
- Huh, J.H., Ahn, S.V., Koh, S.B., Choi, E., Kim, J.Y., Sung, K.-C., Kim, E.J. and Park, J.B. (2015): A prospective study of fatty liver index and incident hypertension: the KoGES-ARIRANG study. PLoS One, 10, e0143560.
- Jatlow, P., Adams, W.R. and Handschumacher, R.E. (1965): Pathogenesis of orotic acid-induced fatty change in the rat liver: light and electrone microscopic studies. Am. J. Pathol., 47, 125-145.
- Kleiner, D.E., Brunt, E.M., Van Natta, M., Behling, C., Contos, M.J., Cummings, O.W., Ferrell, L.D., Liu, Y.C., Torbenson, M.S., Unalp-Arida, A., Yeh, M., McCullough, A.J. and Sanyal, A.J.; Nonalcoholic Steatohepatitis Clinical Research Network. (2005): Design and validation of a histological scoring system for nonalcoholic fatty liver disease. Hepatology, 41, 1313-1321.
- Komatsu, M., Kanda, T., Urai, H., Kurokochi, A., Kitahama, R., Shigaki, S., Ono, T., Yukioka, H., Hasegawa, K., Tokuyama, H., Kawabe, H., Wakino, S. and Itoh, H. (2018): NNMT activation can contribute to the development of fatty liver disease by modulating the NAD + metabolism. Sci. Rep., 8, 8637-8651.
- Kraus, D., Yang, Q., Kong, D., Banks, A.S., Zhang, L., Rodgers, J.T., Pirinen, E., Pulinilkunnil, T.C., Gong, F., Wang, Y.-C., Cen, Y., Sauve, A.A., Asara, J.M., Peroni, O.D., Monia, B.P., Bhanot, S., Alhonen, L., Puigserver, P. and Kahn, B.B. (2014): Nicotinamide N-methyltransferase knockdown protects against diet-induced obesity. Nature, 508, 258-262.
- Lee, Y.H., Nair, S., Rousseau, E., Allison, D.B., Page, G.P., Tataranni, P.A., Bogardus, C. and Permana, P.A. (2005): Microarray profiling of isolated abdominal subcutaneous adipocytes from obese vs non-obese Pima Indians: increased expression of inflammation-related genes. Diabetologia, 48, 1776-1783.
- Leifer, E., Roth, L.J., Hogness, D.S. and Corson, M.H. (1951): The metabolism of radioactive nicotinic acid and nicotinamide. J. Biol. Chem., 190, 595-602.
- Li, Z., Xue, J., Chen, P., Chen, L., Yan, S. and Liu, L. (2014): Prevalence of nonalcoholic fatty liver disease in mainland of China: a meta-analysis of published studies. J. Gastroenterol. Hepatol., 29, 42-51.
- Lim, S., Moon, M.K., Shin, H., Kim, T.H., Cho, B.J., Kim, M., Park, H.S., Choi, S.H., Ko, S.-H., Chung, M.H., Lee, I.K., Jang, H.C., Kim, Y.-B. and Park, K.S. (2011): Effect of S-adenosylmethionine on neointimal formation after balloon injury in obese diabetic rats. Cardiovasc. Res., 90, 383-393.
- Loza-Medrano, S.S., Baiza-Gutman, L.A., Manuel-Apolinar, L., García-Macedo, R., Damasio-Santana, L., Martínez-Mar, O.A., Sánchez-Becerra, M.C., Cruz-López, M., Ibáñez-Hernández, M.A. and Díaz-Flores, M. (2020): High fructose-containing drinking water-induced steatohepatitis in rats is prevented by the nicotinamide-mediated modulation of redox homeostasis and NADPH-producing enzymes. Mol. Biol. Rep., 47, 337-351.
- Maglich, J.M., Lobe, D.C. and Moore, J.T. (2009): The nuclear receptor CAR (NR1I3) regulates serum triglyceride levels under conditions of metabolic stress. J. Lipid Res., 50, 439-445.
- Maria Del Bas, J., Rodríguez, B., Puiggròs, F., Mariné, S., Rodríguez, M.A., Moriña, D., Armengol, L., Caimari, A. and Arola, L. (2019): Hepatic accumulation of S-adenosylmethionine in hamsters with non-alcoholic fatty liver disease associated with metabolic syndrome under selenium and vitamin E deficiency. Clin. Sci. (Lond.), 133, 409-423.
- Menon, R.M., Adams, M.H., González, M.A., Tolbert, D.S., Leu, J.H. and Cefali, E.A. (2007a): Plasma and urine pharmacokinetics of niacin and its metabolites from an extended-release niacin formulation. Int. J. Clin. Pharmacol. Ther., 45, 448-454.
- Menon, R.M., González, M.A., Adams, M.H., Tolbert, D.S., Leu, J.H. and Cefali, E.A. (2007b): Effect of the rate of niacin administration on the plasma and urine pharmacokinetics of niacin and its metabolites. J. Clin. Pharmacol., 47, 681-688.
- Novikoff, P.M., Roheim, P.S., Novikoff, A.B. and Edelstein, D. (1974): Production and prevention of fatty liver in rats fed clofibrate and orotic acid diets containing sucrose. Lab. Invest., 30, 732-750.
- Obach, R.S., Huynh, P., Allen, M.C. and Beedham, C. (2004): Human liver aldehyde oxidase: inhibition by 239 drugs. J. Clin. Pharmacol., 44, 7-19.
- Romeo, S., Kozlitina, J., Xing, C., Pertsemlidis, A., Cox, D., Pennacchio, L.A., Boerwinkle, E., Cohen, J.C. and Hobbs, H.H. (2008): Genetic variation in PNPLA3 confers susceptibility to nonalcoholic fatty liver disease. Nat. Genet., 40, 1461-1465.
- Sabesin, S.M., Frase, S. and Ragland, J.B. (1977): Accumulation of nascent lipoproteins in rat hepatic golgi during induction of fatty liver by orotic acid. Lab. Invest., 37, 127-135.
- Shibata, K. (1987): Blood pyridine nucleotide levels reflect niacin equivalent intake in humans. J. Clin. Biochem. Nutr., 3, 37-45.
- Shibata, K. (1989): Fate of excess nicotinamide and nicotinic acid differs in rats. J. Nutr., 119, 892-895.
- Takeuchi, K., Goto, H., Ito, Y., Sato, M., Matsumoto, S., Senba, T., Yamada, H. and Umehara, K. (2015): Dehydroepiandrosterone sulfate and cytochrome P450 inducers alleviate fatty liver in male rats fed an orotic acid-supplemented diet. J. Toxicol. Sci., 40, 181-191.
- Takeuchi, K., Yokouchi, C., Goto, H., Umehara, K., Yamada, H. and Ishii, Y. (2018): Alleviation of fatty liver in a rat model by enhancing N1-methylnicotinamide bioavailability through aldehyde oxidase inhibition. Biochem. Biophys. Res. Commun., 507, 203-210.
- Takuma, Y. and Nouso, K. (2010): Nonalcoholic steatohepatitis-associated hepatocellular carcinoma: our case series and literature review. World J. Gastroenterol., 16, 1436-1441.
- Turck, D., Bresson, J.L., Burlingame, B., Dean, T., Fairweather-Tait, S., Heinonen, M., Hirsch-Ernst, K.I., Mangelsdorf, I., McArdle, H.J., Naska, A., Neuhäuser-Berthold, M., Nowicka, G., Pentieva, K., Sanz, Y., Siani, A., Sjödin, A., Stern, M., Tomé, D., Vinceti, M., Willatts, P., Engel, K.H., Marchelli, R., Pöting, A., Poulsen, M., Schlatter, J.R., Gelbmann, W., Ververis, E. and van Loveren, H.; EFSA Panel on Dietetic Products, Nutrition and Allergies (NDA). (2017): Safety of 1-methylnicotinamide chloride (1-MNA) as a novel food pursuant to Regulation (EC) No 258/97. EFSA J., 15, e05001.
- Uddin, G.M., Youngson, N.A., Chowdhury, S.S., Hagan, C., Sinclair, D.A. and Morris, M.J. (2020): Administration of nicotinamide mononucleotide (NMN) reduces metabolic impairment in male mouse offspring from obese mothers. Cells, 9, 791.
- Vernon, G., Baranova, A. and Younossi, Z.M. (2011): Systematic review: the epidemiology and natural history of non-alcoholic fatty liver disease and non-alcoholic steatohepatitis in adults. Aliment. Pharmacol. Ther., 34, 274-285.
- Windmueller, H.G. (1964): An orotic acid-induced, adenine-revered inhibition of hepatic lipoprotein secretion in the rat. J. Biol. Chem., 239, 530-537.
- Windmueller, H.G. and Levy, R.I. (1967): Total inhibition of hepatic β-lipoprotein production in the rat by orotic acid. J. Biol. Chem., 242, 2246-2254.
- Wozniacka, A., Wieczorkowska, M., Gebicki, J. and Sysa-Jedrzejowska, A. (2005): Topical application of 1-methylnicotinamide in the treatment of rosacea: a pilot study. Clin. Exp. Dermatol., 30, 632-635.
- Yang, S.J., Choi, J.M., Kim, L., Park, S.E., Rhee, E.J., Lee, W.Y., Oh, K.W., Park, S.W. and Park, C.-Y. (2014): Nicotinamide improves glucose metabolism and affects the hepatic NAD-sirtuin pathway in a rodent model of obesity and type 2 diabetes. J. Nutr. Biochem., 25, 66-72.
- Younossi, Z.M., Koenig, A.B., Abdelatif, D., Fazel, Y., Henry, L. and Wymer, M. (2016): Global epidemiology of nonalcoholic fatty liver disease-Meta-analytic assessment of prevalence, incidence, and outcomes. Hepatology, 64, 73-84.


