Original Article
Elevated expression of miR-146 involved in regulating mice pulmonary dysfunction after exposure to PM2.5
2021 Volume 46 Issue 10 Pages 437-443
Details
2021 Volume 46 Issue 10 Pages 437-443
Exposure to atmospheric fine particulate matter has short-term and long-term adverse effects on pulmonary function, especially PM2.5; however, early lung function impairment is not easily detected in time. Notably, microRNAs (miRNAs) have been classified as novel biomarkers for diseases related to PM. Thus, the purpose of this study was to investigate whether miR-146 was related to the decline of lung function after exposure to air pollution. Thirty BALB/c mice were subjected to different concentrations of PM2.5 by noninvasive tracheal instillation for 56 days (two times one week), after which we detected the histopathological changes of mice lung, pulmonary functions, pro-inflammatory factors levels in bronchoalveolar lavage fluid (BALF) and lung tissue homogenate, and the relative expression of microRNA-146a and -146b. When BALB/c mice were exposed to 10 mg/kg PM2.5, severe changes such as widened alveolar interval and diffuse infiltration of macrophages with engulfed PM2.5 particles (dust cells) were found. Peak inspiratory flow (PIF) and peak expiratory flow (PEF) were decreased significantly. Expiratory resistance (Re) and inspiratory resistance (Ri) were increased significantly in the 5 mg/kg and 10 mg/kg PM2.5 groups, meanwhile lung resistance increased and MVV (maximum minute ventilation) decreased from the general tendency; however, pro-inflammatory factors interleukin-6 (IL-6), interferon-gamma (IFN-γ) and tumor necrosis factor-alpha (TNF-α) were increased dramatically. MiR-146a and miR-146b were elevated remarkably in the PM2.5 groups compared to the NS group. We also found miR-146 had negative relationships with PIF and PEF, especially miR-146b. Thus, elevated miR-146a and miR-146b may have a relationship with pulmonary dysfunction after PM2.5 chronic exposure.
Epidemiological studies have shown that exposure to air pollution, especially particulate matter, can lead to a serious impact on human health and result in increased mortality (Thompson, 2018; Losacco and Perillo, 2018; Liu et al., 2019). Lung function is an independent factor affecting the fatality rate of cardiopulmonary disease. Thus, the rapid decline of lung function is one of the most important indications of many cardiorespiratory diseases. In many animal models, aerosol particles, which are similar in diameter to atmospheric pollution particles, were found to be deposited mainly in small peripheral airways, resulting in small airway obstructions (Kuehl et al., 2012). However, the conventional spirometry does not fully detect peripheral small airway obstructions (Quanjer et al., 2014). On the one hand, the lung function test is not popularized in China, as it has the disadvantages of high cost, inconvenience and high requirement for equipment personnel; on the other hand, changes in airway function have been observed in patients with partial lower lung function, but the pulmonary function index FEV1/FVC may still be higher than 70%. Hence it is easy to miss diagnosis (Tantucci and Modina, 2012; Mannino et al., 2006). Therefore, it is urgent to find out screening indicators that can replace the lung function test and reflect early changes of lung function decline.
Studies showed that microRNAs play an important role in toxicological effects caused by air pollution (Chen et al., 2018; Farraj et al., 2011). Some studies have shown that atmospheric particulates can cause changes in expression of microRNAs (Vrijens et al., 2015; Yamamoto et al., 2013), and microRNAs (miRNAs) have been classified as novel biomarkers. The latest research found that miR-146a played important roles in lung functions of many respiratory diseases (Wang et al., 2015). Studies have been performed in healthy subjects with a normal pulmonary function and without respiratory complaints, indicating that changes in miR-146b play a role in aging-associated processes in the lung (Ong et al., 2019). Furthermore, our previous study also found miR-146a and -146b were up-regulated in a mouse model after exposure to PM2.5 (Hou et al., 2018). Based on the above evidence, we hypothesize that miRNA-146a and -146b may be involved in the inflammatory response associated with particulate matter, leading to decreased lung function.
This study intended to explore molecular mechanisms of reduced lung function induced by the atmospheric fine particles, and elucidate the relationship between the molecular markers (such as miR-146a and miR-146b) and lung function decline for the early detection of disease progression.
BALB/c mice (male, 8 weeks old, 23–25 g) were purchased from a laboratory animal facility in Beijing (license number: SCXK (JING) 2018-0011), and were allowed to adapt to the animal room conditions for one week before the study. Animals were housed in a specific pathogen-free environment and were kept on a 12-hr light/dark cycle, with temperatures (23–25°C) and 50%–70% humidity. Thirty mice were subjected to intratracheal instillation of 2.5, 5, or 10 mg/kg PM2.5 in this study, and the blank group and NS group (Normal Saline group) were set as the control group (n = 6 respectively per group). The experiment permission was issued by the Laboratory Animal Ethics Committee of Peking University first hospital (permit no. J201609).
Preparation of PM2.5 sampleThe PM2.5 high volume sampler system (Staplex PM2.5 SSI, Brooklyn, NY, USA) was set on the top of a building (about 20 m above the ground) at Peking University first hospital, which is located in the central area of Beijing city and is close to busy traffic roads. Sampling using glass fiber filters (20.3 × 25.4 cm) was done continuously at a flow rate of 1.13 m3/min for 96 hr in January 2017. Collected PM2.5 was pooled and refrigerated until use. PM2.5 was extracted from the filters into deionized water by sonication for 15–20 min three times, and then filtered with gauze. The collection and component analysis of PM2.5 was as described in the published literature (Hou et al., 2018). Extracted PM2.5 was lyophilized and suspended into saline to final concentrations suitable for 50 μL per mouse with the PM2.5 dose of 2.5, 5, or 10 mg/kg body weight.
The mice samples collection and pathological examination of lung tissueAnimals were sacrificed on the 56th day after intratracheal instillation under deep anesthesia. The trachea of anesthetized animal was exposed, cannulated, and instilled with 1 mL PBS lavage for three times. More than 80% volume of the instilled PBS could be recovered as BALF. BALF was then centrifuged at 1,500 rpm for 10 min. The supernatant was stored at −80°C for pro-inflammatory cytokines assay and lung tissue was collected for pathology examination. Ten mg of washed lung tissue (two lobes below the right lung) was placed in 90 mL cold normal saline, and the tissue blocks were cut up as soon as possible with ophthalmic scissors. After grinding thoroughly in a glass homogenizer for 6 min, the prepared 10% homogenate was centrifuged in a low-temperature centrifuge at about 3000 r/min for 10 min. The supernatant was taken and the sediment was discarded. It was stored in liquid nitrogen for lung tissue homogenates assay and microRNA quantification. Lung tissue near the hilar region of the left lung was taken and processed for light. For light microscopy, the lung tissue was fixed in 10% neutral buffered formaldehyde according to HE staining instructions.
Enzyme-linked immunosorbent assay (ELISA) for inflammatory factorsLevels of IL-6 in BALF supernatant and TNF-α, IFN-γ cytokines in lung tissue homogenate were measured by ELISA (Multiscience, Hangzhou, China, BD, Franklin Lake, NJ, USA), according to the manufacturer’s instructions.
Measurement of airway responsivenesLung function was tested after an intratracheal instillation of PM2.5 for 56 days using the AniRes 2005 lung function system (Bestlab, AniRes 2005, version 2.0, Beijing, China). Animals were anesthetized by intraperitoneal injection with 5% chloral hydrate 6–7 mL/kg and were then connected to a computer-controlled small animal ventilator via a tracheal cannula according to the manufacturer’s instructions. The respiratory rate was preset at 95 times per min and the time ratio of expiration/inspiration was 1.5:1. Mouse airway responsiveness was examined by expiratory resistance (Re), inspiratory resistance (Ri) and dynamic lung compliance (Cdyn), maximum minute ventilation (MVV), peak inspiratory flow (PIF), and peak expiratory flow (PEF). The relative area (R-area) was defined as the area under the peak curve of Re or Ri and beyond the baseline level during the 250 sec time frame. The distance from the wave trough to the baseline level of the Cdyn curve was adopted to quantitatively assess lung compliance.
Real-time PCR for miRNA expressionMiRNA abundance was quantified using the All-in-One EasyPure miRNA Kit (Transgen, Beijing, China). Briefly, microRNA was reversely transcribed using TransScript miRNA First-Strand cDNA Synthesis SuperMix (Transgen), and quantitative RT-PCR was carried out using a miRNA-specific forward primer and universal reverse primer. Data were normalized to small RNA U6 levels. The forward primers for the miR-146a and -146b were as follows:
(mmu-miR-146a: 5’-TgAgAACTgAATTCCATgggTT-3’;
mmu-miR-146b: 5’-TgAgAACTgAATTCCATAggCT-3’;
U6 forward: 5’-CTCgCTTCggCAgCACA-3’
U6 reverse: 5’-AACgCTTCACgAATTTgCgT-3’)
Amplification was performed according to the manufacturer’s cycling protocol and done in triplicate. Relative expression of miR-146a and -146b were evaluated by 2-ΔΔCT method .
Statistical analysisStatistical analyses were performed using the SPSS17.0 system and GraphPad Prism 5.0 software (GraphPad Software Inc., San Diego, CA, USA). Statistical differences among experimental groups were evaluated with one-way ANOVA, followed by LSD (least significant difference) multiple comparison post-hoc test. For the data of heterogeneity of variance, independent sample nonparametric tests with Kruskal-Wallis H Test were used. Spearman correlation analyses were taken to evaluate the relationship between miRNAs and lung function indexes. A P value of less than 0.05 was accepted as statistically significant. The difference in significance between groups was assessed as *p < 0.05; #p < 0.01.
Figure 1A shows normal lung tissue structure is clear, bronchial, alveolar and organizational structure of the normal alveolar septa, no alveolar septal infiltration of neutrophils, no congestion, edema and acute and chronic inflammation changes. However, hematoxylin-eosin (H-E) stained lung sections presented characteristic histological aspects related to PM2.5 exposure, including lymphocyte infiltration around terminal tract and alveolar walls and desquamation of bronchiolar epithelial cells (Fig. 1B). After exposure to 10 mg/kg PM2.5, severe changes such as widened alveolar interval and diffuse infiltration of macrophages with engulfed PM2.5 particles (dust cells) were found (Fig. 1C). Further, the inflammatory infiltration in bronchiole and alveolar was also displayed (Fig. 1D). Also some dust cells had penetrated to alveolar spaces.

Histopathological changes in lung after an intratracheal instillation of PM2.5. (A) A control lung showing terminal bronchiole and alveolar epithelia. (B) Mice lung instilled with 5 mg/kg PM2.5 showing bronchiole with inflammation, lung widened interval partly and falling off of epithelial cells (black arrow). (C and D) A mouse lung instilled with 10 mg/kg PM2.5 showing alveolar macrophages with engulfed particles (black short arrows) and inflammatory infiltration in bronchiole and alveolar (black long arrow). Bar = 200 µm.
Figure 2 shows the results of measurements of airway responsiveness after an intratracheal instillation of PM2.5. The R-area of the respiratory resistance (RL, including Re and Ri), peak values of Cdyn, Maximal Voluntary Ventilation (MVV), Peak Inspiratory Flow (PIF) and Peak Expiratory Flow (PEF) have been adopted as sensitive indices. Compared with the blank group and NS group, Ri and Re were increased significantly after treatment with 5 mg/kg and 10 mg/kg PM2.5 (Fig. 2A and B), and Cdyn had an increased tendency after treatment with PM2.5 (2.5, 5 and 10 mg/kg), there were no statistical differences (Fig. 2C). However, PIF and PEF were decreased significantly after treatment with 10 mg/kg PM2.5 (Fig. 2D and 2E). MVV had a decreased tendency, as shown in Fig. 2F.
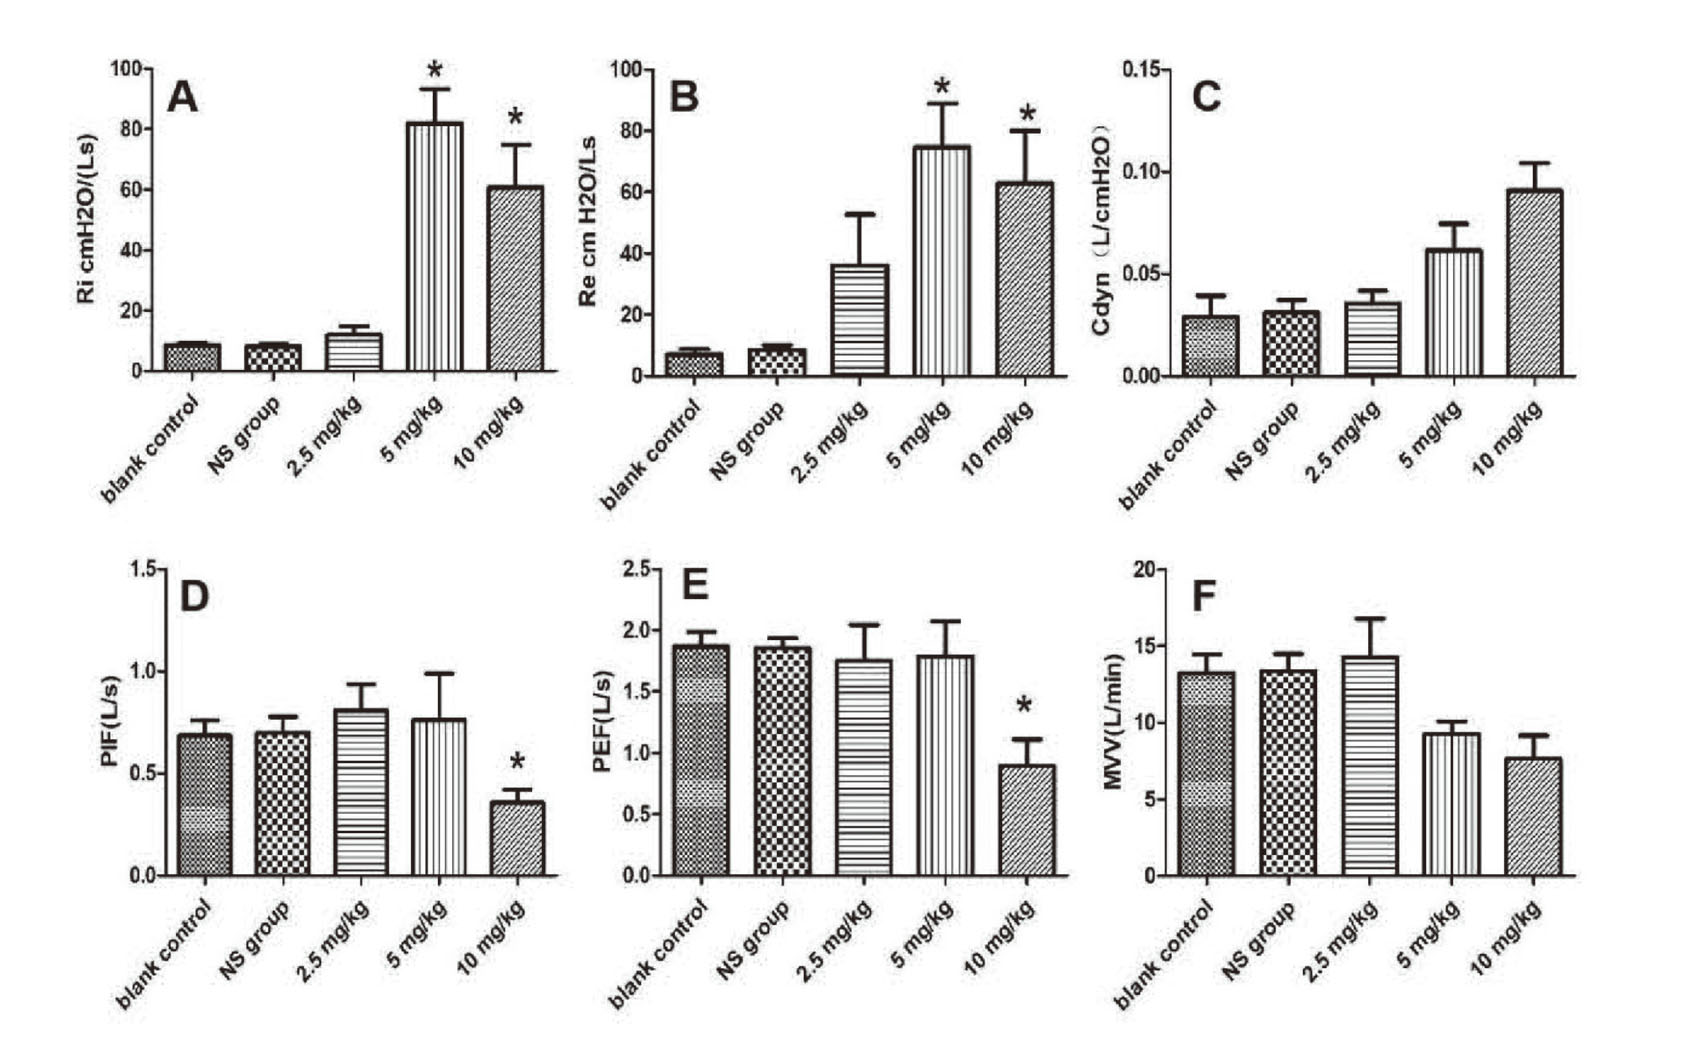
Airway responsiveness measurements of pulmonary function with different doses of PM2.5. (A) index evaluation of inspiratory resistance; (B) index evaluation of expiratory resistance; (C) the peak value of dynamic lung compliance; (D) index evaluation of peak inspiratory flow; (E) index evaluation of peak expiratory flow; (F) MVV value; n = 6 mice per group. *P < 0.05, compared with blank control group and NS group.
The pro-inflammatory cytokine of IL-6 in bronchoalveolar lavage fluid (BALF) were dose-dependently lightly increased after an intratracheal instillation of PM2.5 (Fig. 3A). We also detected the pro-inflammatory cytokine of TNF-α and IFN-γ in lung tissue homogenate; TNF-α were increased significantly after instillation with 10 mg/kg PM2.5 (Fig. 3B), and IFN-γ were increased significantly after instillation with 2.5 mg/kg and mg/kg PM2.5 (Fig. 3C). There was no significant difference between the blank control group and the NS group.

Pro-inflammatory cytokines in BALF and lung tissue homogenate after an intratracheal instillation of PM2.5. (A) Dose-dependent changes of IL-6 levels in BALF were measured after instillation with 2.5, 5 and 10 mg/kg PM2.5. (n = 6, mean ± SD). (B and C) the TNF-α and IFN-γ levels of lung tissue homogenate were increased significantly after instillation with PM2.5. (n = 6, values presented are means ± SEM), #p < 0.01 compared with blank control and NS group.
Figure 4 shows the expression levels of miR-146a and miR-146b in lung tissue of treatment groups, the blank control group and NS group. There was no significant difference between the blank control group and the NS group. Figure 4A shows that the expression levels of miR-146a in the lung tissue of the medium dose group and high dose group were obviously higher than that of the control group; it had dose-dependent effects. Figure 4B shows that the expression levels of miR-146b were up-regulated significantly compared to the control group.

The relative expression levels of miR-146a and miR-146b in lung after an intratracheal instillation of PM2.5. qRT-PCR analyzed expression levels of miR-146a and miR-146b in three treatment groups, compared to blank control and NS group. (A) the relative expression level of miR-146a; (B) the relative expression level of miR-146b. n = 6 mice per group. Data represent three independent experiments. n = 6, *P < 0.05, #P < 0.01, &P < 0.001.
In this study, a negative linear correlation between miRNAs (miR-146a and miR-146b) and pulmonary function indexes (PIF and PEF) was shown by Spearman correlation analysis, especially miR-146b (Table 1). However, there was no significant correlation between other pulmonary function indexes (Ri, Re, MVV and Cdyn) and miRNAs (miR-146a and miR-146b).
| miR-146a | miR-146b | ||||
|---|---|---|---|---|---|
| Spearman correlation | p value | Spearman correlation | p value | ||
| PIF | −0.495 | 0.026* | −0.647 | 0.002# | |
| PEF | −0.476 | 0.033* | −0.586 | 0.006# | |
| Ri | 0.384 | 0.057 | 0.423 | 0.063 | |
| Re | 0.336 | 0.061 | 0.441 | 0.065 | |
| Cydn | 0.493 | 0.08 | 0.635 | 0.053 | |
| MVV | −0.577 | 0.071 | −0.512 | 0.058 | |
Data are expressed as mean ± SEM; *p < 0.05, #p < 0.01.
Particulate matter, a major component of air pollutants, has been classified as a Group 1 carcinogen (carcinogenic to humans) (IARC, 2013). Meta analysis showed that PM2.5 had a more adverse effect on lung function than PM10 in children (Ward and Ayres, 2004). PM2.5 stimulates airway inflammation and induces airway oxidative stress, causing or worsening airway obstruction and leading to decreased lung function (Guo et al., 2019). The HEART study during the Olympic Games in 2008 showed that when air pollution improved during the Olympics, Zrs, Fres, Rc, Rp and R5~R35 IOS indexes were significantly decreased, and when the air pollution was serious again, and airway resistance increased (Wang et al., 2010).
Pulmonary function test can better evaluate the extent of airflow limitation, and is an indispensable tool for clinical diagnosis and treatment of respiratory diseases. Re and Ri are good indexes for detecting airflow limitation and airway resistance. PEF can better reflect the function of small airways, as it has high sensitivity to airflow limitation in small airways. This study showed that the PIF and PEF of mice after exposure to the atmospheric fine particles were significantly lower than the control group, and it had the dose-dependent effects, Ri and Re were increased significantly after treatment with 5 mg/kg and 10 mg/kg PM2.5, respiratory resistance increased significantly after treatment with PM2.5, and MVV had a decreased tendency, but there were no statistical difference. Thus, exposure to air pollution can lead to the decrease of mice lung function in different degrees. At present, there are few studies of air pollution and airway function indexes. In order to investigate the effects of long-term exposure to traffic-related air pollution on lung function, airway inflammation, some investigators of one study enrolled 1003 residents living in the Shichahai Community in Beijing; they found that long-term exposure to traffic-related air pollution in people who live near major roads in Beijing is associated with lower lung function (Hu et al., 2016).
After exposure to PM2.5, widened alveolar interval and diffuse infiltration of macrophages with engulfed PM2.5 particles (dust cells) were found, and BALF IL-6 levels and lung tissue TNF-α and IFN-γ of mice after an intratracheal instillation of PM2.5 were increased. Studies found that during phagocytosis of PM2.5 by alveolar macrophages, they released many proinflammatory cytokines (i.e., IL-6, IFN-γ, TNF-α) (van Eeden et al., 2001; Fujii et al., 2002); this was consistent with our results, in that they promote each other, which can accelerate the development of local inflammation and eventually lead to the remodeling of airway structure and the formation of airflow obstructions (Herfs et al., 2012). The expression levels of miR-146a and miR-146b were significantly up-regulated, and the expression of microRNAs was negatively correlated with decreased PIF and PEF, indicating that the atmospheric fine particles after exposure resulted in small airway flow was limited, and the elevated microRNAs played significant roles in regulating pulmonary dysfunction induced by PM2.5. Thus, elevated miR-146a and miR-146b may have a relationship with pulmonary dysfunction after PM2.5 chronic exposure.
Conflict of interestThe authors declare that there is no conflict of interest.