Abstract
We reported the enhanced liver-specific function and structure of HepG2 cells by the oxygenation culture via a collagen vitrigel membrane (CVM). The cells were conditioned in our laboratory for a long period, so their characteristics may change from the original HepG2 cells registered in RIKEN cell bank (RCB) with the number of 1648 (HepG2-RCB1648 cells). We named the conditioned HepG2-RCB1648 cells in our laboratory as HepG2-NIAS cells. Here, we clarified the features of HepG2 cells with three different culture histories by analyzing their morphology and viability, CYP3A4 activity, the potential to form bile canaliculus-like structures, and the expression of drug transporters. On plastic, HepG2-NIAS cells grew as a monolayer without the formation of large aggregates involving dead cells that were observed in HepG2-RCB1648 cells and HepG2-RCB1886 cells. In the oxygenation culture via a CVM, the CYP3A4 activity of HepG2-NIAS cells increased to almost half level in direct comparison to that of differentiated HepaRG cells cultured on a collagen-coated plate; however, that of HepG2-RCB1648 cells and HepG2-RCB1886 cells was almost not detected. HepG2-NIAS cells formed bile canaliculus-like networks in which fluorescein was accumulated after the exposure of fluorescein diacetate, although HepG2-RCB1648 cells and HepG2-RCB1886 cells did not possess the potential. Also, immunohistological observations revealed that HepG2-NIAS cells remarkably enhanced the expression of drug transporters, NTCP, OATP1B1, OATP1B3, BSEP, MDR1, MRP2, and BCRP. These results suggest that HepG2-NIAS cells are a new subline of HepG2 cells useful for drug development studies. HepG2-NIAS cells were registered in RCB with the number of 4679.
INTRODUCTION
Drug-induced liver injury (DILI) is a major cause of the failure in both clinical and post-approval stages of drug development and frequently brings on the withdrawal of drugs from the pharmaceutical market (Navarro and Senior, 2006; Onakpoya et al., 2016; European Association for the Study of the Liver, 2019; Meunier and Larrey, 2019). To select effective lead compounds by predicting DILI for many candidate chemicals in the early stage of drug development, a novel culture system of human liver organoids that can express liver-specific functions (e.g. metabolic enzyme, drug transporter) and structures (e.g. bile canaliculus, space of Disse) and provide high throughput analysis has been desired (Gevaert et al., 2014; Yang et al., 2016; Underhill and Khetani, 2018; Ide et al., 2020). The cell sources for fabricating such organoids are mainly classified into primary hepatocytes, induced pluripotent stem (iPS) cells-derived hepatocytes, and hepatoma-derived cell lines (Leite et al., 2016; Broutier et al., 2017; Xu et al., 2018; Seng et al., 2018). Although primary hepatocytes and iPS cells-derived hepatocytes express abundant liver functions, they cannot be stably supplied due to large lot differences and almost no proliferation capacity. While hepatoma-derived cell lines have poor liver functions, they can be stably supplied due to very small lot difference and high proliferation capacity.
Recently, we developed a novel culture technology that can rapidly not only activate the liver-specific functions of HepG2 cells, a human hepatoma cell line, but also form bile canaliculus-like networks between the cells by the oxygenation via a collagen vitrigel membrane (CVM) (Oshikata-Miyazaki and Takezawa, 2016). The cytochrome P450 (CYP) 3A4 activity of the activated HepG2 cells was about a half level in comparison to the previously reported value of differentiated HepaRG cells (Mueller et al., 2014; Oshikata-Miyazaki and Takezawa, 2016). The differentiated HepaRG cells are a newly developed human hepatoma cell line possessing CYP3A4 activity equivalent to the average level of freshly isolated human hepatocytes (Kanebratt and Andersson, 2008). Meanwhile, the HepG2 cell line has been widely used around the world in a variety of fields such as liver metabolism, development, oncogenesis, and hepatotoxicity since its establishment in 1979 (López-Terrada et al., 2009). It is generally known that monolayer HepG2 cells cultured on a non-coated plastic plate represent almost no CYP3A4 activity (Sa-ngiamsuntorn et al., 2011; Gevaert et al., 2014). Also, HepG2 cells with different culture histories have been stocked in local cell banks. The cell bank of RIKEN BioResource Center (BRC) had stocked two different HepG2 cell lines with RCB numbers of 1648 and 1886.
According to the data sheet, the history, feature, and culture medium of HepG2 cells registered in RIKEN cell bank (RCB) with the cell line number of 1648 (HepG2-RCB1648 cells) are described as a backup of ECA2870 derived from European Collection of Authenticated Cell Cultures, a hepatocellular carcinoma producing many liver-specific proteins such as alpha-fetoprotein, albumin, etc., and a minimum essential medium (MEM) supplemented with 10% fetal bovine serum (FBS) and 0.1 mM non-essential amino acids (NEAA) (RCB1648-medium), respectively. Meanwhile, those of HepG2 cells registered in RCB with the cell line number of 1886 (HepG2-RCB1886 cells) are described as a backup of TKG0205 derived from Cell Resource Center for Biomedical Research, Institute of Development, Aging and Cancer, Tohoku University, a human cell line derived from hepatocyte carcinoma, and a Dulbecco’s modified Eagle medium (DMEM) supplemented with 10% FBS (RCB1886-medium), respectively.
In our previous study, we used the HepG2-RCB1648 cells repeatedly subcultured for a long period in a DMEM supplemented with 10% heat-inactivated FBS, 20 mM N-2-hydroxyethylpipearadine-N’-2-ethansulfonic acid (HEPES), 100 units/mL penicillin, and 100 μg/mL streptomycin (NIAS-medium) instead of the RCB1648-medium, using our culture technique for diminishing the occasion of cellular damage. Therefore, the characteristics of the HepG2-RCB1648 cells could have altered in such a long conditioning operation. Recently, we named the conditioned HepG2-RCB1648 cells in our laboratory at the Institute of Agrobiological Sciences, National Agriculture and Food Research Organization (NIAS) as “HepG2-NIAS cells” and deposited them in the cell bank of RIKEN BRC. Consequently, the HepG2-NIAS cells were newly registered in RCB with the cell line number of 4679.
In this study, we aimed to clarify the features of HepG2 cells with three different culture histories, HepG2-NIAS cells, HepG2-RCB1648 cells, and HepG2-RCB1886 cells, by investigating their morphology and viability, CYP3A4 activity, the potential to form bile canaliculus-like structures, and the expression of drug transporters. Also, we precisely described the culture methods of HepG2-NIAS cells for maintaining their characteristics and for fabricating a hepatic lobule model in a CVM chamber.
MATERIALS AND METHODS
Reagents
Hoechst 33342 was purchased from Dojindo Laboratories (Kumamoto, Japan). Normal goat serum, MEM, FBS, Hanks’ balanced salt solution (HBSS), and fluorescein diacetate (FD) were purchased from Sigma-Aldrich (St. Louis, MO, USA). DMEM, NEAA, HEPES, antibiotics (penicillin and streptomycin), and LIVE/DEAD Viability/Cytotoxicity kit were purchased from Life Technologies Corp. (Grand Island, NY, USA). HepaRGTM thaw, seed, general purpose supplement, and HepaRGTM maintenance/metabolism supplement, basal hepatic cell medium were purchased from Biopredic International (Saint Gregoire, France). P450-Glo CYP3A4 assay kit with Luciferin-IPA were purchased from Promega (Madison, WI, USA). All other reagents not specified above were commercial products of the highest grade.
Cells
HepG2-RCB1648 cells (Lot number: 027) and HepG2-RCB1886 cells (Lot number: 017) were obtained from RIKEN BioResource Center (Ibaraki, Japan). HepG2-NIAS cells were spontaneously established by the repeat conditioning treatment of sub-culturing HepG2-RCB1648 cells (Lot number: 004) more than 10 passages and preserving the cells in liquid nitrogen for more than several years using our culture technique for diminishing the occasion of cellular damage. Three kinds of HepG2 cells with different culture histories, HepG2-RCB1648 cells (passage number: 4-5), HepG2-RCB1886 cells (passage number: 4-5), and HepG2-NIAS cells (passage number: 13-17), were subjected to the analyses for cell morphology and viability, CYP3A4 activity, the potential to form bile canaliculus-like structures, and the expression of drug transporters after proliferating those cells in a subculture. Also, differentiated HepaRGTM cells purchased from Biopredic International were directly subjected to the assay of CYP3A4 activity.
Thaw of frozen cells and following subculture
HepG2-RCB1648 cells and HepG2-RCB1886 cells were cultured in an RCB1648-medium and an RCB1886-medium by the traditional culture technique according to the data sheet of RIKEN Cell Bank, respectively. Briefly, the culture was started by thawing the frozen cells preserved in liquid nitrogen, mixing the thawed cell suspension with an appropriate volume of each medium in a conical tube, separating and removing the supernatant containing dimethylsulfoxide (DMSO) from the precipitate by centrifugation at 200 g for 5 min, re-suspending the precipitated cells in an appropriate volume of each medium, and pouring the cell suspension into a non-coated plastic culture flask. The subculture was performed by washing the cells at a confluent stage with phosphate-buffered saline (PBS) twice, treating the cells with 0.25% trypsin and 1.0 mM EDTA, harvesting the mostly dispersed cell suspension with an appropriate volume of each medium in a conical tube, separating and removing the supernatant from the precipitate by centrifugation at 200 g for 5 min, and re-suspending the precipitated cells in an appropriate volume of each medium, and pouring the cell suspension into new culture flasks.
HepG2-NIAS cells were cultured in a NIAS-medium according to our culture technique for diminishing the occasion of cellular damage. The particular component supplemented in a NIAS-medium is 20 mM HEPES, which buffers the medium and protects HepG2-NIAS cells from acidic stress caused by lactic acid metabolized from glucose as cells grow. Briefly, the culture was started by thawing the frozen cells preserved in liquid nitrogen, mixing a thawed cell suspension with the NIAS-medium of ten to fifteen times volume, and pouring the cell suspension containing DMSO less than 1% into a non-coated plastic culture flask. After culturing for several hours until almost all the cells have adhered, the culture medium containing DMSO was changed to a fresh NIAS-medium. Avoiding centrifugation with high concentration of DMSO is important for prevention of cellular damage caused by DMSO. The subculture was performed by washing the cells at a pre-confluent stage with PBS twice, treating the cells with 0.05% trypsin and 0.53 mM EDTA, harvesting the mostly dispersed cell suspension with an appropriate volume of NIAS-medium in a conical tube, separating and removing the supernatant from the precipitate by centrifugation at 100 g for 3 min, re-suspending the precipitated cells in an appropriate volume of NIAS-medium, removing the cell aggregates by filtration using a 40 μm-mesh, and pouring the filtrated cell suspension into new culture flasks. Milder centrifugation condition compared to the traditional one for HepG2-RCB1648 cells and HepG2-RCB1886 cells is also key for prevention of cellular damage.
All cells were grown at 37°C in a humidified atmosphere of 5% CO2 and 95% air. The culture media were changed every other day.
Cell morphology and viability
HepG2-NIAS cells, HepG2-RCB1648 cells, and HepG2-RCB1886 cells cultured for 3 days on the non-coated plastic plates were subjected to the assay of cell morphology and viability. Briefly, the cells suspended in 2.0 mL of each culture medium at the cell density of 2.4 x 10⁵ cells/mL were seeded in a well (9.6 cm2) of a 6-well non-coated plastic plate (i.e. an initial cell density of 5.0 x 10⁴ cells/cm2) and cultured for 3 days. Each culture medium was changed every day. Cell viability was analyzed by using LIVE/DEAD Viability/Cytotoxicity Kit composed of calcein-AM and ethidium homodimer-1. The cells were washed twice with 2.0 mL of HBSS and were incubated for 10 min in 2.0 mL of HBSS containing 4 µM calcein-AM and 2 µM ethidium homodimer-1 at 37°C. Then, the cells were observed with a fluorescent and phase-contrast microscope in the same visual field (TE300; Nikon, Tokyo, Japan).
Preparation of CVM chambers
A chamber (ad-MED VitrigelTM) with 1.0 cm2 of a collagen xerogel membrane (CXM) containing 0.5 mg type-I collagen was purchased from Kanto chemical Co., Inc. (Tokyo, Japan). The CXM chamber was set in a well of a 12-well plate. The CXM was immersed in each culture medium by pouring 2.0 mL outside and 0.5 mL inside the chamber in the well for 10 min to convert the xerogel into a vitrigel immediately before use, resulting in the preparation of a chamber with a CVM of about 20 μm in thickness. The CVM chamber after removing the culture media was transferred onto the center of a silicone-coated polyethylene terephthalate (PET) film in round shape with a diameter of 21 mm and dried for 30 min in a clean bench to obtain the chamber of which the bottom surface-weakly attached to the film (Supplemental Fig. 1a).
Oxygenation culture via a CVM
HepG2-NIAS cells, HepG2-RCB1648 cells, and HepG2-RCB1886 cells were cultured for 2 days on the liquid-solid interface and for an additional 1 day on the liquid-gas interface by improving the previously reported method (Oshikata-Miyazaki and Takezawa, 2016). Briefly, the cells suspended in 0.50 mL of each culture medium at the cell density of 1.0 x 10⁵ cells/mL were seeded in a CVM chamber (1.0 cm2) with a silicone-coated PET film pre-set in a culture dish with a diameter of 60 mm (i.e. an initial cell density of 5.0 x 10⁴ cells/cm2) and cultured for 2 days on the liquid-solid interface (Supplemental Fig. 1b). Subsequently, the silicone-coated PET film was gently detached from the bottom surface of the CVM chamber by pouring 5.0 mL of each culture medium in the outside of the chambers (Supplemental Fig. 1c-1e). Then, the CVM chamber in which cells uniformly proliferated was transferred to an empty well of a 12-well plate and the cells were cultured for additional 24 hr on the liquid-gas interface (Supplemental Fig. 1f). Each culture medium inside the chamber was changed every day.
CYP3A4 activity
Differentiated HepaRG cells were cultured for 4 days on a collagen-coated plate in accordance with the manufacture's culture protocol for the metabolism studies under keeping a high level of CYP activities. Briefly, the cells suspended in 0.50 mL of a thaw, seed, and general purpose medium at the cell density of 9.6 x 10⁵ cells/mL were seeded in a well (1.88 cm2) of a 24-well plate coated with type-I collagen (i.e. an initial cell density of 2.6 x 10⁵ cells/cm2) and cultured for 1 day. Subsequently, the culture medium was changed to a maintenance and metabolism medium and cultured for additional 3 days. Here, the thaw, seed, and general purpose medium was prepared by adding 13.8 mL of a HepaRG thaw, seed, general purpose supplement to 100 mL of a basal hepatic cell medium. Also, the maintenance and metabolism medium was prepared by adding 15.3 mL of a HepaRG maintenance / metabolism supplement to 100 mL of a basal hepatic cell medium. Meanwhile, HepG2-NIAS cells, HepG2-RCB1648 cells, and HepG2-RCB1886 cells were cultured for 3 days on the collagen-coated plate. Briefly, the cells suspended in 0.94 mL of each culture medium at the cell density of 1.0 x 10⁵ cells/mL were seeded in a well (1.88 cm2) of a 24-well plate coated with type-I collagen (i.e. an initial cell density of 5.0 x 10⁴ cells/cm2) and cultured for 3 days. Each culture medium was changed every day.
Differentiated HepaRG cells, HepG2-NIAS cells, HepG2-RCB1648 cells, and HepG2-RCB1886 cells subjected to control culture on the collagen-coated plates, and HepG2-NIAS cells, HepG2-RCB1648 cells, and HepG2-RCB1886 cells subjected to oxygenation culture via a CVM were used for the assay of CYP3A4 activity. The cellular CYP3A4 activity in each culture was basically measured using a GloMax luminometer (E6501; Promega, Madison, WI, USA) in accordance with the manufacturer's protocol for P450-Glo CYP3A4 assay kit with a Luciferin-IPA substrate except for adapting the amount of reactive agents corresponding to the culture area and subsequently, calculated as the value of relative luminescence unit (RLU) per 106 cells.
Uptake and secretion of FD
HepG2-NIAS cells, HepG2-RCB1648 cells, and HepG2-RCB1886 cells subjected to oxygenation culture via a CVM were used for the assay using FD for investigating the potential to form bile canaliculus-like structures in accordance with the previous method (Oshikata-Miyazaki and Takezawa, 2016). Briefly, culture media inside the CVM chambers were changed to 0.5 mL of each fresh medium containing 250 μg/mL FD, and subsequently the cells were cultured for 60 min to sufficiently incorporate FD and metabolize it into fluorescein in their cytosol. Then, the culture media were removed and the cells were rinsed with 0.5 mL of HBSS twice to discontinue the FD incorporation. Subsequently, the CVM chambers were transferred onto a solid plastic surface to obtain optimal focus under the microscope. Then, the cells in each chamber were incubated for an additional 60 min at room temperature and the excretion behavior of metabolized fluorescein was observed at 30, and 60 min with a fluorescent microscope and phase-contrast microscope in the same visual field (TE300; Nikon).
Expression of drug transporters
A culture vessel with a glass slide bottom (FalconTM 4-well Culture Slide) was purchased from Corning Inc. (Corning, NY, USA). HepG2-NIAS cells, HepG2-RCB1648 cells, and HepG2-RCB1886 cells suspended in 0.85 mL of each culture medium at the cell density of 1.0 x 10⁵ cells/mL were seeded in a well (1.7 cm2) of the culture vessel (i.e. an initial cell density of 5.0 x 10⁴ cells/cm2) and cultured for 3 days. Each culture medium in the well was changed every day. HepG2-NIAS cells, HepG2-RCB1648 cells, and HepG2-RCB1886 cells subjected to control culture on the glass slide and oxygenation culture via a CVM were used for the immunofluorescent staining for drug transporters and the counterstaining for nuclei.
The cells were fixed in 10% formalin neutral buffer solution for 30 min at room temperature and washed with PBS three times. Subsequently, they were permeabilized and blocked in PBS containing 0.5% Triton X-100 and 1% normal goat serum for 30 min. The cells with CVM were isolated from the plastic frame of the chamber using an appropriate disposable biopsy punch and transferred onto a glass slide. For detecting sodium taurocholate cotransporting polypeptide (NTCP), organic anion transporting polypeptide (OATP) 1B1, OATP1B3, multidrug resistance-associated protein (MRP) 3, MRP4, bile salt export pump (BSEP), multidrug resistance (MDR) 1, and MRP2, specimens were incubated with first antibodies prepared in PBS for 16 hr at 4°C, followed by washing with PBS three times. Subsequently, they were incubated with secondary antibodies prepared in PBS for 1 hr at room temperature, followed by washing with PBS three times. The following primary antibodies were used: goat polyclonal antibody anti-NTCP (1:100, SC-107032; Santa Cruz Biotechnology, Santa Cruz, CA, USA), rabbit polyclonal antibody anti-OATP1B1 (1:100, LS-C161285; LifeSpan BioScience, Seattle, WA, USA), mouse monoclonal antibody anti-OATP1B3 (1:500, LS-C193437; LifeSpan BioScience), rabbit polyclonal antibody anti-MRP3 (1:200, SC-20767; Santa Cruz Biotechnology), goat polyclonal antibody anti-MRP4 (1:500, SC-5767; Santa Cruz Biotechnology), goat polyclonal antibody anti-BSEP (1:100, SC-17292; Santa Cruz Biotechnology), mouse monoclonal antibody anti-MDR1 (1:100, SC-55510; Santa Cruz Biotechnology), and mouse monoclonal antibody anti-MRP2 (1:50, SC-59611; Santa Cruz Biotechnology). The secondary antibodies used were: fluorescein isothiocyanate (FITC)-conjugated goat anti-mouse IgG (1:200, SC-2010; Santa Cruz Biotechnology), Texas RedTM (TR)-conjugated goat anti-mouse IgG (1:200, SC-2781; Santa Cruz Biotechnology), FITC-conjugated donkey polyclonal antibody anti-goat IgG (1:200, SC-2024; Santa Cruz Biotechnology), and TR-conjugated goat polyclonal antibody anti-rabbit IgG (1:200, SC-2780; Santa Cruz Biotechnology). For detecting breast cancer resistance protein (BCRP), specimens were incubated with FITC-conjugated rabbit polyclonal antibody anti-BCRP (1:500, LS-C252383; LifeSpan BioScience) for 1 hr at room temperature, followed by washing with PBS three times. Cell nuclei were counterstained with Hoechst 33342. Stained specimens were observed by a laser-scanning confocal microscope (model FV1000; Olympus, Tokyo, Japan). In the unit area of 127 μm x 127 μm on three different microphotographs, the expression area of each drug transporter and the number of cell nuclei were measured using software (ImageJ; National Institutes of Health, Bethesda, MD, USA). The expression level of each transporter was calculated as the expression area of each drug transporter per cell nucleus.
Statistical analysis
Data obtained from 3 independent experiments were analyzed by the Student’s t-test. Values are presented as the mean ± standard deviations. The value of *P < 0.005 was considered to indicate statistically significant differences.
RESULTS
Cell morphology and viability
Cell morphology and viability of HepG2-NIAS cells, HepG2-RCB1648 cells, and HepG2-RCB1886 cells cultured for 3 days on the non-coated plastic plates are shown in Fig. 1. HepG2-NIAS cells formed around 80% confluency in monolayer with tiny piled-up multicellular aggregates and almost all cells were alive (Fig. 1a and 1d). In contrast, HepG2-RCB1648 cells formed around 50% confluency in monolayer with large piled-up multicellular aggregates and the cells were almost alive in the monolayer and partially dead in the aggregates (Fig. 1b and 1e). Also, HepG2-RCB1886 cells formed around 90% confluency in monolayer with large piled-up multicellular aggregates and the cells were almost alive in the monolayer and mostly dead in the aggregates (Fig. 1c and 1f). These data demonstrated that HepG2-NIAS cells did not form large piled-up multicellular aggregates involving dead cells in the proliferating process of cells towards a confluent stage in comparison to HepG2-RCB1648 cells and HepG2-RCB1886 cells.

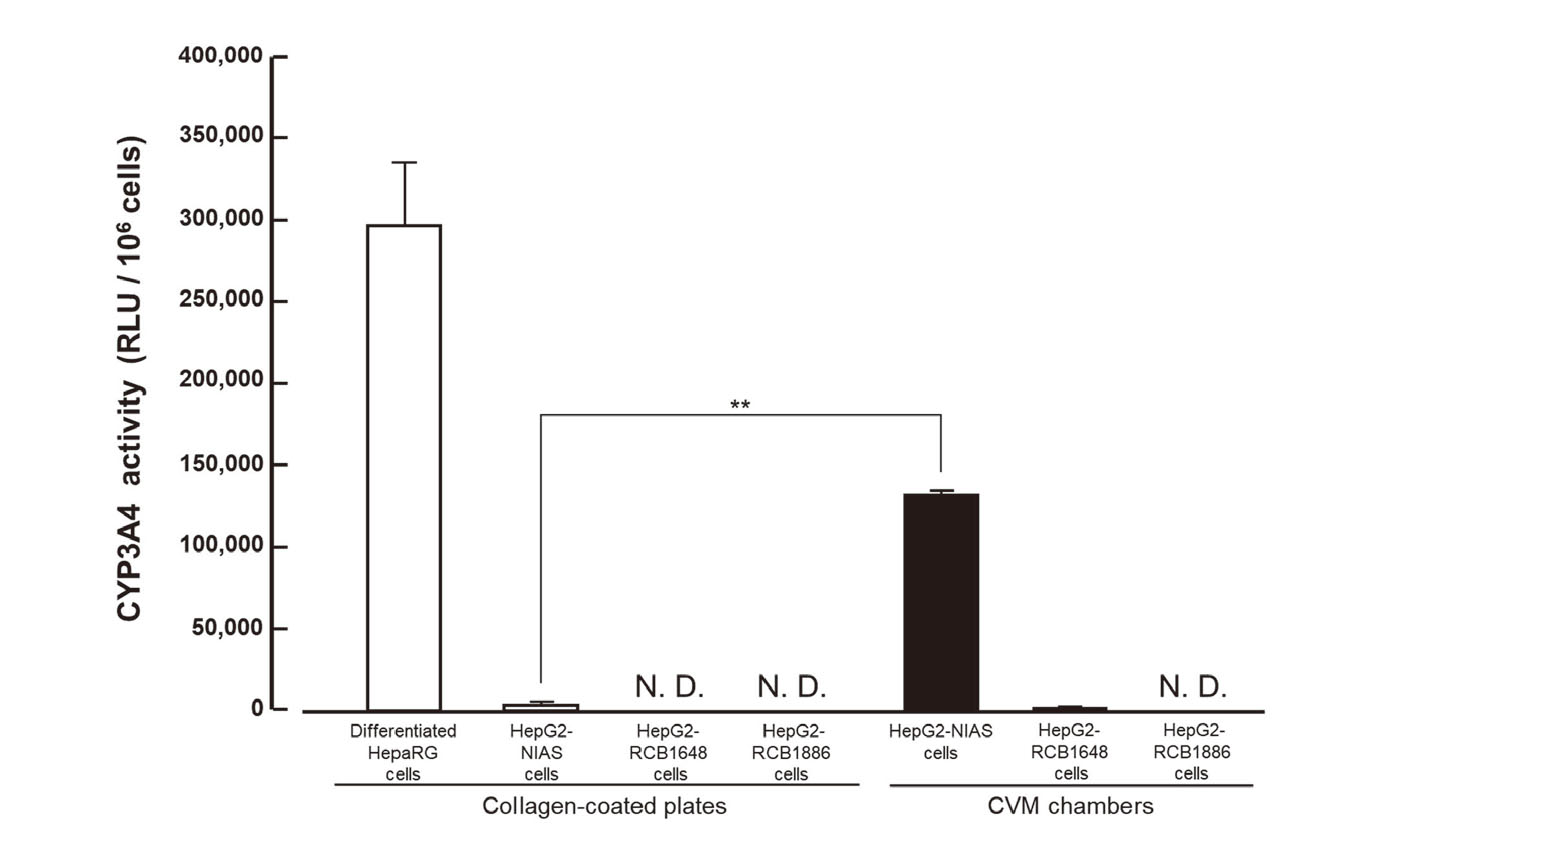
The CYP3A4 activity levels of differentiated HepaRG cells, HepG2-NIAS cells, HepG2-RCB1648 cells, and HepG2-RCB1886 cells are shown in Fig. 2. The activity value of differentiated HepaRG cells was 297,028 ± 37,997 RLU/106 cells. Meanwhile, the activity values of HepG2-NIAS cells in control culture on collagen-coated plates and in oxygenation culture via a CVM were 3,117 ± 179 RLU/106 cells and 132,385 ± 2,724 RLU/106 cells, respectively. Also, the activity value of HepG2-RCB1648 cells in control culture was not detected although that in oxygenation culture was detected as 1,167 ± 360 RLU/106 cells. Further, the activity values of HepG2-RCB1886 cells were not detected in both control culture and oxygenation culture. These data demonstrated that the CYP3A4 activity of HepG2-NIAS cells and HepG2-RCB1648 cells was enhanced by the oxygenation culture via a CVM and the enhanced CYP3A4 activity of HepG2-NIAS cells was equivalent to an almost half level of the CYP3A4 activity of differentiated HepaRG cells.
Fluorescent microscopic observations after incorporating FD into HepG2-NIAS cells, HepG2-RCB1648 cells, and HepG2-RCB1886 cells subjected to oxygenation culture via a CVM are shown in Fig. 3. The phase-contrast microscopic observation revealed that HepG2-NIAS cells formed a monolayer with typical bile canaliculus-like aspect while HepG2-RCB1648 cells and HepG2-RCB1886 formed large multicellular aggregates (Fig. 3a-3c). The metabolite fluorescein was well distributed in the cytosol of all cells 10 min after discontinuing the FD incorporation (Supplemental Fig. 2a-2c). At 30 min, fluorescein was slightly excreted to the outside of HepG2-NIAS cells and HepG2-RCB1886 cells (data not shown) while it was scarcely retained in HepG2-RCB1648 cells (Fig. 3e). At 60 min, many bile pockets accumulating fluorescein and their networks, i.e. bile canaliculus-like structures were clearly confirmed in HepG2-NIAS cells (Fig. 3d) although those structures, were not detectable in HepG2-RCB1648 cells (data not shown) and HepG2-RCB1886 cells (Fig. 3f).

Expression of drug transporters in HepG2-NIAS cells, HepG2-RCB1648 cells, and HepG2-RCB1886 is shown in Fig. 4 and Supplemental Fig. 3. All cells in control culture on glass slides and HepG2-RCB1886 cells in oxygenation culture via a CVM expressed almost nothing of every transporter. Meanwhile, HepG2-NIAS cells in oxygenation culture abundantly expressed NTCP, OATP1B1, OATP1B3, BSEP, MDR1, MRP2, and BCRP although they did almost nothing of MRP3 and MRP4. Also, HepG2-RCB1648 cells in oxygenation culture moderately expressed MRP3 and MRP4 although they did almost nothing of NTCP, OATP1B1, OATP1B3, BSEP, MDR1, MRP2, and BCRP. These data demonstrated that the expression of NTCP, OATP1B1, OATP1B3, BSEP, MDR1, MRP2, and BCRP in HepG2-NIAS cells and that of MRP3 and MRP4 in HepG2-RCB1648 cells was induced by the oxygenation culture via a CVM.
DISCUSSION
A novel technology for preparing a CVM composed of high-density collagen fibrils equivalent to connective tissues in vivo was invented as previously described (Takezawa et al., 2004). The CVM possesses excellent transparency and permeability of protein with high molecular weight, and consequently the various studies utilizing it as a cell culture scaffold have advanced well (Takezawa et al., 2007a, 2007b; Ko et al., 2008; Uchino et al., 2009). Moreover, the CVM chambers for fabricating culture models useful for absorption, distribution, metabolism, excretion, and toxicity (ADME/Tox) assays of chemicals were successfully devised (Takezawa et al., 2012). The CVM chambers provide four different culture systems that can facilitate the cell culture on the interfaces of liquid-solid, liquid-liquid, liquid-gas, and gas-liquid. Taking advantage of each interface culture, a human corneal epithelium model useful for the eye irritancy test was fabricated in the CVM chamber by culturing human corneal epithelial cells on the liquid-liquid and following gas-liquid interfaces (Yamaguchi et al., 2013, 2016). A microvascular endothelial model useful for the analysis of endothelial barrier function was fabricated by coculturing human microvascular endothelial cells and human dermal fibroblasts on the liquid-liquid interface via a CVM (Uzu and Takezawa, 2020). Also, we succeeded in not only activating the liver-specific functions of HepG2 cells (current HepG2-NIAS cells) but also reconstructing bile canaliculus-like networks among the cells by utilizing the interface culture of liquid-solid and following liquid-gas, i.e. the oxygenation culture via a CVM (Oshikata-Miyazaki and Takezawa, 2016).
The focus of this study is to clarify the differences among HepG2-NIAS cells, HepG2-RCB1648 cells, and HepG2-RCB1886 cells by analyzing (i) the cell morphology and viability in sub-culture using a non-coated plastic plate, (ii) the CYP3A4 activity level of those cells in direct comparison to that of differentiated HepaRG cells, (iii) the potential to form bile canaliculus-like structures, and (iv) the expression of drug transporters. Here, the culture history of HepG2-NIAS cells is close to HepG2-RCB1648 cells rather than HepG2-RCB1886 cells because they are derived from HepG2-RCB1648 cells. In the cell morphology and viability assay, HepG2-NIAS cells represented the tendency to grow well in monolayer without the formation of large piled-up cell aggregates involving dead cells that was observed in the sub-culture of HepG2-RCB1648 cells and HepG2-RCB1886 cells (Fig. 1). Regarding the CYP3A4 activity level in the control culture on collagen-coated plates, the activity of HepG2-NIAS cells was detected as about 1/100 level in direct comparison to that of differentiated HepaRG cells although that of HepG2-RCB1648 cells and HepG2-RCB1886 cells was not detected. Concerning the CYP3A4 activity level in the oxygenation culture via a CVM, the activity of HepG2-NIAS cells and HepG2-RCB1648 cells was enhanced to almost half and about 1/250 levels in direct comparison to that of differentiated HepaRG cells, respectively (Fig. 2). Hepatic structure of HepG2-NIAS cells subjected to oxygenation culture via a CVM was verified by their potential to form bile canaliculus-like structures while HepG2-RCB1648 cells and HepG2-RCB1886 cells did not form them (Fig. 3).
There seems to be a causal relationship between the morphology of hepatocytes and their liver-specific function. For example, it is well known that primary human and rat hepatocytes sandwiched by Matrigel form multicellular aggregates (Deharde et al., 2016; Moghe et al., 1996). The biliary efflux measurement using 5- (and 6)-carboxy-2-, 7-dichlorofluorescein diacetate in primary human hepatocytes sandwiched by Matrigel revealed that its fluorescent metabolite was accumulated in bile canaliculus-like structures observed among the monolayered cells and in intracellular vesicles in the aggregated cells (Deharde et al., 2016). Also, it is reported that culturing primary rat hepatocytes on poly (D, L-glycolic-co-lactic acid) copolymer with various pore sizes resulted in a higher albumin secretion level with a smaller multicellular aggregation area in proportion to the pore size of the copolymer (Ranucci and Moghe, 1999). These results suggest that culturing HepG2-NIAS cells with less multicellular aggregates is a key for them to show a high CYP3A4 activity and a high potential to form bile canaliculus-like structures. Meanwhile, it is reported that cell detachment of human umbilical vein endothelial cells using 0.025% trypsin promoted more rapid cell adhesion onto a glass slide and followoing cell spread compared to 0.5% trypsin (Brown et al., 2007). It is assumed that our culture technique for diminishing the occasion of cellular damage using 0.05% trypsin insteatd of traditional 0.25% trypsin in the subculture of HepG2-NIAS cells promoted not the cell-cell adhesion but the rapid cell adhesion onto a plastic and a CVM, resulting the inhibition of forming multicellular aggregates.
To elucidate the difference in the metabolism and excretion of FD among HepG2-NIAS cells, HepG2-RCB1648 cells, and HepG2-RCB1886 cells, the expression levels of drug transporters were compared (Fig. 4). The protein expression of sinusoidal transporters that mediate uptake of drugs from outside cells (NTCP, OATP1B1, and OATP1B3) and canalicular transporters that mediate efflux of drugs from the cytosol to bile pockets (BSEP, MDR1, MRP2, and BCRP) was significantly higher in HepG2-NIAS cells in oxygenation culture via a CVM than in control culture on the glass slide. However, the expression level of sinusoidal transporters that mediate efflux of drugs from the cytosol to outside cells (MRP3 and MRP4) was almost not confirmed in HepG2-NIAS cells subjected to not only control but also oxygenation culture. Meanwhile, a fluorescein derivative is known to be a substrate for MRP2 and MRP3, suggesting that the altered expression level of those transporters may affect the intracellular behavior of fluorescein (Zamek-Gliszczynski et al., 2003). It is expected that the high expression level of MRP2 and low expression level of MRP3/MRP4 contribute to the accumulation of fluorescein in bile canaliculus-like networks in HepG2-NIAS cells in oxygenation culture. In contrast, the expression level of all transporters we analyzed in the present study was almost not confirmed in HepG2-RCB1886 cells subjected to not only control but also oxygenation culture. Interestingly, only the expression level of MRP3 and MRP4 was remarkably enhanced in HepG2-RCB1648 cells in oxygenation culture compared to control culture. Those transporters are known to be upregulated in the liver of patients with cholestasis and cholestatic model rats probably to eliminate accumulated bile acids out of hepatocytes (Gradhand et al., 2008, Donner and Keppler, 2001). Meanwhile, it is reported that histone H3K4 trimethylation is essential for the transcription of BSEP, NTCP, and MRP2 genes, which is downregulated in the liver of cholestatic model mice (Ananthanarayanan et al., 2011). Taking these findings together, oxygenation culture via a CVM partly brought out liver-specific functions of HepG2-RCB1648 cells but the bile acid elimination pathway was not fully activated probably due to epigenetic aberration, resulting in the cholestasis-like condition. Then, fluorescein was rapidly excreted outside the cells via upregulated MRP3 and MRP4 as shown in Fig. 3e.
In the current study, we revealed that each HepG2 cell line has an individual cellular phenotype and HepG2-NIAS cells are a new subline of HepG2 cells whose liver-specific functions are rapidly enhanced by oxygenation culture via a CVM. We confirmed that HepG2-NIAS cells with passage number of 14, 17, 20, 23, 26 subjected to oxygenation culture showed the same CYP3A4 activity level, suggesting the high reproducibility (data not shown). Watari et al. (2018) reported that fresh hepatocytes isolated from liver-humanized chimeric mice (PXB-mice®) cultured on a liquid-liquid interface via a CVM maintained a higher activity of CYP isoforms majorly responsible for drug metabolism than those cultured on a collagen-coated plastic plate for over 2 weeks. Also, a CVM contributed to the efficient differentiation of human iPS cells into hepatocyte-like cells (Nakai et al., 2019). Interestingly, only HepG2-NIAS cells subjected to the oxygenation culture via a CVM showed increased liver-specific functions while those cultured on a plastic or a liquid-liquid interface via a CVM did not (Oshikata-Miyazaki and Takezawa,2016). It is reported that undifferentiated HepaRG cells cultured under hyperoxia (40% O2) increased hepatocyte differentiation with higher mRNA expression of hepatic transcription factors such as One cut homeobox 2 (ONECUT2) and Forkhead box A3 (FOXA3) and with liver-specific functions such as urea synthesis and CYP3A4 activity in comparison to those cultured under normoxia (21% O2) although those cultured under hypoxia (5% O2) inhibited hepatic differentiation (van Wenum et al., 2018). It is speculated that expression of hepatic transcription factors might be induced in monolayered HepG2-NIAS cells subjected to oxygenation culture, and consequently the cells activated liver-specific functions. On the other hand, the center of large multicellular aggregates of HepG2-RCB1648 cells and HepG2-RCB1886 cells might be hypoxic condition, which inhibited the induction of hepatic transcription factors. The putative disadvantage of the current oxygenation culture is that it may cause intracellular oxidative stress. Sekine et al. reported that intracellular oxidative stress caused internalization of MRP2 into cytosol in hepatocytes (Sekine et al., 2008). Therefore, it is plausible that oxygenation could induce the dominant localization of transporters in cytosol not on plasma membrane in HepG2-NIAS cells as shown in Fig. 4. We are going to elucidate the mechanism by which oxygenation culture via a CVM enhanced liver-specific functions and affected the localization of transporters in HepG2-NIAS cells in a future study.
It is expected that the characteristics of HepG2-NIAS cells subjected to oxygenation culture via a CVM are useful for the screening of chemicals and their metabolites that are subjected to biliary excretion and the prediction of their risks to cause cholestasis because various drugs that cause cholestasis are substrates for canalicular transporters (Padda et al., 2011). We hope that HepG2-NIAS cells registered as an RCB number of 4679 would contribute to the ADME/Tox assays in the drug development studies.
ACKNOWLEDGMENTS
This work was supported by the grants to T. Takezawa for the Agri-Health Translational Research Project (No. 6110) from the Ministry of Agriculture, Forestry and Fisheries of Japan (MAFF); for the Research on Development of New Drugs from Japan Agency for Medical Research and Development (AMED) (17ak0101073h1101, 18ak0101073j1002, 19ak0101073h1103, and 20ak0101073h1104). We thank Dr. A. Oshikata-Miyazaki for excellent technical assistance.
Conflict of interest
The authors declare that there is no conflict of interest.
REFERENCES
- Ananthanarayanan, M., Li, Y., Surapureddi, S., Balasubramaniyan, N., Ahn, J., Goldstein, J.A. and Suchy, F.J. (2011): Histone H3K4 trimethylation by MLL3 as part of ASCOM complex is critical for NR activation of bile acid transporter genes and is downregulated in cholestasis. Am. J. Physiol. Gastrointest. Liver Physiol., 300, G771-G781.
- Broutier, L., Mastrogiovanni, G., Verstegen, M.M., Francies, H.E., Gavarró, L.M., Bradshaw, C.R., Allen, G.E., Arnes-Benito, R., Sidorova, O., Gaspersz, M.P., Georgakopoulos, N., Koo, B.K., Dietmann, S., Davies, S.E., Praseedom, R.K., Lieshout, R., IJzermans, J., Wigmore, S.J., Saeb-Parsy, K., Garnett, M.J., van der Laan, L.J. and Huch, M. (2017): Human Primary Liver Cancer-derived Organoid Cultures for disease modeling and drug screening. Nat. Med., 23, 1424-1435.
- Brown, M.A., Wallace, C.S., Anamelechi, C.C., Clermont, E., Reichert, W.M. and Truskey, G.A. (2007): The use of mild trypsinization conditions in the detachment of endothelial cells to promote subsequent endothelialization on synthetic surfaces. Biomaterials, 28, 3928-3935.
- Deharde, D., Schneider, C., Hiller, T., Fischer, N., Kegel, V., Lübberstedt, M., Freyer, N., Hengstler, J.G., Andersson, T.B., Seehofer, D., Pratschke, J., Zeilinger, K. and Damm, G. (2016): Bile canaliculi formation and biliary transport in 3D sandwich-cultured hepatocytes in dependence of the extracellular matrix composition. Arch. Toxicol., 90, 2497-2511.
- Donner, M.G. and Keppler, D. (2001): Up-regulation of basolateral multidrug resistance protein 3 (Mrp3) in cholestatic rat liver. Hepatology, 34, 351-359.
- European Association for the Study of the Liver. (2019): EASL clinical practice guidelines: drug-induced liver injury. J. Hepatol., 70, 1222-1261.
- Gevaert, E., Dollé, L., Billiet, T., Dubruel, P., van Grunsven, L., van Apeldoorn, A. and Cornelissen, R. (2014): High throughput micro-well generation of hepatocyte micro-aggregates for tissue engineering. PLoS One, 9, e105171.
- Gradhand, U., Lang, T., Schaeffeler, E., Glaeser, H., Tegude, H., Klein, K., Fritz, P., Jedlitschky, G., Kroemer, H.K., Bachmakov, I., Anwald, B., Kerb, R., Zanger, U.M., Eichelbaum, M., Schwab, M. and Fromm, M.F. (2008): Variability in human hepatic MRP4 expression: influence of cholestasis and genotype. Pharmacogenomics J., 8, 42-52.
- Ide, I., Nagao, E., Kajiyama, S. and Mizoguchi, N. (2020): A novel evaluation method for determining drug-induced hepatotoxicity using 3D bio-printed human liver tissue. Toxicol. Mech. Methods, 30, 189-196.
- Kanebratt, K.P. and Andersson, T.B. (2008): HepaRG cells as an in vitro model for evaluation of cytochrome P450 induction in humans. Drug Metab. Dispos., 36, 137-145.
- Ko, J.-A., Liu, Y., Yanai, R., Chikama, T., Takezawa, T. and Nishida, T. (2008): Upregulation of tight-junctional proteins in corneal epithelial cells by corneal fibroblasts in collagen vitrigel cultures. Invest. Ophthalmol. Vis. Sci., 49, 113-119.
- Leite, S.B., Roosens, T., El Taghdouini, A., Mannaerts, I., Smout, A.J., Najimi, M., Sokal, E., Noor, F., Chesne, C., and Grunsven van, L.A. (2016): Novel human hepatic organoid model enables testing of drug-induced liver fibrosis in vitro. Biomaterials, 78, 1-10.
- López-Terrada, D., Cheung, S.W., Finegold, M.J. and Knowles, B.B. (2009): HepG2 is a hepatoblastoma- derived cell line. Hum. Pathol., 4, 1512-1515.
- Meunier, L. and Larrey, D. (2019): Drug-induced liver injury: Biomarkers, requirements, candidates, and validation. Front. Pharmacol., 10, 1482.
- Moghe, P.V., Berthiaume, F., Ezzell, R.M., Toner, M., Tompkins, R.G. and Yarmush, M.L. (1996): Culture matrix configuration and composition in the maintenance of hepatocyte polarity and function. Biomaterials, 17, 373-385.
- Mueller, D., Krämer, L., Hoffmann, E., Klein, S. and Noor, F. (2014): 3D organotypic HepaRG cultures as in vitro model for acute and repeated dose toxicity studies. Toxicol. In Vitro, 28, 104-112.
- Nakai, S., Shibata, I., Shitamichi, T., Yamaguchi, H., Takagi, N., Inoue, T., Nakagawa, T., Kiyokawa, J., Wakabayashi, S., Miyoshi, T., Higashi, E., Ishida, S., Shiraki, N. and Kume, S. (2019): Collagen vitrigel promotes hepatocytic differentiation of induced pluripotent stem cells into functional hepatocyte-like cells. Biol. Open, 8, bio042192.
- Navarro, V.J. and Senior, J.R. (2006): Drug-related hepatotoxicity. N. Engl. J. Med., 354, 731-739.
- Onakpoya, I.J., Heneghan, C.J. and Aronson, J.K. (2016): Post-marketing withdrawal of 462 medicinal products because of adverse drug reactions: a systematic review of the world literature. BMC Med., 14, 10.
- Oshikata-Miyazaki, A. and Takezawa, T. (2016): Development of an oxygenation culture method for activating the liver-specific functions of HepG2 cells utilizing a collagen vitrigel membrane chamber. Cytotechnology, 68, 1801-1811.
- Padda, M.S., Sanchez, M., Akhtar, A.J. and Boyer, J.L. (2011): Drug-induced cholestasis. Hepatology, 53, 1377-1387.
- Ranucci, C.S. and Moghe, P.V. (1999): Polymer substrate topography actively regulates the multicellular organization and liver-specific functions of cultured hepatocytes. Tissue Eng., 5, 407-420.
- Sa-ngiamsuntorn, K., Wongkajornsilp, A., Kasetsinsombat, K., Duangsa-ard, S., Nuntakarn, L., Borwornpinyo, S., Akarasereenont, P., Limsrichamrern, S. and Hongeng, S. (2011): Upregulation of CYP 450s expression of immortalized hepatocyte-like cells derived from mesenchymal stem cells by enzyme inducers. BMC Biotechnol., 11, 89.
- Sekine, S., Ito, K. and Horie, T. (2008): Canalicular Mrp2 localization is reversibly regulated by the intracellular redox status. Am. J. Physiol. Gastrointest. Liver Physiol., 295, G1035-G1041.
- Seng, S.N., Saeb-Parsy, K., Blackford, S.J., Segal, J.M., Serra, M.P., Horcas-Lopez, M., No, D.Y., Mastoridis, S., Jassem, W., Frank, C.W., Cho, N.J., Nakauchi, H., Glenn, J.S. and Rashid, S.T. (2018): Human iPS derived progenitors bioengineered into liver organoids using an inverted colloidal crystal poly (ethylene glycol) scaffold. Biomaterials, 182, 299-311.
- Takezawa, T., Ozaki, K., Nitani, A., Takabayashi, C. and Shimo-Oka, T. (2004): Collagen vitrigel: a novel scaffold that can facilitate a three-dimensional culture for reconstructing organoids. Cell Transplant., 13, 463-473.
- Takezawa, T., Nitani, A., Shimo-Oka, T. and Takayama, Y. (2007a): A protein-permeable scaffold of a collagen vitrigel membrane useful for reconstructing crosstalk models between two different cell types. Cells Tissues Organs, 185, 237-241.
- Takezawa, T., Takeuchi, T., Nitani, A., Takayama, Y., Kino-oka, M., Taya, M. and Enosawa, S. (2007b): Collagen vitrigel membrane useful for paracrine assays in vitro and drug delivery systems in vivo. J. Biotechnol., 131, 76-83.
- Takezawa, T., Aoki, S., Oshikata, A., Okamoto, C., Yamaguchi, H., Narisawa, Y. and Toda, S. (2012) A novel material of high density collagen fibrils: A collagen xerogel membrane and its application to transplantation in vivo and a culture chamber in vitro, in International Proceedings Division, ed. 24th European Conference on Biomaterials; 2011 September 4-8; Dublin, Ireland. pp. 181-185, Medimond, International Proceedings, Bologna, Italy.
- Uchino, T., Takezawa, T. and Ikarashi, Y. (2009): Reconstruction of three-dimensional human skin model composed of dendritic cells, keratinocytes and fibroblasts utilizing a handy scaffold of collagen vitrigel membrane. Toxicol. In Vitro, 23, 333-337.
- Underhill, G.H. and Khetani, S.R. (2018): Bioengineered liver models for drug testing and cell differentiation studies. Cell. Mol. Gastroenterol. Hepatol., 5, 426-439.
- Uzu, M. and Takezawa, T. (2020): Novel microvascular endothelial model utilizing a collagen vitrigel membrane and its advantages for predicting histamine-induced microvascular hyperpermeability. J. Pharmacol. Toxicol. Methods, 106, 106916.
- van Wenum, M., Adam, A.A., van der Mark, V.A., Chang, J.C., Wildenberg, M.E., Hendriks, E.J., Jongejan, A., Moerland, P.D., van Gulik, T.M., Oude Elferink, R.P., Chamuleau, R.A. and Hoekstra, R. (2018): Oxygen drives hepatocyte differentiation and phenotype stability in liver cell lines. J. Cell Commun. Signal., 12, 575-588.
- Watari, R., Kakiki, M., Oshikata, A., Takezawa, T., Yamasaki, C., Ishida, Y., Tateno, C., Kuroda, Y., Ishida, S. and Kusano, K. (2018): A long-term culture system based on a collagen vitrigel membrane chamber that supports liver-specific functions of hepatocytes isolated from mice with humanized livers. J. Toxicol. Sci., 43, 521-529.
- Xu, J., Oda, S. and Yokoi, T. (2018): Cell-based assay using glutathione-depleted HepaRG and HepG2 human liver cells for predicting drug-induced liver injury. Toxicol. In Vitro, 48, 286-301.
- Yang, K., Guo, C., Woodhead, J.L., St Claire, R.L., Watkins, P.B., Siler, S.Q., Howell, B.A. and Brouwer, K.L. (2016): Sandwich-Cultured Hepatocytes as a Tool to Study Drug Disposition and Drug-Induced Liver Injury. J. Pharmacol. Toxicol. Methods, 105, 443-459.
- Yamaguchi, H., Kojima, H. and Takezawa, T. (2013): Vitrigel-eye irritancy test method using HCE-T cells. Toxicol. Sci., 135, 347-355.
- Yamaguchi, H., Kojima, H. and Takezawa, T. (2016): Predictive performance of the Vitrigel-eye irritancy test method using 118 chemicals. J. Appl. Toxicol., 36, 1025-1037.
- Zamek-Gliszczynski, M.J., Xiong, H., Patel, N.J., Turncliff, R.Z., Pollack, G.M. and Brouwer, K.L. (2003): Pharmacokinetics of 5 (and 6)-carboxy-2′,7′-dichlorofluorescein and its diacetate promoiety in the liver. J. Pharmacol. Exp. Ther., 304, 801-809.
