Abstract
Microsampling (MS) has been increasingly used in toxicity studies reducing animal use for toxicokinetic analysis. However, especially for drugs with hematotoxic properties, the potential effects of MS on hematological parameters and subsequent toxicity assessment should be considered, while such properties are frequently unknown at the discovery stage. Here, we conducted a rat 2-week study of hematotoxic compounds and evaluated the effects of MS on toxicity assessment. Six-week-old female SD rats were orally dosed with vehicle, methylene blue trihydrate (MB: 300 mg/kg/day), or azathioprine (AZP: 12 and 24 mg/kg/day) for 2 weeks. Each treatment group was divided into non-MS and MS subgroups, and in the MS subgroups, 50 μL/time point of blood was collected from the jugular vein at 7 time points each on Days 1 and 13 of dosing. The test items included clinical signs, body weight, urinalysis, hematology, blood chemistry, necropsy, organ weight, and histopathology. In the MB non-MS subgroup, there were low values in red blood cell parameters, high values in reticulocytes and bilirubin, and increased extramedullary hematopoiesis, reflecting hemolytic anemia. In the AZP non-MS subgroup, there were low values of red and white blood cell parameters and decreased cellularity in the bone marrow, reflecting myelosuppression. The effects of MB and AZP were similarly observed in the MS subgroups, and the effects of MS on the toxicological endpoints were generally small. Based on these results, the effects of MS on toxicity assessment were considered to be small in rat toxicity studies even for hematotoxic compounds.
INTRODUCTION
In non-clinical safety studies of drugs in animals, toxicokinetic (TK) analysis is routinely performed to evaluate the relationship between toxicological profiles and systematic exposure to test articles. In rodents, due to their small size and blood volume, TK analysis has been traditionally performed using satellite animals to avoid the effects of blood sampling on toxicological endpoints in main study animals. However, this practice leads to additional use of animals and larger amounts of test articles, and makes it difficult to directly evaluate the relationship between toxicological profiles and drug exposure in the same animals.
Recently, improved sensitivity in bioanalytical methodology has enabled TK analysis using small volume blood samples taken by microsampling (MS), which is defined as the sampling of very small amounts of blood (typically ≤ 50 μL per time point) (ICH, 2017). To date, several studies have been conducted to verify the application of MS to rat toxicity studies for conducting toxicity assessment and TK analysis in the same animals (Powles-Glover et al., 2014; Caron et al., 2015; Hattori et al., 2020; Yokoyama et al., 2020). These studies showed no or minimal effects of MS on toxicological endpoints in non-treated or vehicle-treated healthy rats in a setting of 2- or 4-week general toxicity studies. However, while ICH S3A Q&A (ICH, 2017) says the properties of the test drug (e.g., effects on red blood cells, anticoagulant effect, or hemodynamic properties) should be considered when using MS in main study animals, these properties are frequently unknown at the discovery stage, and information is scarce on the effect of MS on toxicity assessment of drugs with such properties.
Here, we conducted a rat 2-week study of hematotoxic compounds and evaluated the effects of MS on toxicological endpoints including urinalysis, hematology, blood chemistry, organ weights, and histopathology. As the test articles, we used methylene blue trihydrate (MB) and azathioprine (AZP), which are known to cause hemolytic anemia and myelosuppression, respectively (Hejtmancik et al., 2002; Molyneux et al., 2008).
MATERIALS AND METHODS
Compounds
MB and AZP were purchased from Tokyo Chemical Industry Co., Ltd. (Tokyo, Japan) and Hayashi Pure Chemical Ind., Ltd. (Osaka, Japan), respectively.
Animals and husbandry
Animal usage was approved by the Institutional Animal Care and Use Committee of Drug Research Division of Sumitomo Pharma Co., Ltd.
Female Sprague-Dawley (Crl:CD) rats aged 5 weeks were purchased from Charles River Laboratories Japan, Inc. (Kanagawa, Japan) and were subjected to quarantine and acclimation periods of 1 week. Females were chosen because their blood volume is smaller and the effects of MS were expected to be larger than in males. The animals were housed individually in a barrier-sustained room with controlled temperature of 20–26°C, relative humidity of 40–70%, and a 12-hr light/dark cycle. The rats were fed a commercial pellet diet (CRF-1, Oriental Yeast Co., Ltd., Tokyo, Japan) and tap water ad libitum, except that during the urine collection the animals were fasted and fed bottled water ad libitum.
Animal experiments
At 6 weeks of age, the rats were randomly assigned to vehicle (0.5% methyl cellulose aqueous solution: 0.5% MC) and test article groups, which were further divided into non-microsampling (non-MS) and microsampling (MS) subgroups, as shown in Table 1. The dose levels of MB and AZP were chosen based on data from previous reports (Hejtmancik et al., 2002; NTP, 2008) and the TG-GATES database (http://toxico.nibiohn.go.jp/english/), which showed hematotoxicity of MB and AZP in rats, respectively. As for AZP, the low dose level (12 mg/kg) was set to examine whether weak toxicities could be detected even when MS was conducted.
Table 1. Group composition.
| Test article |
Dose level
(mg/kg) |
Number of animals |
Non-microsampling
(non-MS) |
Microsampling
(MS) |
| 0.5% MC (vehicle) |
0 |
5 |
5 |
| MB |
300 |
5 |
5 |
| AZP |
12 |
5 |
5 |
| AZP |
24 |
5 |
5 |
MC: methyl cellulose aqueous solution; MB: methylene blue trihydrate; AZP: azathioprine
The animals were dosed with a compound or vehicle by oral gavage once daily in the morning for 2 weeks. The dosing volume was 5 mL/kg. In the MS subgroups, 50 μL/time point of blood was collected from the jugular vein without anesthesia at 7 time points (0.5, 1, 2, 4, 6, 8, and 24 hr after dosing) each on Days 1 and 13 of dosing, using 1-mL low-dose syringes with 30G needles (Becton Dickinson Co., Franklin Lakes, NJ, USA) coated with heparin sodium MOCHIDA (Mochida Pharmaceutical Co., Ltd., Tokyo, Japan). On Day 15 of dosing (the day after the final dosing), blood was sampled from the abdominal aorta under isoflurane anesthesia for hematology and blood chemistry, and the rats were euthanized by exsanguination and were necropsied.
Examinations
Clinical observation, body weight, food and water consumption
During the dosing period, clinical signs were observed daily before and within 2 hr after dosing. Body weight and food and water consumption were measured once a week or more.
Urinalysis, hematology, and blood chemistry
Urine was collected after dosing on Day 14 of dosing for 15–20 hr. The volume was visually measured using a graduated cylinder or a measuring pipette, and sodium, potassium (K), chloride, albumin (ALB), lactate dehydrogenase (LDH), alkaline phosphatase (ALP), creatinine (CREAT), N-acetyl-beta-D-glucosaminidase (NAG) were measured using an automated analyzer JCA-ZS050 (JEOL Ltd., Tokyo, Japan).
The blood collected at necropsy was anticoagulated with EDTA-2K, and red blood cells (RBC), hemoglobin (HGB), hematocrit (HCT), mean corpuscular volume (MCV), mean corpuscular hemoglobin (MCH), mean corpuscular hemoglobin concentration (MCHC), reticulocyte (RETI), platelet (PLAT), white blood cell (WBC), and differential WBC (basophil: BASO; lymphocyte: LYM; eosinophil: EOS; neutrophil: NEUT; monocyte: MONO) were measured using an automated blood cell analyzer XT-2000i (Sysmex Corporation, Hyogo, Japan). Also, a part of the blood was anticoagulated with 3.2% sodium citrate solution and centrifuged, and the plasma was used to measure prothrombin time (PT), activated partial thromboplastin time (APTT), and fibrinogen (FIBRINO) using an automated blood coagulation analyzer CS-2400 (Sysmex Corporation).
For blood chemistry, the blood collected at necropsy was anticoagulated with heparin lithium and centrifuged, and the plasma was used to measure aspartate aminotransferase (AST), alanine transaminase (ALT), ALP, LDH, total bilirubin (BILI), γ-glutamyl transpeptidase (GGT), creatine kinase (CK), total cholesterol (CHOL), phospholipid (PHOSLPD), triglycerides (TRIG), glucose (GLUC), blood urea nitrogen (UREAN), CREAT, phosphorus (PHOS), calcium (CA), sodium, K, chloride, total protein (PROT), ALB, and albumin/globulin (ALBGLOB) using a JCA-ZS050 analyzer.
As for the MB group, interference of MB on values of sodium and CREAT in urinalysis, and on values of ALB, ALT, GGT, CK, CREAT, and CA in blood chemistry were observed or suspected. Therefore, these values in the MB group were excluded from the evaluation. Also, in 1 animal in the AZP 24 mg/kg non-MS subgroup, clotting was observed in the blood sample and thus the hematology could not be conducted.
Organ weight measurement and histopathology
At necropsy, the lung, salivary glands, liver, heart, kidneys, ovaries, uterus, spleen, thymus, and adrenal glands were weighed. The organ weight relative to the body weight (relative weight) was calculated using the body weight recorded on the day of necropsy.
After the organ weight measurement, the lung, liver, heart, kidneys, ovaries, uterus, vagina, femoral and sternal bone marrow, submandibular and mesenteric lymph nodes, spleen, thymus, adrenal glands, femur, and sternum were fixed in 10% neutral-buffered formalin, embedded in paraffin, sectioned, stained with hematoxylin and eosin (HE), and examined by light microscopy. The femur and sternum including bone marrow were decalcified in formic acid before the paraffin embedding.
Statistical analysis
The data were collected and exported to SEND (Standard for Exchange of Non-clinical Data) datasets using MiTOX (Mitsui E&S Systems Research Inc., Chiba, Japan), and visualized using TIBCO Spotfire® (TIBCO Software Inc., Palo Alto, CA, USA).
Group means and standard deviations of the values in body weight, urinalysis, hematology, blood chemistry, and organ weights were calculated, and each value was statistically analyzed as follows using SAS versions 9.4 software (SAS Institute Inc., Cary, NC, USA). Between the vehicle and MB groups in each non-MS and MS subgroup, homogeneity of variance was first tested by the F test (significance level of 25%). When the variance was homogeneous, the Student t-test was applied, and when the variance was not homogeneous, the Welch t-test was applied. For the AZP groups in each non-MS and MS subgroup, the group mean difference from the vehicle group was tested using the Dunnett test. Between the non-MS and MS subgroups in each treatment group, homogeneity of variance and group mean difference were tested using the F test and the Student/ Welch t-tests as described above. Unless otherwise specified, the two-tailed test was performed with significance level of 5%.
RESULTS
Mortality and clinical signs
No test article or MS-related death or clinical sign was observed. One animal in the AZP 24 mg/kg MS subgroup died on Day 14 of dosing; however, the death was judged to be due to a gavage error, since severe lung inflammation was observed only in this animal in the subgroup. Similar lung inflammation that suggested a gavage error was also observed in one animal in the AZP 24 mg/kg non-MS subgroup. Therefore, these 2 animals were excluded from the evaluation.
Body weight, food and water consumption, and urinalysis
In the non-MS subgroups, the body weight tended to be lower in the MB and AZP 12 and 24 mg/kg groups than in the vehicle group, though the difference was not significant (Fig. 1). In the MS subgroups, the body weight was significantly lower in the MB and AZP 24 mg/kg groups than in the vehicle group. Also, the body weight was kept lower in the MS subgroups than in the non-MS subgroups of all groups after MS on Day 1 of dosing; however, the difference was small (generally less than 5%) and not significant.
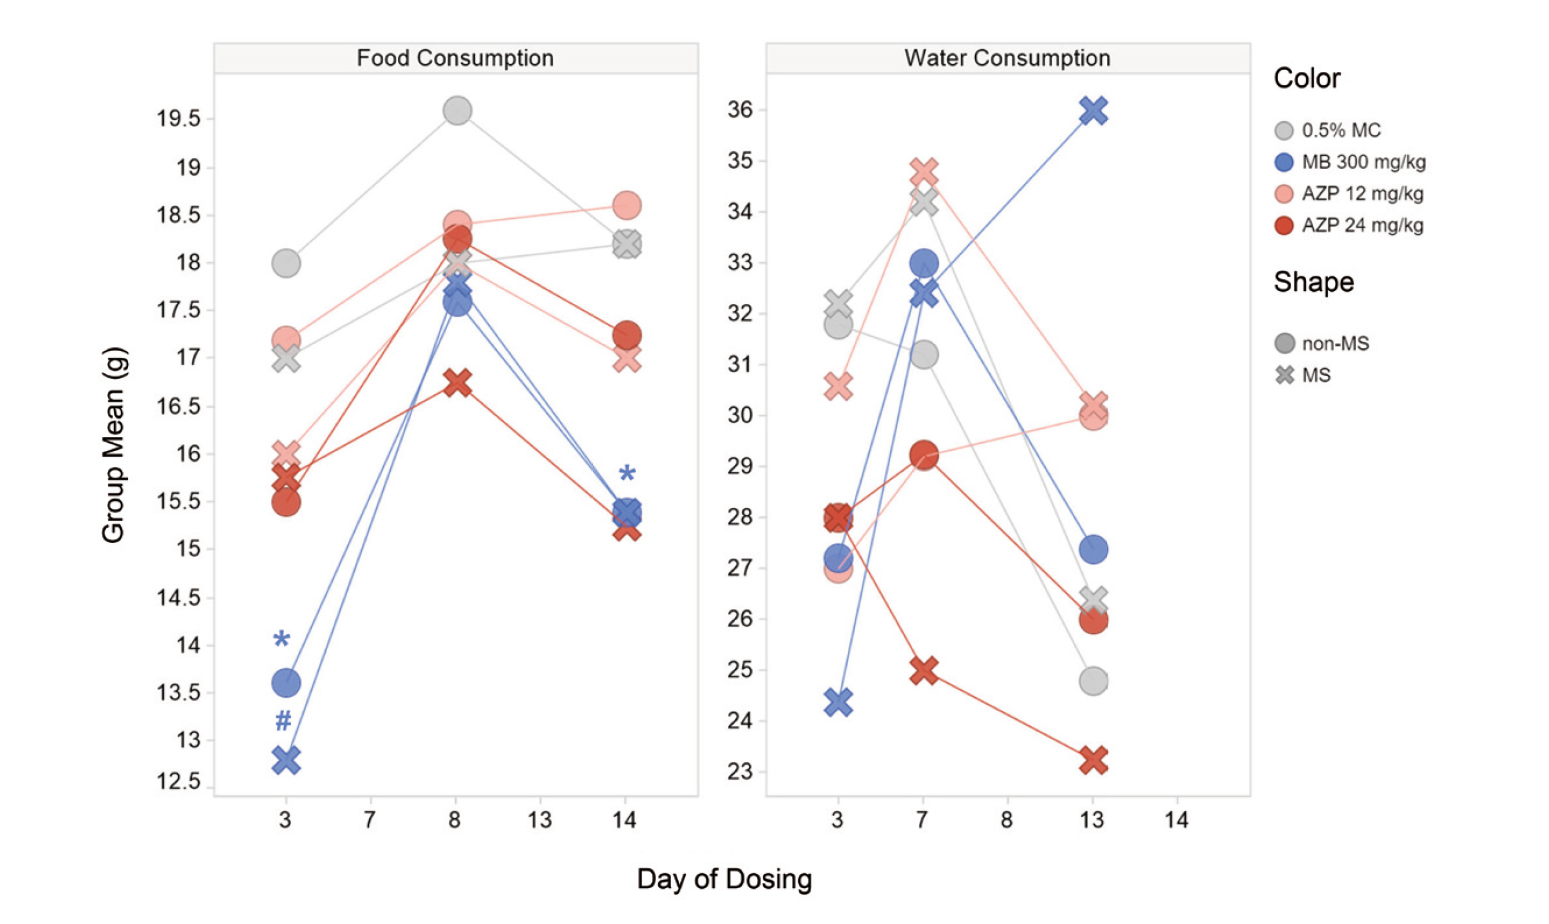
Food consumption was significantly lower in the MB group than in the vehicle group, both in the non-MS and MS subgroups (Fig. 2). Food consumption tended to be lower in the MS subgroups than in the non-MS subgroups of the AZP 24 mg/kg group; however, there was a relatively wide interindividual variance and the difference was not significant. There were no significant or consistent changes related to the test articles or MS in the water consumption.
In urinalysis, chloride excretion both in the non-MS and MS subgroups was significantly higher in the MB group than in the vehicle group. Though CREAT excretion was significantly higher only in the MS subgroups of the AZP 12 and 24 mg/kg groups than in the vehicle group, the individual values were within the range of values in the vehicle non-MS subgroup, and this difference was considered to be incidental. There was no significant difference in any parameter between the non-MS and MS subgroups.
Hematology
In the non-MS subgroups, values of EOS, HCT, HGB, MCHC, and RBC were significantly lower, and values of MCV and RETI were significantly higher in the MB group than in the vehicle group (Fig. 3 and Supplemental Table 1). Also, values of HCT, HGB, and WBC in the AZP 12 and 24 mg/kg groups, and values of LYM, MCHC, and RBC in the AZP 24 mg/kg group were significantly lower than those in the vehicle group.

In the MS subgroups, these differences from values in the vehicle group were not significant in some parameters such as HCT in the MB group and HCT, HGB, and RBC in the AZP groups, partly due to slightly lower values of HCT, HGB, and RBC in the vehicle MS subgroup than in the vehicle non-MS subgroup. In addition, significant differences from values in the vehicle group were observed only in the MS-subgroups in some parameters such as NEUT and PLAT, which were low and high respectively in the MB group, and EOS and MONO, which were low in the AZP 24 mg/kg group. However, the tendency was similar and the differences were small and not significant between the non-MS and MS subgroups.
Other than the above, significant differences from values in the non-MS subgroups were observed including a low value of APTT in the vehicle MS subgroup and a high value of PLAT in the MB MS subgroup; however, the individual values were within the range of historical data or values in the vehicle non-MS subgroup, and these differences were considered to be incidental.
Blood chemistry
In the non-MS subgroups, values of BILI and UREN were significantly higher in the MB group than in the vehicle group (Fig. 4 and Supplemental Table 2). Though the value of CHOL was also high in the MB group, the range of individual values was almost the same as in the vehicle group, and this difference was considered to be incidental. No significant changes related to AZP were observed.

High values of BILI and UREN in the MB group were also observed in the MS subgroup. Other than the above, a significant difference from the vehicle group was observed only in the MS subgroups in some parameters such as K, which was high in the MB group, and CA, CHOL, PHOSLPD, and PROT, which were high in the AZP 24 mg/kg group. In addition, there were significant differences from the values in the non-MS subgroups such as a low value of ALBGLOB in the AZP 12 mg/kg MS subgroup and high values of CHOL, PHOSLPD, and sodium in the AZP 24 mg/kg MS subgroup. However, the individual values were within the range of values in the vehicle non-MS subgroup or the tendency was similar and the differences were small between the non-MS and MS subgroups, and thus these differences were considered to be incidental or not biologically significant.
Necropsy and organ weights
At necropsy, large spleen and skin discoloration in the MB group, and small thymus in the AZP 12 and 24 mg/kg groups were observed both in the non-MS and MS subgroups.
Regarding the organ weights in the non-MS subgroups, the absolute and relative weights of the adrenal gland were significantly lower, and the absolute and relative weights of the spleen and the relative weight of the liver were significantly higher in the MB group than in the vehicle group (Fig. 5 and Supplemental Table 3). The absolute and relative weights of the thymus were significantly lower in the AZP 12 and 24 mg/kg groups, and the absolute and relative weights of the liver and lung were significantly higher in the AZP 24 mg/kg group than in the vehicle group. Though the relative weight of the lung was high in the MB group, and the relative weights of the heart and kidney were high in the AZP 24 mg/kg group compared to the vehicle group, these were considered to be secondary to low body weight since there were no obvious changes in the absolute weights.

In the MS subgroups, the absolute and relative weights of the spleen were also significantly higher in the MB group than in the vehicle group. On the other hand, the only significant AZP-related change in the thymus was in absolute weight in the 12 mg/kg group, and the MB-related change in the liver and the AZP-related change in the lung were not significant; however, the tendency was similar and the differences were small between the non-MS and MS subgroups.
Other than the above, no effect of MB on the adrenal gland was observed in the MS subgroup. Also, the change related to AZP 24 mg/kg in the absolute liver weight was not significant in the MS subgroup, and the absolute liver weight in the AZP 24 mg/kg group was significantly lower in the MS subgroup than in the non-MS subgroup. These may be related to the lower body weight in the MS subgroups than in the non-MS subgroups. The absolute weights of the salivary gland and spleen were significantly lower in the AZP 24 mg/kg group than in the vehicle group only in the MS subgroup; however, the individual values were almost within the range of values in the vehicle non-MS subgroup and these differences were judged to be incidental.
Histopathology
As test article-related findings in the non-MS subgroups, degeneration/necrosis of cardiomyocytes, fibrosis and inflammation in the heart, and extramedullary hematopoiesis, congestion, and pigment in the liver and/or spleen were observed in the MB group (Fig. 6). Decreased cellularity in the bone marrow and thymus was observed in the AZP 12 and/or 24 mg/kg groups.
There were no MS-related findings in the vehicle group, while the above test article findings were also observed in the MS subgroups. In the AZP groups, the degree and incidence of the findings tended to be higher in the MS subgroups than in the non-MS subgroups, and degeneration and necrosis of cardiomyocytes and inflammation in the heart were observed only in the MS subgroups. The findings in the heart were similar to those observed in the MB group, and may have been due to anemia, since they were observed in animals with especially low red blood cell parameters.
DISCUSSION
In this study, we evaluated the effects of MS on toxicity assessment in a rat 2-week toxicity study of the hematotoxic compounds MB and AZP.
Does MS affect toxicological endpoints in normal animals?
Overall, the effects of MS on toxicological endpoints were small in the vehicle group, consistent with previous reports (Powles-Glover et al., 2014; Caron et al., 2015; Hattori et al., 2020; Yokoyama et al., 2020). Though body weight tended to be lower in the MS subgroups than in the non-MS subgroups, the difference was small (less than about 3%) and not significant.
Can the toxicity of hematotoxic compounds be detected with MS?
Consistent with the previous reports using rats (Hejtmancik et al., 2002; NTP, 2008; the TG-GATES database), MB and AZP showed hematotoxicity. In the MB non-MS subgroup, changes reflecting hemolytic anemia were observed including low values in red blood cell parameters, high values in RETI, BILI, and spleen weight, and increased extramedullary hematopoiesis and pigmentation in the spleen and/or liver. Similar changes were also observed in the MB MS subgroup. In addition, in the AZP group, changes reflecting myelosuppression were observed including low values of red and white blood cell parameters and decreased cellularity in the bone marrow and thymus, regardless of MS. Though the effects of AZP were generally weaker at 12 mg/kg than at 24 mg/kg as expected, the effects were similarly observed in the MS subgroup as in the non-MS subgroup. Thus, the hematotoxicity of the test articles could be detected even with MS.
Can MS lead to overestimation of the toxicity of hematotoxic compounds?
As described above, the body weight tended to be lower in the MS subgroups than in the non-MS subgroups in the vehicle group, and a similar tendency was also observed in the test article groups; however, the difference was small (generally less than 5%) and not significant. In the AZP groups, there were significant differences in some parameters between the non-MS and MS subgroups such as high values in CHOL and PHOSLPD in the AZP 24 mg/kg group, and some findings were slightly more severe in the MS subgroup such as decreased cellularity in the bone marrow and thymus; however, the tendency was similar and the differences were small between the non-MS and MS subgroups. In addition, in the MB group, there were no significant or notable differences between the non-MS and MS subgroups. Thus, though the possible effects of MS should be kept in mind, it is unlikely that MS leads to overestimation of toxicity.
In conclusion, as described, the effects of MS on toxicological endpoints were small if any, and the toxicity of hematotoxic compounds could be assessed even with MS in the setting of a 2-week toxicity study in rats. Thus, the present study further verifies the application of MS to reduce animal use in toxicity studies.
ACKNOWLEDGMENTS
We wish to thank Yumi Tateishi for her histotechnical work, and members of CNUV (The Community for Non-clinical Data Utilization and Visualization: https://www.croit.com/cnuv/) for creation and improvement of the Spotfire template to visualize SEND datasets.
Conflict of interest
The authors declare that there is no conflict of interest.
REFERENCES
- Caron, A., Lelong, C., Bartels, T., Dorchies, O., Gury, T., Chalier, C. and Benning, V. (2015): Clinical and anatomic pathology effects of serial blood sampling in rat toxicology studies, using conventional or microsampling methods. Regul. Toxicol. Pharmacol., 72, 429-439.
- Hattori, N., Takumi, A., Saito, K. and Saito, Y. (2020): Effects of serial cervical or tail blood sampling on toxicity and toxicokinetic evaluation in rats. J. Toxicol. Sci., 45, 599-609.
- Hejtmancik, M.R., Ryan, M.J., Toft, J.D., Persing, R.L., Kurtz, P.J. and Chhabra, R.S. (2002): Hematological effects in F344 rats and B6C3F1 mice during the 13-week gavage toxicity study of methylene blue trihydrate. Toxicol. Sci., 65, 126-134.
- ICH. (2017): ICH S3A Q&A focus on microsampling. (https://www.ich.org/fileadmin/Public_Web_Site/ICH_Products/Guidelines/Safety/S3A/S3AIWG_Step4_2017_1116.pdf).
- Molyneux, G., Gibson, F.M., Chen, C.M., Marway, H.K., McKeag, S., Mifsud, C.V., Pilling, A.M., Whayman, M.J. and Turton, J.A. (2008): The haemotoxicity of azathioprine in repeat dose studies in the female CD-1 mouse. Int. J. Exp. Pathol., 89, 138-158.
- National Toxicology Program. (2008). Technical report on the toxicology and carcinogenesis studies of methylene blue trihydrate (CAS No. 7220-79-3) in F344/N rats and B6C3F1 mice (gavage studies). NTP TR 540, NIH Publication No. 08-4429, NIEHS, Research Triangle Park, NC.
- Powles-Glover, N., Kirk, S., Wilkinson, C., Robinson, S. and Stewart, J. (2014): Assessment of toxicological effects of blood microsampling in the vehicle dosed adult rat. Regul. Toxicol. Pharmacol., 68, 325-331.
- Yokoyama, H., Hattori, N., Ohtsuka, H., Murata, E., Kobayashi, A., Muta, K., Takumi, A., Kitaura, H., Jinno, F., Iwai, A., Nakai, K., Mori, K., Saito, K. and Saito, Y. (2020): Lack of toxicological influences by microsampling (50 µL) from jugular vein of rats in a collaborative 28-day study. J. Toxicol. Sci., 45, 319-325.