Abstract
Acute hyperglycemia causes various cardiovascular responses; however, the underlying pathophysiology in vivo is myriad and complex, of which mutual interactions remain poorly understood. We analyzed the cardiovascular effects of acute hyperglycemia in comparison with those of hyperosmolality alone. Three g/kg of D-glucose (n = 4) or D-mannitol (n = 4) was intravenously infused to isoflurane-anesthetized intact dogs. Glucose infusion increased plasma glucose level and osmolality, whereas mannitol infusion similarly changed osmolality to glucose infusion but decreased glucose level. Glucose infusion decreased total peripheral vascular resistance, but increased heart rate, left ventricular contraction, left ventricular preload and cardiac output without altering mean blood pressure. Mannitol infusion likewise changed them, but its positive chronotropic and inotropic effects were less potent than those of glucose infusion. Glucose infusion prolonged PR interval, QRS width and QTcV. Mannitol infusion similarly changed them, but its QTcV prolongation was smaller than that of glucose infusion. Glucose infusion-induced cardiovascular responses would be basically attributed to osmolality-dependent mechanisms, whereas its positive chronotropic and inotropic effects along with repolarization delay may be enhanced by osmolality-independent mechanisms, including hyperglycemia by itself and insulin release.
INTRODUCTION
Acute hyperglycemia causes various cardiohemodynamic and electrophysiological responses (Giugliano et al., 1997; Hyltén-Cavallius et al., 2017; Marfella et al., 2000; Nielsen et al., 2013), which might increase the cardiovascular risk in human subjects (Ceriello, 2008). Several mechanisms have been reported to explain such hyperglycemia-associated cardiovascular responses (Cipolla et al., 1997; Contreras-Ferrat et al., 2014; Ferrannini et al., 1988; Harvey and Grant, 2021; Hoffman et al., 1999; Hyltén-Cavallius et al., 2017; Montagnani et al., 2001; Scherrer et al., 1994; Tack et al., 1996). For example, hyperglycemia-induced extracellular hyperosmotic condition would pull water out of the cells, transiently shrinking the cardiomyocytes volume to elevate intracellular K+, Ca2+ and Na+ concentrations, which will modify the electrical activity along with the contractile function (Harvey and Grant, 2021). Meanwhile, high plasma glucose level by itself can activate the adrenergic tone in healthy human subjects (Hoffman et al., 1999), and may promote NO release from endothelial cells to induce vasodilation in the isolated cerebral arteries (Cipolla et al., 1997). Furthermore, hyperglycemia promotes insulin release, which could stimulate Na+/K+-ATPase in the endothelium, resulting in vasodilation via activation of forward mode Na+/Ca2+ exchanger (Ferrannini et al., 1988; Tack et al., 1996), can directly stimulate NO release from endothelial cells (Montagnani et al., 2001; Scherrer et al., 1994), and may enhance ICa,L in the cardiomyocytes (Contreras-Ferrat et al., 2014). However, underlying pathophysiology of acute hyperglycemia in vivo is myriad and complex, of which mutual interactions leading to cardiovascular phenotypes remain poorly understood.
In this study we tried to analyze such multifarious hyperglycemia-associated in vivo cardiovascular adverse reactions supposing that they could consist of two types of distinct pathophysiological processes: the hyperglycemia-associated, “osmolality-dependent” and “osmolality-independent” mechanisms. In order to begin to fill the gaps of our knowledge, namely, which mechanism of hyperglycemia may play more important roles than the other for expressing cardiovascular phenotype in vivo, we adopted the isoflurane-anesthetized intact canine model (Saito et al., 2021a, 2021b). The canine model has been known to be useful for estimating in vivo cardiovascular profile of pharmaceuticals in human subjects (Sugiyama, 2008), and could be expected to represent the complex pathophysiology of hyperglycemia in its entirety. Using this model, we initially assessed effects of mannitol infusion on the cardiohemodynamic, electrophysiological and serological variables to predict the hyperglycemia-associated, “osmolality-dependent” mechanisms, since mannitol moves passively from the vasculature into the interstitial tissue but does not move intracellularly (Lurie et al., 1999). Then, we examined those effects of glucose infusion using the same experimental protocol to indirectly estimate the hyperglycemia-associated, “osmolality-independent” mechanisms.
METHODS AND METHODS
Experiments were performed using female beagle dogs weighing approximately 10 kg (n = 8), which were obtained from Kitayama Labes Co., Ltd. (Nagano, Japan). Dogs were individually housed in stainless steel dog cages on a 12-hr light (6:00–18:00)–dark (18:00–6:00) cycle, and were given 200 g/day of standard pellet diet (CD-5M, CLEA Japan, Inc., Tokyo, Japan) and free access to tap water. The animal rooms were maintained at a temperature of 23 ± 2°C and a relative humidity of 50 ± 20%. All experiments were approved by the Toho University Animal Care and User Committee (approval number: 20-53-395) and performed according to the Guideline for the Care and Use of Laboratory Animals of Toho University and ARRIVE guidelines (Kilkenny et al., 2010; McGrath et al., 2010).
Surgical preparation
Dogs (n = 8) were initially anesthetized with thiopental sodium (30 mg/kg, i.v.). After intubation with a cuffed endotracheal tube, anesthesia was maintained by inhalation of isoflurane (1.5–2.5% v/v) vaporized in oxygen with a volume-limited ventilator (SN-480-3, Shinano Manufacturing Co., Ltd., Tokyo, Japan). Tidal volume and respiratory rate were set at 20 mL/kg and 15 breaths/min, respectively. Three clinically available catheter sheath sets (FAST-CATHTM, St. Jude Medical Daig Division, Inc., Minnetonka, MN, USA) were used for introducing the catheters; one was inserted in the right femoral artery toward aorta, and the other two were done in the right and left femoral veins toward inferior vena cava, respectively. Heparin calcium (100 IU/kg) was administered to prevent the blood clotting through the catheter sheath placed at the right femoral vein.
Measurement of cardiohemodynamic variables
A pig-tail catheter was placed at the left ventricle through the right femoral artery to measure the left ventricular pressure with the fluid-filled method, whereas the aortic pressure was measured at a space between the inside of the catheter sheath and outside of the pig-tail catheter through the flush line. The left ventricular pressure at a time point of peak of R wave on electrocardiogram was defined as the left ventricular end-diastolic pressure (Nagueh et al., 2001). The maximum upstroke velocity of the left ventricular pressure (LVdP/dtmax) and the left ventricular end-diastolic pressure were obtained during sinus rhythm to estimate the isovolumic systolic function and the preload to the left ventricle, respectively. A thermodilution catheter (132F5, Edwards Lifesciences, Irvine, CA, USA) was positioned at the right side of the heart through the right femoral vein. The cardiac output was measured by using a standard thermodilution method with a cardiac output computer (MFC-1100, Nihon Kohden Corporation, Tokyo, Japan). The total peripheral vascular resistance was calculated with the following basic equation: total peripheral vascular resistance = mean blood pressure/cardiac output. The myocardial oxygen consumption was estimated by a product of the systolic blood pressure and heart rate (double product) (Gobel et al., 1978; Nelson et al., 1974).
Measurement of electrophysiological variables
The lead II electrocardiogram was obtained from the limb electrodes. The PR interval, QRS width and QT interval were measured, and the QT interval was corrected with Van de Water’s formula: QTcV = QT − 0.087 × (RR − 1,000) with RR given in ms (Van de Water et al., 1989). A bidirectional steerable monophasic action potential (MAP) recording/pacing combination catheter (1675P, EP Technologies, Inc., Sunnyvale, CA, USA) was positioned at the endocardium of the interventricular septum in the right ventricle through the left femoral vein to obtain MAP signals and to electrically drive the right ventricle. The MAP signals were amplified with a DC preamplifier (model 300, EP Technologies, Inc.). The duration of the MAP signals was measured as an interval, along a horizontal line corresponding to the diastolic baseline, from the MAP upstroke to the desired repolarization level. The interval (ms) at 90% repolarization was defined as MAP90. The heart was electrically driven with a cardiac stimulator (SEC-3102, Nihon Kohden Corporation) via the electrodes of the combination catheter placed in the right ventricle. The stimulation pulses were rectangular in shape, 2–2.5 V (about twice the threshold voltage) and of 1-ms duration. The MAP90 of the ventricle was measured during sinus rhythm (MAP90(sinus)), and at pacing cycle lengths of 400 ms (MAP90(CL400)) and 300 ms (MAP90(CL300)).
Biochemical assay
The blood was sampled through the flush line of catheter sheath placed at the right femoral artery. The blood was dispensed into a tube containing nothing (plain tube) for measuring osmolality and insulin, into one containing the sodium fluoride for assaying glucose, into one containing calcium-heparin for determining electrolyte, and into one containing EDTA aprotinin for measuring glucagon. The tubes were centrifuged at 1,500 × g at 4°C for 20 min. The plasma was stored at –80°C until the biochemical assay. Sensitive and specific determinations of these biochemical variables were performed at FUJIFILM VET Systems Co., Ltd. (Tokyo, Japan).
Experimental protocol
The aortic pressure, left ventricular pressure, electrocardiogram and MAP signals were monitored with a polygraph system (RM-6000, Nihon Kohden Corporation) and analyzed by using a real-time fully automatic data analysis system (Win VAS 3 for Windows ver. 1.1R24v, Physio-Tech Co., Ltd., Tokyo, Japan). Three recordings of consecutive complexes were used to calculate the mean for the electrocardiographic indices and MAP duration. The electrophysiological variables were assessed in the following order. First, the aortic pressure, left ventricular pressure, electrocardiogram and MAP signals were recorded under sinus rhythm. Second, the cardiac output was measured 3 times. Finally, the MAP signals were recorded during the ventricular pacing at cycle lengths of 400 and 300 ms. Following the basal assessment, D-mannitol (20% g/v) in a dose of 3 g/15 mL/kg or D-glucose (50% g/v) in a dose of 3 g/6 mL/kg was intravenously infused over 30 min (n = 4 for each treatment). The cardiovascular variables were assessed at 10, 20, 30, 45 and 60 min after the start of administration, but the cardiac output or MAP90 during the ventricular pacing were not done at 30 min due to the difficulty for their measurement in a second. The blood was sampled for biochemical assay before, and 30 and 60 min after the start of the infusion.
Drugs
Purified D-glucose solution (50% g/v) (OTSUKA GLUCOSE INJECTION, Otsuka Pharmaceutical Factory, Tokyo, Japan) and D-mannitol solution (20% g/v) (20% Mannitol Injection, Yoshindo Inc., Toyama, Japan) were purchased. The other drugs used were thiopental sodium (Ravonal®, Mitsubishi-Tanabe Pharma Co., Osaka, Japan), isoflurane (Isoflurane inhalation solution [Pfizer], Mylan Seiyaku Ltd., Tokyo, Japan) and heparin calcium (Caprocin®, Sawai Pharmaceutical Co., Ltd., Osaka, Japan).
Statistical analysis
Data are presented as mean ± S.E. Differences within a parameter were evaluated with one-way, repeated-measures analysis of variance (ANOVA) or mixed-effects analysis. Fisher’s LSD test was employed as a post hoc-test for mean values comparison. Meanwhile, differences between the glucose-treated and mannitol-treated animals at pre-treatment basal control were assessed by unpaired t-test. Differences in each parameter between the animals treated with glucose and those treated with mannitol were analyzed by two-way, repeated-measures ANOVA followed by Bonferroni's multiple comparisons test as a post hoc-test. These statistical analyses were performed by using GraphPad prism 8 (ver. 8.43, GraphPad Software, LLC, La Jolla, CA, USA). A p value < 0.05 was considered to be significant.
RESULTS
No animals exerted any lethal ventricular arrhythmia or hemodynamic collapse leading to their death during the experimental period. Each animal survived after the experimental protocol, and no neurological deficit was observed at 1 week after the experiment. No significant difference was observed in any of the pre-treatment basal control values between the mannitol-treated and glucose-treated animals.
Effects on cardiohemodynamic variables
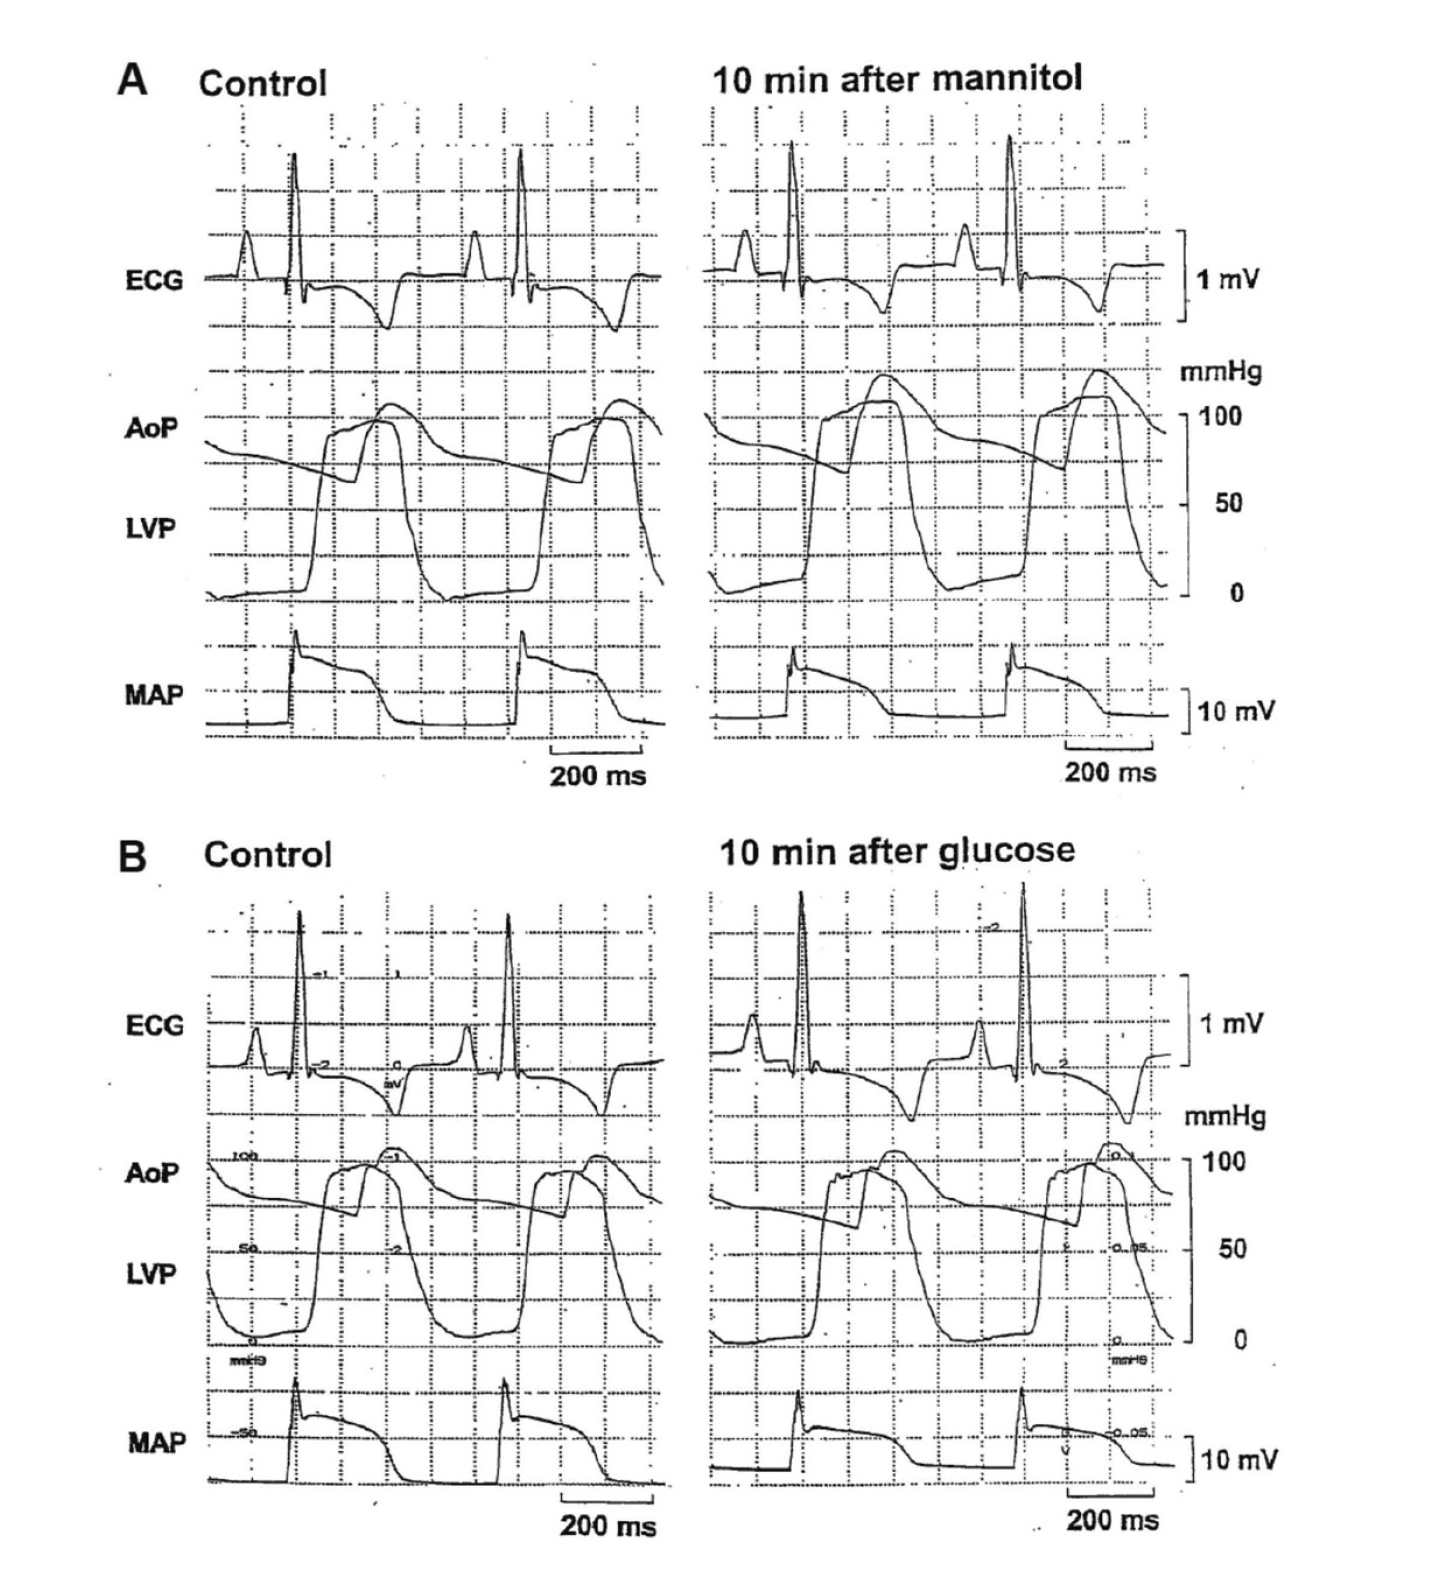
Typical tracings of the aortic pressure and left ventricular pressure are shown in Fig. 1, whereas the time courses of changes in the heart rate, mean blood pressure, double product, cardiac output, total peripheral vascular resistance, LVdP/dtmax and left ventricular end-diastolic pressure are summarized in Fig. 2. Their pre-treatment control values (C) in the mannitol-treated animals (n = 4) were 113 ± 2 beats/min, 83 ± 2 mmHg, 12,192 ± 501 mmHg·beats/min, 2.74 ± 0.15 L/min, 31 ± 2 mmHg·min/L, 1,915 ± 133 mmHg/s and 8 ± 1 mmHg, whereas those in the glucose-treated animals (n = 4) were 117 ± 4 beats/min, 86 ± 9 mmHg, 12,833 ± 848 mmHg·beats/min, 2.48 ± 0.13 L/min, 35 ± 5 mmHg·min/L, 2,067 ± 407 mmHg/s and 5 ± 1 mmHg, respectively.
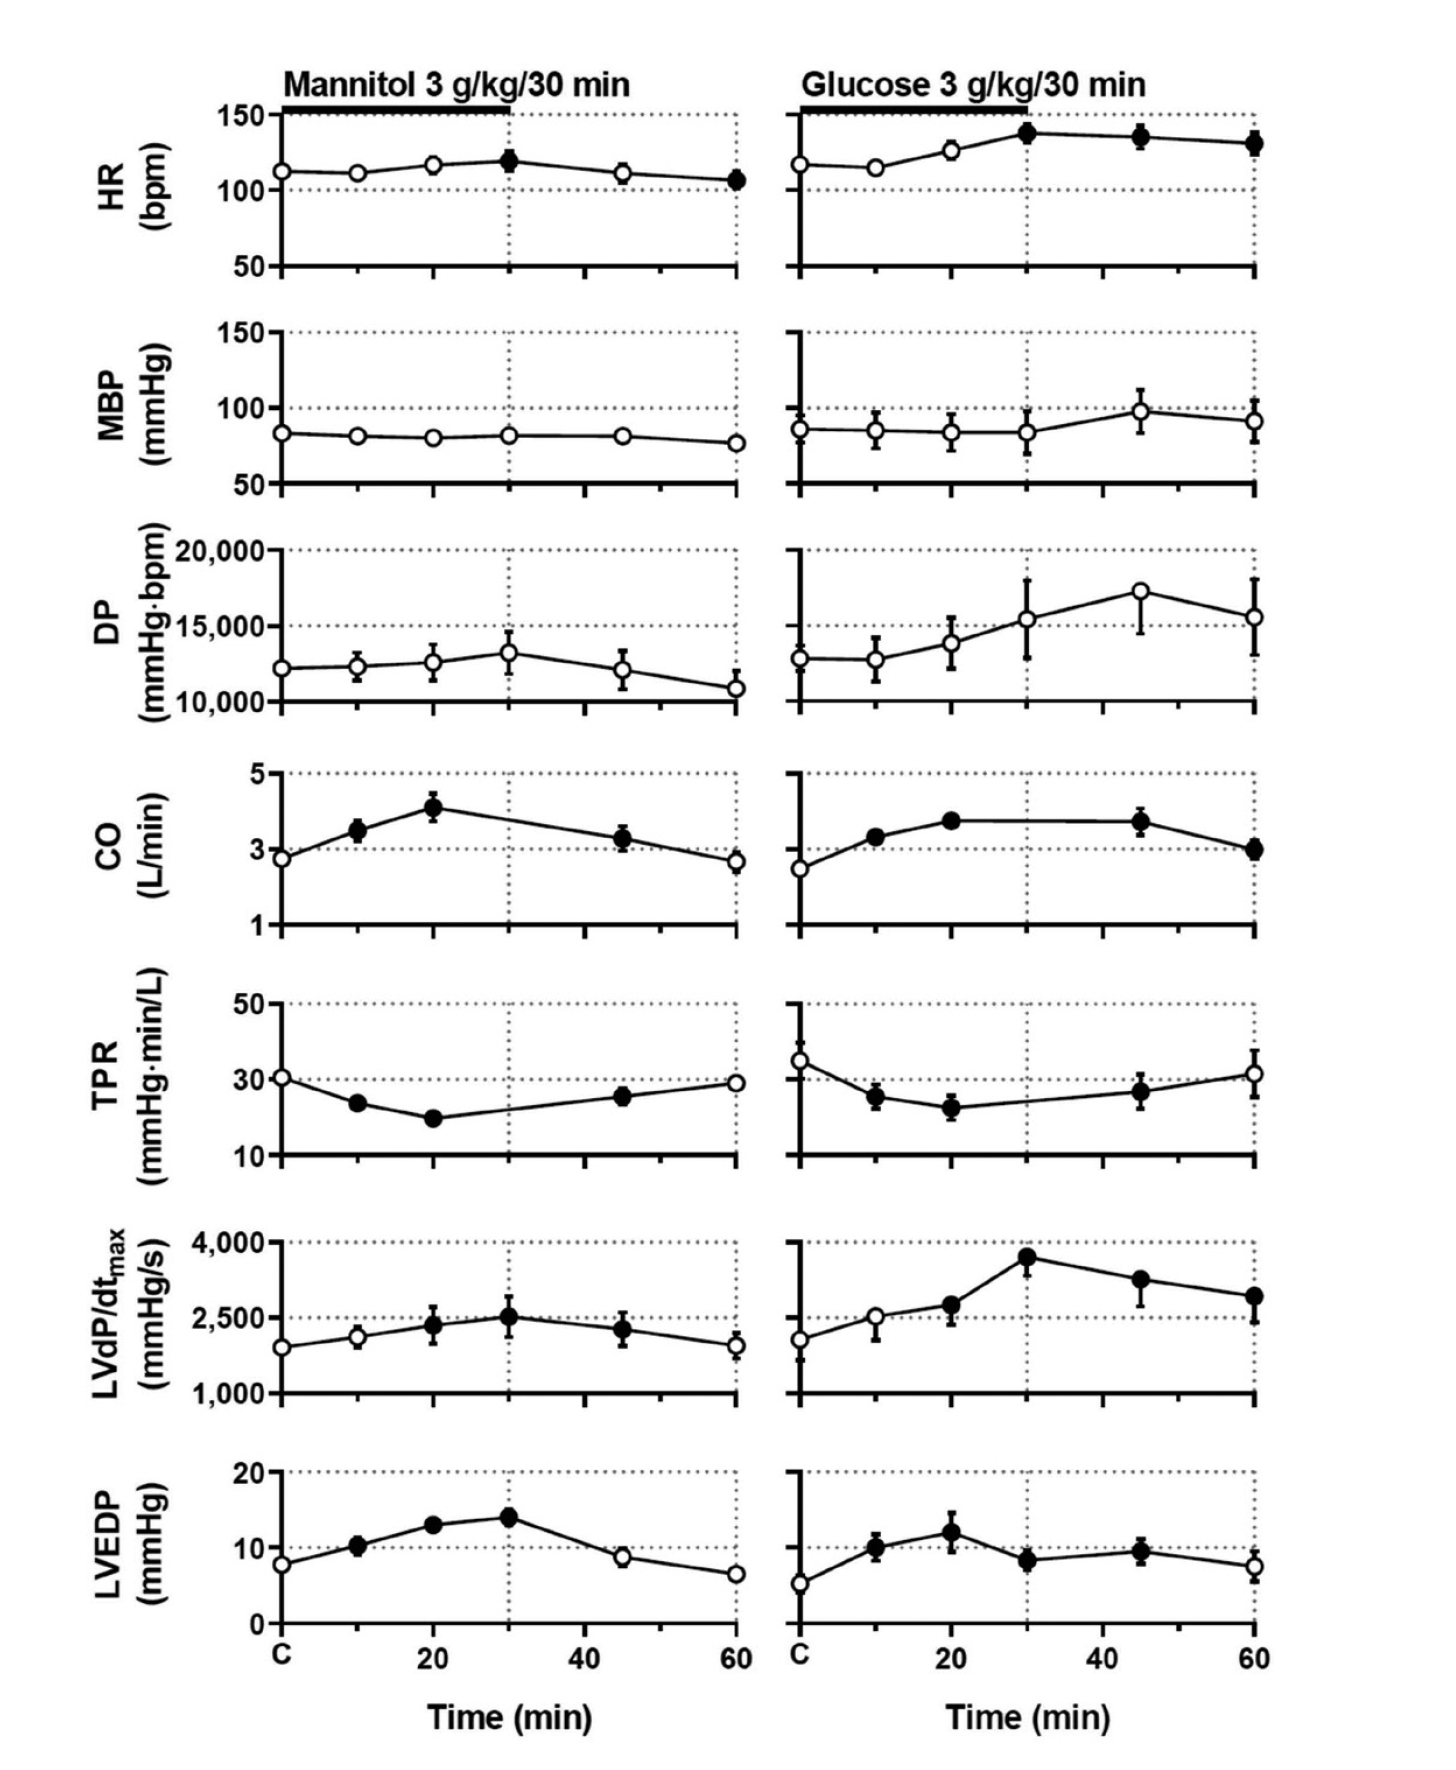
Mannitol infusion increased the heart rate at 30 min followed by the decrease at 60 min, the cardiac output for 10–45 min, the LVdP/dtmax for 20–45 min and the left ventricular end-diastolic pressure for 10–30 min, but decreased the total peripheral vascular resistance for 10–45 min after the start of infusion, whereas no significant change was detected in the mean blood pressure or double product. Meanwhile, glucose infusion increased the heart rate for 30–60 min, the cardiac output for 10–60 min, the LVdP/dtmax for 20–60 min and the left ventricular end-diastolic pressure for 10–45 min, but decreased the total peripheral vascular resistance for 10–45 min after the start of infusion, whereas no significant change was detected in the mean blood pressure or double product. The LVdP/dtmax or left ventricular end-diastolic pressure at 30 min after glucose infusion could not be measured in 1 animal due to technical errors. There was no significant difference in any of variables between the mannitol-treated animals and glucose-treated animals.
Effects on electrocardiographic and MAP variables
Typical tracings of the electrocardiogram and MAP are shown in Fig. 1, whereas the time courses of changes in the PR interval, QRS width, QT interval, QTcV, MAP90(sinus), MAP90(CL400), and MAP90(CL300) are summarized in Fig. 3. Their pre-treatment control values (C) in the mannitol-treated animals (n = 4) were 98 ± 1 ms, 56 ± 1 ms, 244 ± 11 ms, 285 ± 10, 222 ± 7 ms, 220 ± 4 ms and 207 ± 3 ms, whereas those in the glucose-treated animals (n = 4) were 98 ± 4 ms, 56 ± 0 ms, 275 ± 13 ms, 317 ± 13, 245 ± 12 ms, 242 ± 11 ms and 224 ± 8 ms, respectively.

Mannitol infusion prolonged the PR interval at 10 min, the QRS width for 10–30 min and the QTcV for 20–30 min, whereas no significant change was detected in the other variables. Meanwhile, glucose infusion prolonged the PR interval at 10 min followed by shortening at 60 min, the QRS width for 10–60 min, the QT interval and QTcV for 10–20 min, whereas no significant change was detected in the other variables. Moreover, glucose infusion more potently prolonged the QTcV, MAP90(CL400) and MAP90(CL300) than mannitol infusion at 10 min, whereas no significant difference was found in the other variables between the mannitol-treated animals and glucose-treated animals.
Effects on serological variables
The time courses of changes in the glucose level, insulin and glucagon concentrations, osmolality, and Na+, K+ and Cl− concentrations are summarized in Table 1. Mannitol infusion decreased the glucose level at 30 min, and the insulin, Na+ and Cl− concentrations for 30–60 min, but increased the osmolality for 30–60 min and the K+ concentration at 60 min, whereas no significant change was detected in the glucagon concentration. Meanwhile, glucose infusion increased the glucose level and osmolality for 30–60 min, but decreased the glucagon, Na+ and Cl− concentrations at 30 min. It tended to increase the insulin concentration, but decrease the K+ concentration at 30 min, which did not achieve statistical significance. The magnitude of peak increase in the osmolality was comparable between mannitol-treated animals (+ 37 ± 1 mOsm/kg∙H2O) and glucose-treated ones (+ 33 ± 4 mOsm/kg∙H2O) at 30 min. The glucose and insulin levels were significantly higher in the glucose-treated animals than those in the mannitol-treated animals for 30–60 min and at 30 min, respectively. Meanwhile, there was no significant difference in the other variables between the mannitol-treated animals and glucose-treated animals.
Table 1. Changes in serological variables after the start of mannitol or glucose infusion.
|
Mannitol (3 g/kg/30 min) |
|
Glucose (3 g/kg/30 min) |
| Elapsed time |
Control |
30 min |
60 min |
|
Control |
30 min |
60 min |
| Glucose level (mg/dL) |
107 |
± |
1 |
89 |
± |
4† |
105 |
± |
6 |
|
113 |
± |
7 |
1124 |
± |
57†* |
499 |
± |
51†* |
| Insulin level (ng/mL) |
0.45 |
± |
0.04 |
0.24 |
± |
0.01† |
0.31 |
± |
0.06† |
|
0.96 |
± |
0.60 |
3.39 |
± |
0.96* |
1.18 |
± |
0.38 |
| Glucagon level (pg/mL) |
222 |
± |
14 |
204 |
± |
12 |
217 |
± |
6 |
|
206 |
± |
17 |
162 |
± |
13† |
187 |
± |
10 |
| Osmolality (mOsm/kg∙H2O) |
302 |
± |
1 |
339 |
± |
2† |
325 |
± |
3† |
|
302 |
± |
2 |
335 |
± |
4† |
316 |
± |
4† |
| Na+ concentration (mEq/L) |
147 |
± |
2 |
130 |
± |
2† |
138 |
± |
1† |
|
146 |
± |
1 |
134 |
± |
1† |
145 |
± |
1 |
| K+ concentration (mEq/L) |
3.6 |
± |
0.2 |
3.6 |
± |
0.2 |
4.4 |
± |
0.3† |
|
3.6 |
± |
0.2 |
3.2 |
± |
0.2 |
3.3 |
± |
0.2 |
| Cl− concentration (mEq/L) |
114 |
± |
1 |
102 |
± |
2† |
108 |
± |
1† |
|
110 |
± |
2 |
102 |
± |
2† |
109 |
± |
3 |
Each serological variable was quantitatively determined in plasma obtained after the start of administration of 3 g/kg/30 min of mannitol (left) and 3 g/kg/30 min of glucose (right). Data are presented as mean ± S.E. (n = 4 for each treatment). †p < 0.05 vs Control. *p < 0.05 vs Mannitol-treated animals at the respective time point.
DISCUSSION
Challenge of intravenous glucose infusion of 3 g/kg significantly increased both plasma glucose level and osmolality, inducing various cardiovascular effects, most of which observed during its infusion period were similar to those induced by 3 g/kg of mannitol, although the magnitude of positive chronotropic and inotropic effects along with repolarization delay was greater in the glucose-treated animals than in the mannitol-treated ones. We discussed onset mechanisms of the effects of hyperglycemia on each of the biochemical as well as cardiovascular variables in comparison with those of mannitol-induced hyperosmolality alone as described below to fill the gap of current knowledge.
Rationale of the dose of glucose and mannitol
We did not plan to simulate total parenteral nutrition, but tried to reproduce acute hyperglycemic condition in intact dogs. We set intravenous dose of glucose infusion at 3 g/kg over 30 min, which would be 2–3 times greater than those usually used in oral glucose tolerance test for clinical practice (Masharani and Kroon, 2021), enabling to produce hyperglycemia in normal subjects as well as animals. Since the clinically recommended one-time intravenous drip infusion dose of mannitol is 1–3 g/kg for reducing intracranial pressure and/or intraocular tension according to the information from the manufacturer, and the molecular weight of mannitol (182.172) is similar to that of glucose (180.16), we set the same dose for mannitol infusion as that for glucose one to produce a similar level of hyperosmolality, enabling to precisely analyze the effects of hyperglycemia. The plasma glucose level increased from 113 ± 7 to 1,124 ± 57 mg/dL at the end of infusion, increment of which would be maximum within the expected range when a dose of 3 g/kg of compound was given to the anesthetized model dogs (Hagiwara-Nagasawa et al., 2021; Nunoi et al., 2021), supporting that glucose may have relatively small volume of distribution as previously described (Mari et al., 2011), and suggesting that the functions of glucose transporter and/or sodium-glucose transporter might have reached their plateaus. As such, the remarkable hyperglycemia may mimic certain clinical situations like “hyperosmolar hyperglycemic state”, a complication of diabetes mellitus, in which high plasma glucose level of 600–1200 mg/dL results in high osmolarity without inducing significant ketoacidosis (Powers et al., 2018).
Biochemical pathophysiology
Glucose and mannitol infusions significantly increased osmolality to a similar extent by 33 ± 4 and 37 ± 1 mOsm/kg∙H2O, respectively, thus enabling to discuss the osmolality-independent pathophysiology of hyperglycemia in comparison with osmolality-dependent one. Glucose infusion significantly elevated plasma glucose level, and tended to increase insulin concentration, but significantly decreased glucagon concentration, which can be predicted as physiological responses. Also, relatively smaller increase of insulin compared with larger elevation of glucose level could be due to its intravenous administration route, since incretin secretion boosting insulin release largely depends on the oral ingestion of glucose (Holst and Gromada, 2004). Meanwhile, mannitol infusion decreased or tended to reduce those three variables possibly through dilution of the plasma, which could be explained by basic physicochemical property of mannitol. The magnitudes of decreases in Na+ and Cl– concentrations were actually the same between glucose and mannitol infusions, which could be also understood by dilution of the plasma through the osmolality-dependent mechanism. It should be noted that the direction of changes in K+ concentration was opposite between the two interventions; namely, glucose infusion tended to decrease it for 30–60 min, whereas mannitol infusion elevated it at 60 min. Hyperosmolality by itself could gradually shift the intracellular K+ to extracellular space due to dilutional acidosis (Moreno et al., 1969), which could have operated in this study. One can speculate that mildly increased insulin concentration in the glucose-treated animals may have activated Na+/K+-ATPase in the body including the heart, which would transport two K+ into the cell and three Na+ toward the outside (Ferrannini et al., 1988; Tack et al., 1996), partly counteracting the osmolality-dependent dynamics of K+ concentration.
Cardiohemodynamic effects
Mannitol infusion decreased the total peripheral vascular resistance, but increased the heart rate, cardiac output, left ventricular contraction and preload to the left ventricle, resulting in little change in the mean blood pressure. The underlying pathophysiology could be at least in part understood as follows. The hyperosmolality would enhance NO release from the endothelial cells dilating the resistant vessels (Steenbergen and Bohlen, 1993), which could trigger the reflex-mediated increase of sympathetic tone, increasing the sinus automaticity and ventricular contraction during the infusion period (Katzung, 2021). Mannitol infusion along with its resulting hyperosmolality may also increase the circulating blood volume, which would increase the preload to the left ventricle, further enhancing the ventricular contraction. In the previous experiments using isolated ventricular muscle (Allen and Smith, 1987; Ogura et al., 1997), the hyperosmotic stress has been shown to directly elevate ventricular [Na+]i and [Ca2+]i, prolong the action potential duration, and enhance cardiac contractility, which could be added to our in vivo observation. Meanwhile, the intraventricular conduction delay indicated by the QRS-width prolongation in this study would make the ventricular contraction less synchronous, potentially limiting the ventricular pump function in vivo. These multifarious effects of mannitol cooperatively increased the heart rate and left ventricular contraction leading to the net increase of cardiac output, which might have maintained the mean blood pressure within the physiological range.
Glucose infusion exerted essentially the same cardiohemodynamic effects as mannitol infusion, suggesting the osmolality-dependent mechanism might play a major role during glucose infusion. However, the positive chronotropic and inotropic effects of glucose infusion were 3.1 and 2.7 times greater than those of mannitol infusion, respectively. The differences between these two interventions could be explained by the osmolality-independent mechanism; namely, increases of the glucose level and insulin concentration can activate adrenergic tone (Hoffman et al., 1999) and ICa,L (Contreras-Ferrat et al., 2014), respectively, both leading to greater positive chronotropic and inotropic effects of glucose infusion; whereas opposite changes in the glucose level and insulin concentration might be associated with the less potent chronotropic and inotropic effects of mannitol infusion. In addition, glucose infusion tended to increase the double product, but mannitol infusion showed an opposite action, suggesting that the osmolality-independent mechanism might have contributed to the increase of myocardial oxygen consumption (Gobel et al., 1978; Nelson et al., 1974).
Electrophysiological effects
Mannitol infusion significantly prolonged the PR interval as well as QRS width in the dogs, reproducing our previous in vitro observation made in the canine isolated, blood-perfused atrioventricular node preparation (Lurie et al., 1999). In that study, mannitol selectively infused into the atrioventricular nodal artery in 10 to 30% of total blood flow resulted in a prolongation of atrio-His (AH) interval and eventually resulted in the development of reversible conduction block, whereas a similar prolongation was observed in His-ventricular (HV) interval with selective infusion of mannitol into the ventricular septal artery in 10 to 30% of total blood flow; in which increase of the extracellular space due to cell shrinkage was found to be associated with the alteration of the atrioventricular nodal and intraventricular conductions (Lurie et al., 1999). Thus, the current study indicates that such mannitol-induced, osmolality-dependent mechanism could be reproduced in the in situ hearts. On the other hand, since glucose infusion exerted qualitatively and quantitatively similar effects on the PR interval and QRS width to mannitol infusion during the infusion period, its osmolality-dependent mechanism may play a major role for the conduction delay. After the termination of glucose infusion, significant shortening of the PR interval was confirmed, which was not observed after that of mannitol infusion as shown in Fig. 3. Accordingly, this positive dromotropic action of hyperglycemia could be explained by the osmolality-independent mechanism; namely, the glucose-induced activation of adrenergic tone (Hoffman et al., 1999) and/or insulin-dependent increase of ICa,L (Contreras-Ferrat et al., 2014) as discussed above.
Mannitol infusion mildly prolonged the QTcV, which was essentially in good accordance with previous in vitro studies using various concentrations of mannitol (Ehara and Hasegawa, 1983; Ogura et al., 1997; Sasaki et al., 1994). In those studies, the prolongation of action potential duration was mainly induced by a slowing of repolarization in the region between + 20 and – 20 mV (Ogura et al., 1997), which was associated with an increase of the net inward current at plateau phase due to a slowing of the inactivation of ICa,L (Ogura et al., 1997), an inhibition of the delayed outward-rectifying IK (Ogura et al., 1997; Sasaki et al., 1994), and an enhancement of inward current by Na+-Ca2+ exchanger (INa-Ca) at phase 3 repolarization (Ogura et al., 1997). Thus, the current study suggests that those previously described mannitol-induced, osmolality-associated electrophysiological processes leading to prolongation of the action potential duration could be manifested in vivo. On the other hand, glucose infusion prolonged the QTcV 2.1 times greater than mannitol infusion, indicating the contribution of osmolality-independent mechanism. One can speculate that the slight increase of insulin concentration by glucose infusion may have activated Na+/K+-ATPase in the heart, locally elevating intracellular K+ and extracellular Na+ in the presence of hypokalemia making the resting membrane potential more hyperpolarized (Harvey and Grant, 2021), which might suppress IK1 (Ishihara, 2018). Indeed, in a previous study using guinea-pig cardiac myocytes (Sasaki et al., 1994), IK1 was not suppressed by hyperosmolality alone, indirectly supporting our hypothesis above. Also, the activation of Na+/K+-ATPase may enhance inward current by INa-Ca. In addition, the slight increase of insulin concentration could also enhance ICa,L in the cardiomyocytes, resulting in the increase of net inward current (Contreras-Ferrat et al., 2014). In effect, these osmolality-independent mechanisms may have accentuated the hyperosmolality-associated repolarization delay.
Clinical implication and study limitation
The information obtained in this study may help understand how acute hyperglycemia may be associated with various types of cardiohemodynamic and electrophysiological responses in human subjects. However, there are some limitations in this study. First, one dose of glucose was tested, which induced unusual high plasma glucose level of > 1,000 mg/dL, since current experiment was planned to focus on exploring the onset mechanisms of hyperglycemia-associated, two types of distinct pathophysiological processes including “osmolality-dependent” and “osmolality-independent” pathways in vivo. In order to assess the cardiovascular effects of more clinically-relevant level of hyperglycemia including spikes in blood glucose like postprandial hyperglycemia, the dose-related cardiovascular responses with variable infusion period need to be assessed. Second, although we found that hyperglycemia may prolong the QTcV by “osmolality-independent” mechanism partly through insulin-induced Na+/K+-ATPase activation pathway, the hyperinsulinemic-euglycemic clamp was reported to hardly alter the QTc in healthy volunteers (Taubel et al., 2013). Thus, further analyses would be needed to better understand the role of insulin in connection with hyperglycemic condition. Third, since the anesthesia may alter glucose uptake and metabolism as well as insulin signaling (Diltoer and Camu, 1988; Saho et al., 1997; Tanaka et al., 2005), the cardiovascular effects of hyperglycemia also need to be assessed in conscious animals using telemetry system along with the measurement of circulating catecholamine.
In conclusion, the glucose infusion-induced cardiovascular effects could be essentially attributed to osmolality-dependent mechanisms, whereas the positive chronotropic, inotropic and dromotropic effects along with the repolarization delay were greater in the glucose-treated animals than in the mannitol-treated ones, for which osmolality-independent autonomic and/or ionic mechanisms may play additional roles.
ACKNOWLEDGMENTS
The authors thank Mr. Yoshiki Hirokawa, Dr. Yoshio Nunoi and Mrs. Yuri Ichikawa for their technical assistance, and Dr. Shinichi Kawai for his insightful advice. This study was supported in part by research grants from Richmond Research Institute, and from Japan Society for the Promotion of Science (JSPS KAKENHI grant number 20K16136 to RK).
Conflict of interest
The authors declare that there is no conflict of interest.
REFERENCES
- Allen, D.G. and Smith, G.L. (1987): The effects of hypertonicity on tension and intracellular calcium concentration in ferret ventricular muscle. J. Physiol., 383, 425-439.
- Ceriello, A. (2008): Cardiovascular effects of acute hyperglycaemia: pathophysiological underpinnings. Diab. Vasc. Dis. Res., 5, 260-268.
- Cipolla, M.J., Porter, J.M. and Osol, G. (1997): High glucose concentrations dilate cerebral arteries and diminish myogenic tone through an endothelial mechanism. Stroke, 28, 405-411.
- Contreras-Ferrat, A., Lavandero, S., Jaimovich, E. and Klip, A. (2014): Calcium signaling in insulin action on striated muscle. Cell Calcium, 56, 390-396.
- Diltoer, M. and Camu, F. (1988): Glucose homeostasis and insulin secretion during isoflurane anesthesia in humans. Anesthesiology, 68, 880-886.
- Ehara, T. and Hasegawa, J. (1983): Effects of hypertonic solution on action potential and input resistance in the guinea-pig ventricular muscle. Jpn. J. Physiol., 33, 151-167.
- Ferrannini, E., Taddei, S., Santoro, D., Natali, A., Boni, C., Del Chiaro, D. and Buzzigoli, G. (1988): Independent stimulation of glucose metabolism and Na+-K+ exchange by insulin in the human forearm. Am. J. Physiol., 255, E953-E958.
- Giugliano, D., Marfella, R., Coppola, L., Verrazzo, G., Acampora, R., Giunta, R., Nappo, F., Lucarelli, C. and D’Onofrio, F. (1997): Vascular effects of acute hyperglycemia in humans are reversed by L-arginine. Evidence for reduced availability of nitric oxide during hyperglycemia. Circulation, 95, 1783-1790.
- Gobel, F.L., Norstrom, L.A., Nelson, R.R., Jorgensen, C.R. and Wang, Y. (1978): The rate-pressure product as an index of myocardial oxygen consumption during exercise in patients with angina pectoris. Circulation, 57, 549-556.
- Hagiwara-Nagasawa, M., Kambayashi, R., Goto, A., Nunoi, Y., Izumi-Nakaseko, H., Takei, Y., Matsumoto, A. and Sugiyama, A. (2021): Cardiohemodynamic and arrhythmogenic effects of the anti-atrial fibrillatory compound vanoxerine in halothane-anesthetized dogs. Cardiovasc. Toxicol., 21, 206-215.
- Harvey, R.D. and Grant, A.O. (2021): Agents used in cardiac arrhythmias. In: Basic & Clinical Pharmacology, 15th edn (Katzung, B.G. and Vanderah, T.W., ed.), pp.235-261, McGraw Hill Education, New York.
- Hoffman, R.P., Hausberg, M., Sinkey, C.A. and Anderson, E.A. (1999): Hyperglycemia without hyperinsulinemia produces both sympathetic neural activation and vasodilation in normal humans. J. Diabetes Complications, 13, 17-22.
- Holst, J.J. and Gromada, J. (2004): Role of incretin hormones in the regulation of insulin secretion in diabetic and nondiabetic humans. Am. J. Physiol. Endocrinol. Metab., 287, E199-E206.
- Hyltén-Cavallius, L., Iepsen, E.W., Christiansen, M., Graff, C., Linneberg, A., Pedersen, O., Holst, J.J., Hansen, T., Torekov, S.S. and Kanters, J.K. (2017): Glucose ingestion causes cardiac repolarization disturbances in type 1 long QT syndrome patients and healthy subjects. Heart Rhythm, 14, 1165-1170.
- Ishihara, K. (2018): External K+ dependence of strong inward rectifier K+ channel conductance is caused not by K+ but by competitive pore blockade by external Na. J. Gen. Physiol., 150, 977-989.
- Katzung, B.G. (2021): Introduction to autonomic pharmacology. In: Basic & Clinical Pharmacology, 15th edn (Katzung, B.G and Vanderah, T.W., ed.), pp.93-110, McGraw Hill Education, New York.
- Kilkenny, C., Browne, W., Cuthill, I.C., Emerson, M. and Altman, D.G., NC3Rs Reporting Guidelines Working Group. (2010): Animal research: reporting in vivo experiments: the ARRIVE guidelines. Br. J. Pharmacol., 160, 1577-1579.
- Lurie, K.G., Sugiyama, A., McKnite, S., Coffeen, P., Hashimoto, K. and Motomura, S. (1999): Modulation of AV nodal and Hisian conduction by changes in extracellular space. Am. J. Physiol., 276, H953-H960.
- Marfella, R., Nappo, F., De Angelis, L., Siniscalchi, M., Rossi, F. and Giugliano, D. (2000): The effect of acute hyperglycaemia on QTc duration in healthy man. Diabetologia, 43, 571-575.
- Mari, A., Zafian, P.T., Achanfuo-Yeboah, J. and Camacho, R.C. (2011): Relationship between glucose volume of distribution and the extracellular space: a multiple tracer study. Metabolism, 60, 1627-1633.
- Masharani, U. and Kroon, L. (2021): Pancreatic hormones & glucose-lowering drugs. In: Basic & Clinical Pharmacology, 15th edn (Katzung, B.G. and Vanderah, T.W., ed.), pp.773-779, McGraw Hill Education, New York.
- McGrath, J.C., Drummond, G.B., McLachlan, E.M., Kilkenny, C. and Wainwright, C.L. (2010): Guidelines for reporting experiments involving animals: the ARRIVE guidelines. Br. J. Pharmacol., 160, 1573-1576.
- Montagnani, M., Chen, H., Barr, V.A. and Quon, M.J. (2001): Insulin-stimulated activation of eNOS is independent of Ca2+ but requires phosphorylation by Akt at Ser(1179). J. Biol. Chem., 276, 30392-30398.
- Moreno, M., Murphy, C. and Goldsmith, C. (1969): Increase in serum potassium resulting from the administration of hypertonic mannitol and other solutions. J. Lab. Clin. Med., 73, 291-298.
- Nagueh, S.F., Sun, H., Kopelen, H.A., Middleton, K.J. and Khoury, D.S. (2001): Hemodynamic determinants of the mitral annulus diastolic velocities by tissue Doppler. J. Am. Coll. Cardiol., 37, 278-285.
- Nelson, R.R., Gobel, F.L., Jorgensen, C.R., Wang, K., Wang, Y. and Taylor, H.L. (1974): Hemodynamic predictors of myocardial oxygen consumption during static and dynamic exercise. Circulation, 50, 1179-1189.
- Nielsen, R., Nørrelund, H., Kampmann, U., Bøtker, H.E., Møller, N. and Wiggers, H. (2013): Effect of acute hyperglycemia on left ventricular contractile function in diabetic patients with and without heart failure: two randomized cross-over studies. PLoS One, 8, e53247.
- Nunoi, Y., Kambayashi, R., Goto, A., Hagiwara-Nagasawa, M., Chiba, K., Izumi-Nakaseko, H., Kawai, S., Takei, Y., Matsumoto, A., Watanabe, Y. and Sugiyama, A. (2021): In vivo characterization of anti-atrial fibrillatory potential and pharmacological safety profile of INa,L plus IKr inhibitor ranolazine using the halothane-anesthetized dogs. Heart Vessels, 36, 1088-1097.
- Ogura, T., You, Y. and McDonald, T.F. (1997): Membrane currents underlying the modified electrical activity of guinea-pig ventricular myocytes exposed to hyperosmotic solution. J. Physiol., 504, 135-151.
- Powers, A.C., Niswender, K.D. and Rickels, M.R. (2018): Diabetes Mellitus: Management and Therapies. In: Harrison’s Principles of Internal Medicine, 20th edn (Jameson, J.L., Fauci, A.S., Kasper, D.L., Hauser, S.L., Longo, D.L. and Loscalzo, J., ed.), pp.2859-2873, McGraw-Hill Education/Medical, New York.
- Saho, S., Kadota, Y., Sameshima, T., Miyao, J., Tsurumaru, T. and Yoshimura, N. (1997): The effects of sevoflurane anesthesia on insulin secretion and glucose metabolism in pigs. Anesth. Analg., 84, 1359-1365.
- Saito, H., Kambayashi, R., Hagiwara-Nagasawa, M., Nunoi, Y., Goto, A., Izumi-Nakaseko, H., Kawai, S., Takei, Y., Matsumoto, A., Hoshiai, K., Akie, Y. and Sugiyama, A. (2021a): In vivo comparison of dl-sotalol-induced electrocardiographic responses among halothane anesthesia, isoflurane anesthesia with nitrous oxide, and conscious state. J. Pharmacol. Sci., 145, 16-22.
- Saito, H., Kambayashi, R., Goto, A., Hagiwara-Nagasawa, M., Hoshiai, K., Nunoi, Y., Izumi-Nakaseko, H., Akie, Y., Takei, Y., Matsumoto, A. and Sugiyama, A. (2021b): In vivo analysis of concentration-dependent effects of halothane or isoflurane inhalation on the electrocardiographic and hemodynamic variables in dogs. J. Pharmacol. Sci., 145, 268-272.
- Sasaki, N., Mitsuiye, T., Wang, Z. and Noma, A. (1994): Increase of the delayed rectifier K+ and Na(+)-K+ pump currents by hypotonic solutions in guinea pig cardiac myocytes. Circ. Res., 75, 887-895.
- Scherrer, U., Randin, D., Vollenweider, P., Vollenweider, L. and Nicod, P. (1994): Nitric oxide release accounts for insulin’s vascular effects in humans. J. Clin. Invest., 94, 2511-2515.
- Steenbergen, J.M. and Bohlen, H.G. (1993): Sodium hyperosmolarity of intestinal lymph causes arteriolar vasodilation in part mediated by EDRF. Am. J. Physiol., 265, H323-H328.
- Sugiyama, A. (2008): Sensitive and reliable proarrhythmia in vivo animal models for predicting drug-induced torsades de pointes in patients with remodelled hearts. Br. J. Pharmacol., 154, 1528-1537.
- Tack, C.J., Lutterman, J.A., Vervoort, G., Thien, T. and Smits, P. (1996): Activation of the sodium-potassium pump contributes to insulin-induced vasodilation in humans. Hypertension, 28, 426-432.
- Tanaka, T., Nabatame, H. and Tanifuji, Y. (2005): Insulin secretion and glucose utilization are impaired under general anesthesia with sevoflurane as well as isoflurane in a concentration-independent manner. J. Anesth., 19, 277-281.
- Taubel, J., Lorch, U., Ferber, G., Singh, J., Batchvarov, V.N., Savelieva, I. and Camm, A.J. (2013): Insulin at normal physiological levels does not prolong QT(c) interval in thorough QT studies performed in healthy volunteers. Br. J. Clin. Pharmacol., 75, 392-403.
- Van de Water, A., Verheyen, J., Xhonneux, R. and Reneman, R.S. (1989): An improved method to correct the QT interval of the electrocardiogram for changes in heart rate. J. Pharmacol. Methods, 22, 207-217.