Abstract
The gastrointestinal (GI) tract is more vulnerable to effects by the outside environment, and experiences oxidative stress. A wide diversity of GI disorders can be partially attributed to oxidative stress. However, the mechanism of oxidative stress-caused GI pathological changes is not clear. In the present study, human gastric epithelial cells (hGECs) were treated with hydrogen peroxide (H2O2), and oxidative stress was determined. The effect of oxidative stress on the levels of some antioxidative enzymes, proliferation, nuclear DNA damage, apoptosis, expression of ten-eleven translocation (TET), and level of DNA methylation was determined in these cells. The results showed that H2O2 treatment caused oxidative stress, increased the levels of superoxide dismutase (SOD), catalase (CAT), and malondialdehyde (MDA), decreased the level of glutathione (GSH), inhibited proliferation, caused nuclear DNA damage and apoptosis, upregulated the expression of TET1 gene, and ultimately led to active DNA demethylation in hGECs. The present study presents a mechanism by which oxidative stress induces active DNA demethylation in hGECs. We propose that TET inhibitors can be used to restore the oxidative stress-induced DNA demethylation, and thus inhibit possible malignant transformation of GI cells.
INTRODUCTION
Some exogenous factors, including ionizing radiation, chemotherapeutic agent, cigarette smoke, dietary iron and copper, trans fatty acids, alcohol, and many drugs and xenobiotics, can generate reactive oxygen species (ROS) in the gastrointestinal (GI) tract (Bhattacharyya et al., 2014). If excessive ROS cannot be quenched by endo- and exogenous antioxidants, the GI tract may experience oxidative stress, leading to a wide diversity of GI disorders, even the occurrence of cancer (Pérez et al., 2017).
The malignant transformation of a normal cell usually accompanies epigenetic alterations and the subsequent aberrance in gene expression, metabolism, and biochemical/signaling pathways. DNA methylation, a major epigenetic modification, is abnormal in cancer cell genome, and usually exhibits general hypomethylation along with focal hypermethylation at promoters of a number of tumor suppressor genes (Ilango et al., 2020; Sato et al., 2017). Epigenetic modifications can be affected by several external factors, such as environment, pollution, lifestyle, and diet (Ilango et al., 2020). It has been confirmed that oxidative stress can induce global DNA demethylation, and carcinogenesis (Franco et al., 2008; Donkena et al., 2010; Wu and Ni, 2015). Several mechanisms are proposed for oxidative stress-induced DNA demethylation, including DNA damage, and the presence of 8-hydroxy-2-deoxyguanosine (8-OHdG) and O6-methylguanine (Wachsman, 1997; Weitzman et al., 1994; Hepburn et al., 1991). In fact, DNA demethylation can be passive or active. Passive DNA demethylation occurs when DNA methyltransferase 1 (DNMT1) is inhibited or absent during successive rounds of DNA replication; while active DNA demethylation is mediated by ten-eleven translocation (TET) family of dioxygenases (Sadakierska-Chudy et al., 2015). In our previous study, oxidative stress can cause nuclear DNA damage and global passive DNA demethylation in human gastric cancer cells (hGCCs) via damaged DNA repair-p53-p21/GADD45A-cyclin/CDK-Rb/E2F-DNMT1 signaling axis (Tong et al., 2020). It needs to be further explored whether oxidative stress can affect the expression of TET and subsequently change the level of DNA methylation.
In the present study, hydrogen peroxide (H2O2) was used to cause oxidative stress to human gastric epithelial cells (hGECs), and the effect of oxidative stress on proliferation, nuclear DNA damage, apoptosis, the levels of some antioxidative enzymes, the expression of TET, and the level of DNA methylation was determined in these cells.
MATERIALS AND METHODS
In vitro cell culture
A normal hGECs line GES-1 was derived from Fenghui Biotechnology Co., Ltd. (Changsha, Hunan, China) and cultured in RPMI-1640 medium (Gibco, Thermo Fisher Scientific, Waltham, MA, USA) supplemented with 10% (v/v) fetal bovine serum (FBS; Gibco), 100 IU/mL penicillin, and 100 μg/mL streptomycin at 37°C in a humidified atmosphere of 5% CO2. When the cells reached 80% to 90% confluency, they were subcultured or frozen into aliquots in 10% (v/v) dimethyl sulfoxide (DMSO; Solarbio, Beijing, China), 20% (v/v) FBS and 70% (v/v) RPMI-1640 medium, and stored in liquid nitrogen.
Detection of ROS
Cells were seeded at a density of 104 cells/well in a 96-well culture plate, and cultured overnight. When they reached 80% to 90% confluence, culture medium supplemented with different concentrations (0, 25, 50, 75, and 100 μM) of H2O2 (Sigma-Aldrich, Merck Life Science Co., Ltd., Shanghai, China) were used to treat cells for different times (3, 6, 12, and 24 hr). A fluorescent probe of 2′,7′-dichlorofluorescein diacetate (DCFH-DA) (Sigma-Aldrich) was added to the culture medium to a final concentration of 10 μM. After the cells were incubated for 1 hr, they were washed with phosphate-buffered saline (PBS). An inverted fluorescence microscope (Ti-U; Nikon, Tokyo, Japan) was used to capture fluorescence images, and fluorescence intensity was measured using a microplate reader (EX/EM = 485/535 nm; Synergy HT; BioTek Instruments, Inc., Winooski, VT, USA).
Oxidative stress detection
Cells were seeded at a density of 104 cells/mL in 100 mm culture dishes and cultured to 80–90% confluency. Then, cells were treated with H2O2 (0 or 25 μM) for 24 hr. We detected levels of superoxide dismutase (SOD), catalase (CAT), malondialdehyde (MDA), and reduced glutathione (GSH) in the cells and determined whether H2O2 treatment could result in oxidative stress in hGECs. Briefly, after H2O2 treatment, cells were washed with PBS and then collected using a cell scraper. After washing twice with PBS, the cells were disrupted by sonication (5 rounds of sonication at 30-sec intervals at 30 W, 20 kHz, and 5-sec bursts) using an ultrasonic homogenizer (VCX 130; Sonics & Materials, Inc., Newtown, CT, USA). After centrifugation of the cell lysates at 4000 rpm for 10 min, the amount of protein in the supernatant was determined using a Bradford assay kit (detergent-compatible; Meilunbio, Dalian, China) according to manufacturer instructions. The supernatant was then treated with a SOD assay kit (hydroxylamine method), CAT assay kit (visible light), MDA assay kit (thiobarbituric acid method), and Reduced GSH assay kit (all kits were purchased from Nanjing Jiancheng Bioengineering Institute, Nanjing, China), and the optical density (OD) of the samples was recorded using a microplate reader (Synergy HT). The levels of SOD, CAT, MDA, and GSH were calculated according to the formula recommended by the manufacturer.
Cell viability assay
The proliferation of hGECs was analyzed using the 3-(4,5-dimethylthiazol-2-yl)-2,5-diphenyl tetrazolium bromide (MTT) assay. Briefly, cells were plated at a density of 104 cells/well in 96-well culture plates and cultured overnight to allow attachment. Then, they were treated with different concentrations (0 and 25 μM) of H2O2 for 24, 48, and 72 hr. The culture medium was replaced every 24 hr. MTT solution (Sigma-Aldrich) was added to each well at a final concentration of 0.5 mg/mL and cells were cultured for another 3 hr. At the end of incubation, supernatant was removed, 150 μL DMSO was added to each well to resolve formazan crystals, and the plates were slightly oscillated for 10 min in darkness. Subsequently, a microplate reader (Synergy HT) was used to record the OD of each well at 570 nm. The cell viability (%) was calculated using the formula: (OD570 of the treatment samples/OD570 of the control samples) × 100%.
Immunocytochemistry
Cells were cultured on glass coverslips (14 mm in diameter), which were placed at the bottom of 24-well culture plates. After cells were treated with 0 or 25 μM H2O2 for 24 hr, they were fixed and permeabilized as described previously (Tong et al., 2020). Briefly, cells were washed with PBS, fixed with 4% (w/v) paraformaldehyde (Solarbio) for 10 min, washed thrice with cold PBS, permeabilized with 0.1% (v/v) Triton X-100 (Solarbio) for 10 min, and washed another three times with PBS. After blocked with 10% (v/v) goat serum (dissolved in PBS) (Solarbio) for 30 min, cells were incubated with rabbit anti-human monoclonal antibodies against phosphor-γH2AX (Ser139; Cell Signaling Technology, Danvers, MA, USA) and 5-methylcytosine (5mC; Cell Signaling Technology), rabbit anti-human polyclonal antibodies against TET1 (Beyotime Biotechnology, Shanghai, China) and TET3 (Beyotime Biotechnology), or mouse anti-human monoclonal antibody against TET2 (Abcam, Cambridge, MA, USA) at room temperature for 1 hr, followed by three washes with PBS. The cells were stained in the dark with Alexa Fluor 488-conjugated goat anti-rabbit (Abcam), or anti-mouse IgG (H&L) (Qualityard, Beijing, China) at room temperature for 1 hr, washed thrice with PBS, and stained with 1 μg/mL 4′,6-diamidino-2-phenylindole (DAPI; Abcam) for 1 min. The cells were then washed with PBS, mounted under a coverslip in antifade mounting medium (Sunshine Biotech, Beijing, China), and allowed to dry overnight at room temperature in the dark. Fluorescence was observed under an A1R confocal laser-scanning microscope (Nikon, Tokyo, Japan).
A modified protocol of immunocytochemistry was used to detect the amount of 5-hydromethylcytosine (5hmC) in cells, in which cells were permeabilized with 0.1% (v/v) Triton X-100 for 10 min and subsequently treated with 2N HCl at room temperature for 30 min, followed by treatment with 100 mM Tris-HCl (pH 8.0) at room temperature for 10 min. The remaining procedures were the same as described above. Mouse anti-human monoclonal antibody against 5hmC (Cell Signaling Technology) was used as the primary antibody, and Alexa Fluor 488-conjugated goat anti-mouse IgG (H&L) (Qualityard) was used as the secondary antibody.
Apoptosis assay
After cells were treated with different concentrations (0 and 25 μM) of H2O2 for 24, 48, and 72 hr, they were removed from the 100 mm culture plates, washed 1-2 times in cold PBS, and stained with a TransDetect Annexin V-FITC/PI Cell Apoptosis Detection Kit (TransGen Biotech, Beijing, China) according to manufacturer’s protocol. Subsequently, the apoptosis rate ((the number of apoptotic cells/the number of detected cells) × 100%) was assayed using a flow cytometer (NAVIOS; Beckman Coulter, Shanghai, China).
Bisulfite sequencing
Cells were cultured in 100 mm cultured dishes. After the cells were treated with H2O2 (0 or 25 μM) for 24 hr, genomic DNA was extracted by using a TIANamp Genomic DNA Kit (TIANGEN Biotech, Beijing, China), followed by bisulfite conversion with a DNA Bisulfite Conversion Kit (TIANGEN Biotech). The sequence of LINE-1 transposon (L1Hs) was downloaded from NCBI (GenBank accession number: X58075.1), and the level of methylation in one of the CpG islands (CGIs) in this sequence was analyzed by bisulfite sequencing as described previously (Tong et al., 2020). Methyl Primer Express Software v1.0 (Thermo Fisher Scientific) was used to design a pair of primers for methylation-specific PCR (MS PCR). The primers were forward, 5′-TAA GGG GTT AGG GAG TTT TTT T-3′ and reverse, 5′-TTT ATT TAT CTA TAC CCT ACC CCC A-3′, and were synthesized by Genewiz (Jiangsu, China). A methylation-specific PCR kit (TIANGEN Biotech) was used to perform MS PCR. The MS PCR mixture consisted of 4 μL bisulfite converted DNA, 1 μL forward primer (10 μM), 1 μL reverse primer (10 μM), 1.6 μL dNTPs (2.5 mM), 0.4 μL MSP DNA polymerase (2.5 U/μL), 2 μL 10 × MSP PCR buffer, and 10 μL ddH2O in a total volume of 20 μL. MS PCR reaction was performed by denaturation at 95°C for 5 min, followed by 45 cycles of 94°C for 20 sec, 58°C for 30 sec and 72°C for 20 sec, and a final extension at 72°C for 5 min using a thermocycler (C1000 Touch Thermal Cycler; Bio-Rad, Hercules, CA, USA). The MS PCR products were cloned into a pGM-T vector using a pGM-T Cloning Kit (TIANGEN Biotech). Ligation mixture consisted of 1 μL MS PCR products, 1 μL pGM-T vector (50 ng/μL), 1 μL T4 DNA Ligase (3 U/μL), 5 μL 2 × T4 DNA Rapid Ligation Buffer, and 2 μL ddH2O in a total volume of 10 μL. Ligation reaction was performed at 25°C for 10 min. Recombinant pGM-T vectors were transformed into competent TOP10 E.coli, and LB agar plates, containing 50 μg/mL ampicillin, 50 mg/mL IPTG, and 20 mg/mL X-Gal, were used to screen for positive clones. Ten clones from each sample were identified by colony PCR and sequenced. The methylation of L1Hs was analyzed by DNAMAN software v6.0 (Lynnon Biosoft, San Ramon, CA, USA).
Dot blot assay
Cells were treated with H2O2 (0 or 25 μM) for 24 hr. Genomic DNA was extracted using a TIANamp Genomic DNA Kit (TIANGEN Biotech), denatured at 98°C for 5 min, and then immediately cooled on ice. Different amounts (400, 600, and 800 ng) of denatured DNA were spotted on a nitrocellulose membrane (Solarbio). The membrane was then blocked with 5% (m/v) bovine serum albumin (BSA; Sigma-Aldrich) in Tris Buffered Saline with Tween 20 (TBST; Sunshine Biotech) for 1 hr, and then incubated with rabbit anti-human monoclonal antibody against 5mC (Cell Signaling Technology), or mouse anti-human monoclonal antibody against 5hmC (Cell Signaling Technology) at room temperature for 30 min. After being washed three times in TBST for 5 min, the membrane was incubated with horseradish peroxidase-conjugated goat anti-rabbit or anti-mouse IgG (H&L) (Qualityard) at room temperature for 30 min. After being washed three times in TBST for 5 min, the secondary antibody signal was visualized using a BeyoECL Plus (Beyotime Biotechnology) according to the manufacturer’s protocols, and the signal density was analyzed using the ImageJ software (NIH, Bethesda, MD, USA). To ensure the equal spotting of DNA as a control, the same blot was stained in 0.02% (m/v) methylene blue liquid.
Quantitative reverse transcription polymerase chain reaction (qRT-PCR)
The effect of H2O2 treatment on the expression of TET1, TET2, and TET3 was determined using qRT-PCR as described previously (Tong et al., 2020). Cells were cultured in a medium supplemented with H2O2 (0 or 25 μM) for 24 hr, and total RNA was extracted using RNAiso Plus (TaKaRa, Beijing, China). Primers were synthesized (Genewiz) and are listed in Table 1. The PrimeScript RT reagent kit with gDNA Eraser (TaKaRa) was used to perform RT reactions. The RT mixture consisted of 1 μL total RNA, 2 µL 5 × gDNA Eraser buffer, 1 µL DNA Eraser, and 6 µL RNase-free H2O in a total volume of 10 μL. The reaction mixture was incubated at 42°C for 2 min to eliminate genomic DNA and then supplemented with 1 µL PrimeScript RT enzyme mix I, 4 µL RT primer mix, 4 µL 5 × PrimeScript buffer 2, and 1 µL RNase-free H2O in a total volume of 20 μL. The reaction mixture was incubated at 42°C for 15 min, followed by 85°C for 5 sec to inactivate the reverse transcriptase. TB Green Premix Ex Taq II (Tli RNaseH Plus; TaKaRa) was used for qPCR analysis. The qPCR reaction mixture comprised 1 μL of the products of the RT reaction, 0.6 μL forward primer (10 μM), 0.6 μL reverse primer (10 μM), 7.5 µL 2 × TB Green Premix Ex TaqII (Tli RNaseH Plus), 0.3 µL 50 × ROX reference dye, and 5.0 μL nuclease-free H2O in a total volume of 15 μL. The qPCR reaction was performed by denaturation at 95°C for 30 sec, followed by 40 cycles of 95°C for 5 sec and 58°C for 34 sec using a 7500 real-time PCR system (Applied Biosystems, Thermo Fisher Scientific). The specificity of the qPCR products was confirmed using melting curves. Glyceraldehyde 3-phosphate dehydrogenase (GAPDH) was used as an reference gene, and the expression of TET1, TET2, and TET3 in each group was normalized to that of untreated cells using the 2−∆∆CT method.
Table 1. The primers for qRT-PCR
| Primer |
Sequence |
Tm (°C) |
Product length (bp) |
| TET 1 forward primer |
5′-AGGCCCTGACTCAACTCTCA-3′ |
60.2 |
170 |
| TET 1 reverse primer |
5′-TGGTGGCTCTCCCTGTAAGT-3′ |
60.2 |
|
| TET 2 forward primer |
5′-ATGTATGCAGCCCTTCTCCG-3′ |
59.9 |
243 |
| TET 2 reverse primer |
5′-TTTGCTCCTTGTCTCGACCC-3′ |
60.0 |
|
| TET 3 forward primer |
5′-TAGCGATTGACTGCCGTCTG-3′ |
60.2 |
156 |
| TET 3 reverse primer |
5′-CGCAGCGATTGTCTTCCTTG-3′ |
60.0 |
|
| GAPDH forward primer |
5′-CCATGGGGAAGGTGAAGGTC-3′ |
60.0 |
172 |
| GAPDH reverse primer |
5′-TGGAATTTGCCATGGGTGGA-3′ |
59.9 |
|
Western blot assay
The effects of H2O2 treatment on levels of TET1, TET2, and TET3 were determined by western blot as described previously (Tong et al., 2020). Cells were treated with H2O2 (0 or 25 μM) for 24 hr, followed by lysis using direct cell lysis buffer (Sunshine Biotech). Total proteins from cells were separated by SDS-PAGE and transferred to a polyvinylidene fluoride membrane (Millipore, Merck Life Science Co., Ltd., Shanghai, China). The membrane was blocked with 5% skimmed milk and incubated overnight with rabbit anti-human polyclonal antibodies against TET1 and TET3 (both antibodies were purchased from Beyotime Biotechnology), mouse anti-human monoclonal antibody against TET2 (Abcam), or rabbit anti-human monoclonal antibody against β-actin (ABclonal Technology, Wuhan, China) at 4°C, followed by incubation with horseradish peroxidase-conjugated goat anti-rabbit or anti-mouse IgG (H&L) (Qualityard) at room temperature for 1 hr. Immunoreactive protein bands on the membrane were developed with BeyoECL Plus (Beyotime Biotechnology) according to the manufacturer’s protocols, and the band density was analyzed using the ImageJ software.
Statistical analysis
All experiments were carried out in triplicate, except bisulfite sequencing, which was repeated five times; data are presented as the mean ± standard deviation (SD). The one-way ANOVA (analysis of variance) was used to compare the significance between groups, and the significance is shown as *p < 0.05, **p < 0.01, and ***p < 0.001. Difference with p < 0.05 was considered statistically significant.
RESULTS
H2O2 elevates the level of ROS, causes the oxidative stress of hGECs
After hGECs were treated with different concentration of H2O2 for different time, DCFH-DA, a redox-sensitive fluorescent probe, was used to evaluate the effect of H2O2 on the level of ROS in cells. As shown in Fig. 1a, treatment with 50 μM or less H2O2 for 3 hr could not significantly elevate the levels of ROS in hGECs. However, when treatment time was more than 3 hr, the levels of ROS in all treatment groups were significantly (p < 0.001) higher than those in the control groups, and more than 50 μM H2O2 seemingly could not further elevate the levels of ROS in hGECs. After hGECs were treated with 25 or 50 μM H2O2 for 24 hr, an inverted fluorescence microscope was used to further confirm the effect of H2O2 treatment on the elevation of ROS in hGECs. As shown in Fig. 1b, the fluorescence signal in cells, which is positively correlated with the level of ROS, was stronger with the increase in the concentration of H2O2. These results indicate that H2O2 treatment could elevate the level of ROS in hGECs, and this effect was time- and dose-dependent.
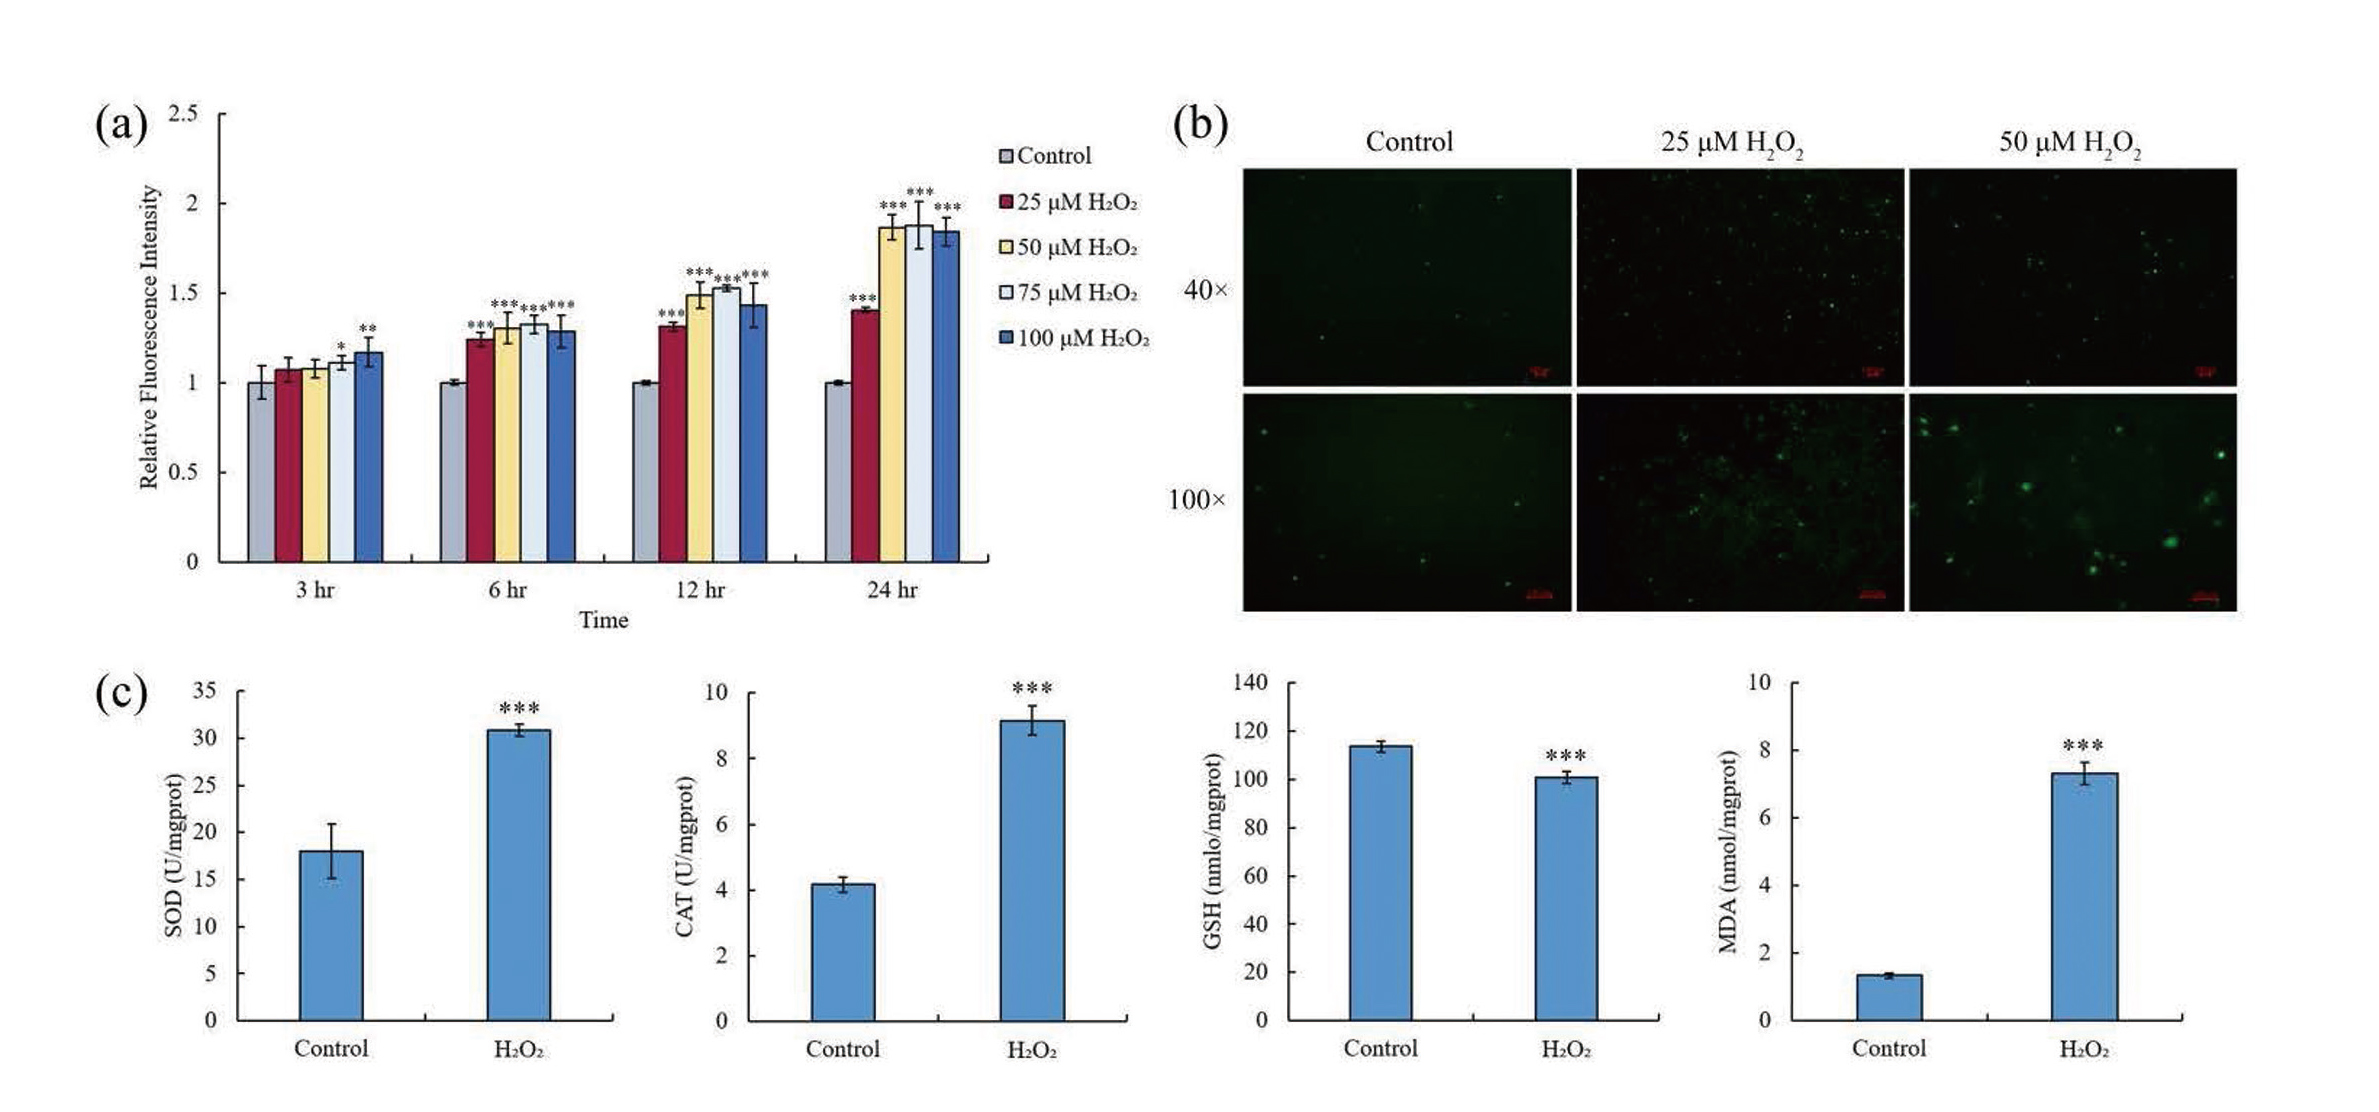
After hGECs were treated with 25 μM H2O2 for 24 hr, the levels of four oxidative stress indicators, SOD, CAT, MDA, and GSH (Samarghandian et al., 2017), were detected, and whether this treatment caused the oxidative stress of hGECs was determined. Fig. 1c shows that the levels of SOD, CAT, and MDA were significantly (p < 0.001) higher in the H2O2 treatment groups, while the level of GSH was significantly (p < 0.001) lower in these groups. Oxidative stress upregulates the expression of SOD and CAT to quench ROS, increases the level of MDA due to peroxidation of polyunsaturated fatty acids by ROS, and leads to the oxidation of GSH into GSSG (oxidized glutathione) (Cheleschi et al., 2017; He et al., 2018; Bjørklund et al., 2021). These results confirm that treatment with 25 μM H2O2 for 24 hr could elevate the level of ROS, cause the oxidative stress of hGECs.
Oxidative stress inhibits proliferation, and causes DNA damage, and apoptosis of hGECs
After hGECs were treated with 25 μM H2O2 for 24, 48, and 72 hr, MTT was used to determine cell viability, the effect of oxidative stress on the proliferation of hGECs was evaluated. Fig. 2a shows that H2O2 treatment could significantly (p < 0.001) decrease the cell viability of hGECs, and this decrease was more severe with the prolonging of treatment time. This result indicates that oxidative stress could inhibit the proliferation of hGECs.
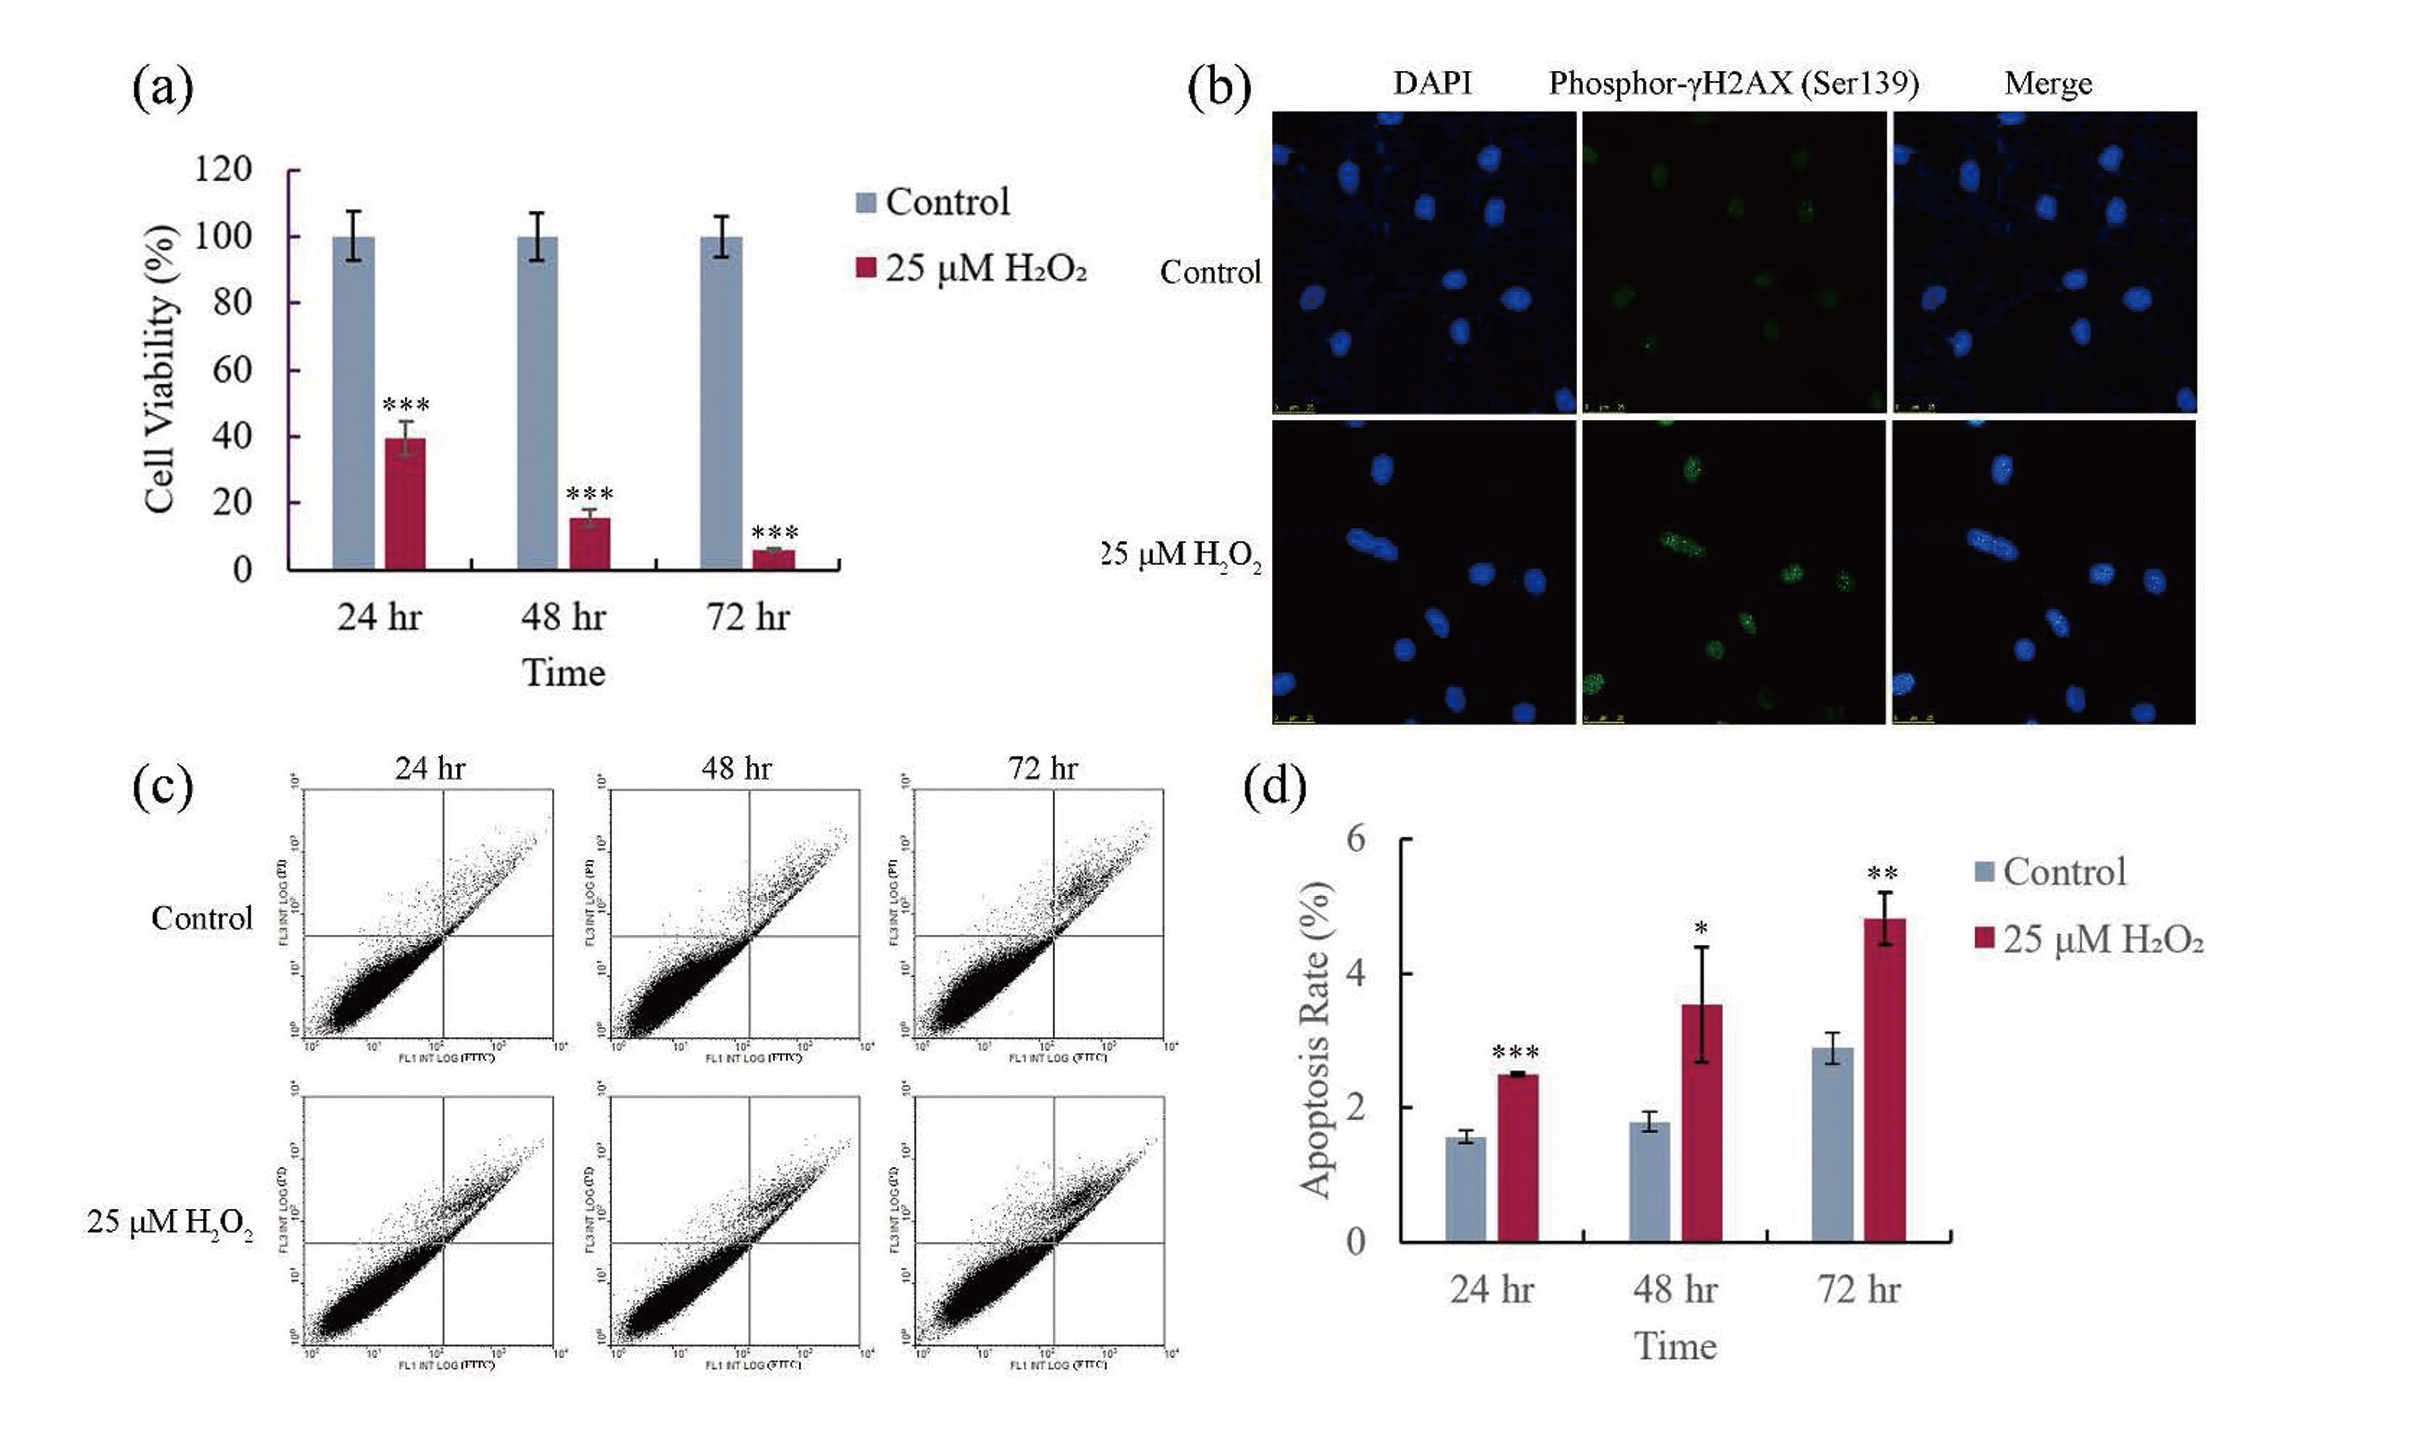
To determine whether oxidative stress could cause DNA damage in hGECs, after cells were treated with 25 μM H2O2 for 24 hr, immunocytochemistry was used to detect the phosphorylation of histone γH2AX in cells. During apoptosis, the initiation of DNA fragmentation induces phosphorylation of H2AX histone at serine 139 (Ser139) (Tong et al., 2020; Rogakou et al., 2000). As shown in Fig. 2b, only weak fluorescence signal of phosphor-γH2AX (Ser139) could be observed in the control groups; however, significant stronger fluorescence signal could be observed in the H2O2-treated groups. This result shows oxidative stress-induced DNA damage.
To determine whether oxidative stress could cause the apoptosis of hGECs, after cells were treated with 25 μM H2O2 for 24, 48, and 72 hr, flow cytometry was used to determine the apoptosis rate of hGECs. Fig. 2c shows that the apoptosis rates in both control and H2O2 treatment groups were low; however, significant higher apoptosis rates were observed in the H2O2 treatment groups at three detection time points (shown in Fig. 2d). This result indicates that oxidative stress caused the apoptosis of hGECs, and this may be one of factors which resulted in low cell viability in the H2O2 treatment groups.
Oxidative stress causes active DNA demethylation in hGECs
The effect of oxidative stress on the level of DNA methylation in hGECs was determined by bisulfite sequencing. The methylation of L1Hs is a surrogate marker of global DNA methylation (Tong et al., 2020; Maugeri et al., 2018). There are 370 bp and 19 CpG sites in one of the CGIs in human L1Hs (Fig. 3a). As shown in Fig. 3b and 3c, treatment with 25 μM H2O2 for 24 hr could result in a significant (p < 0.001) decrease in the level of methylation in this CGI. This result indicates that oxidative stress caused global DNA demethylation in hGECs.
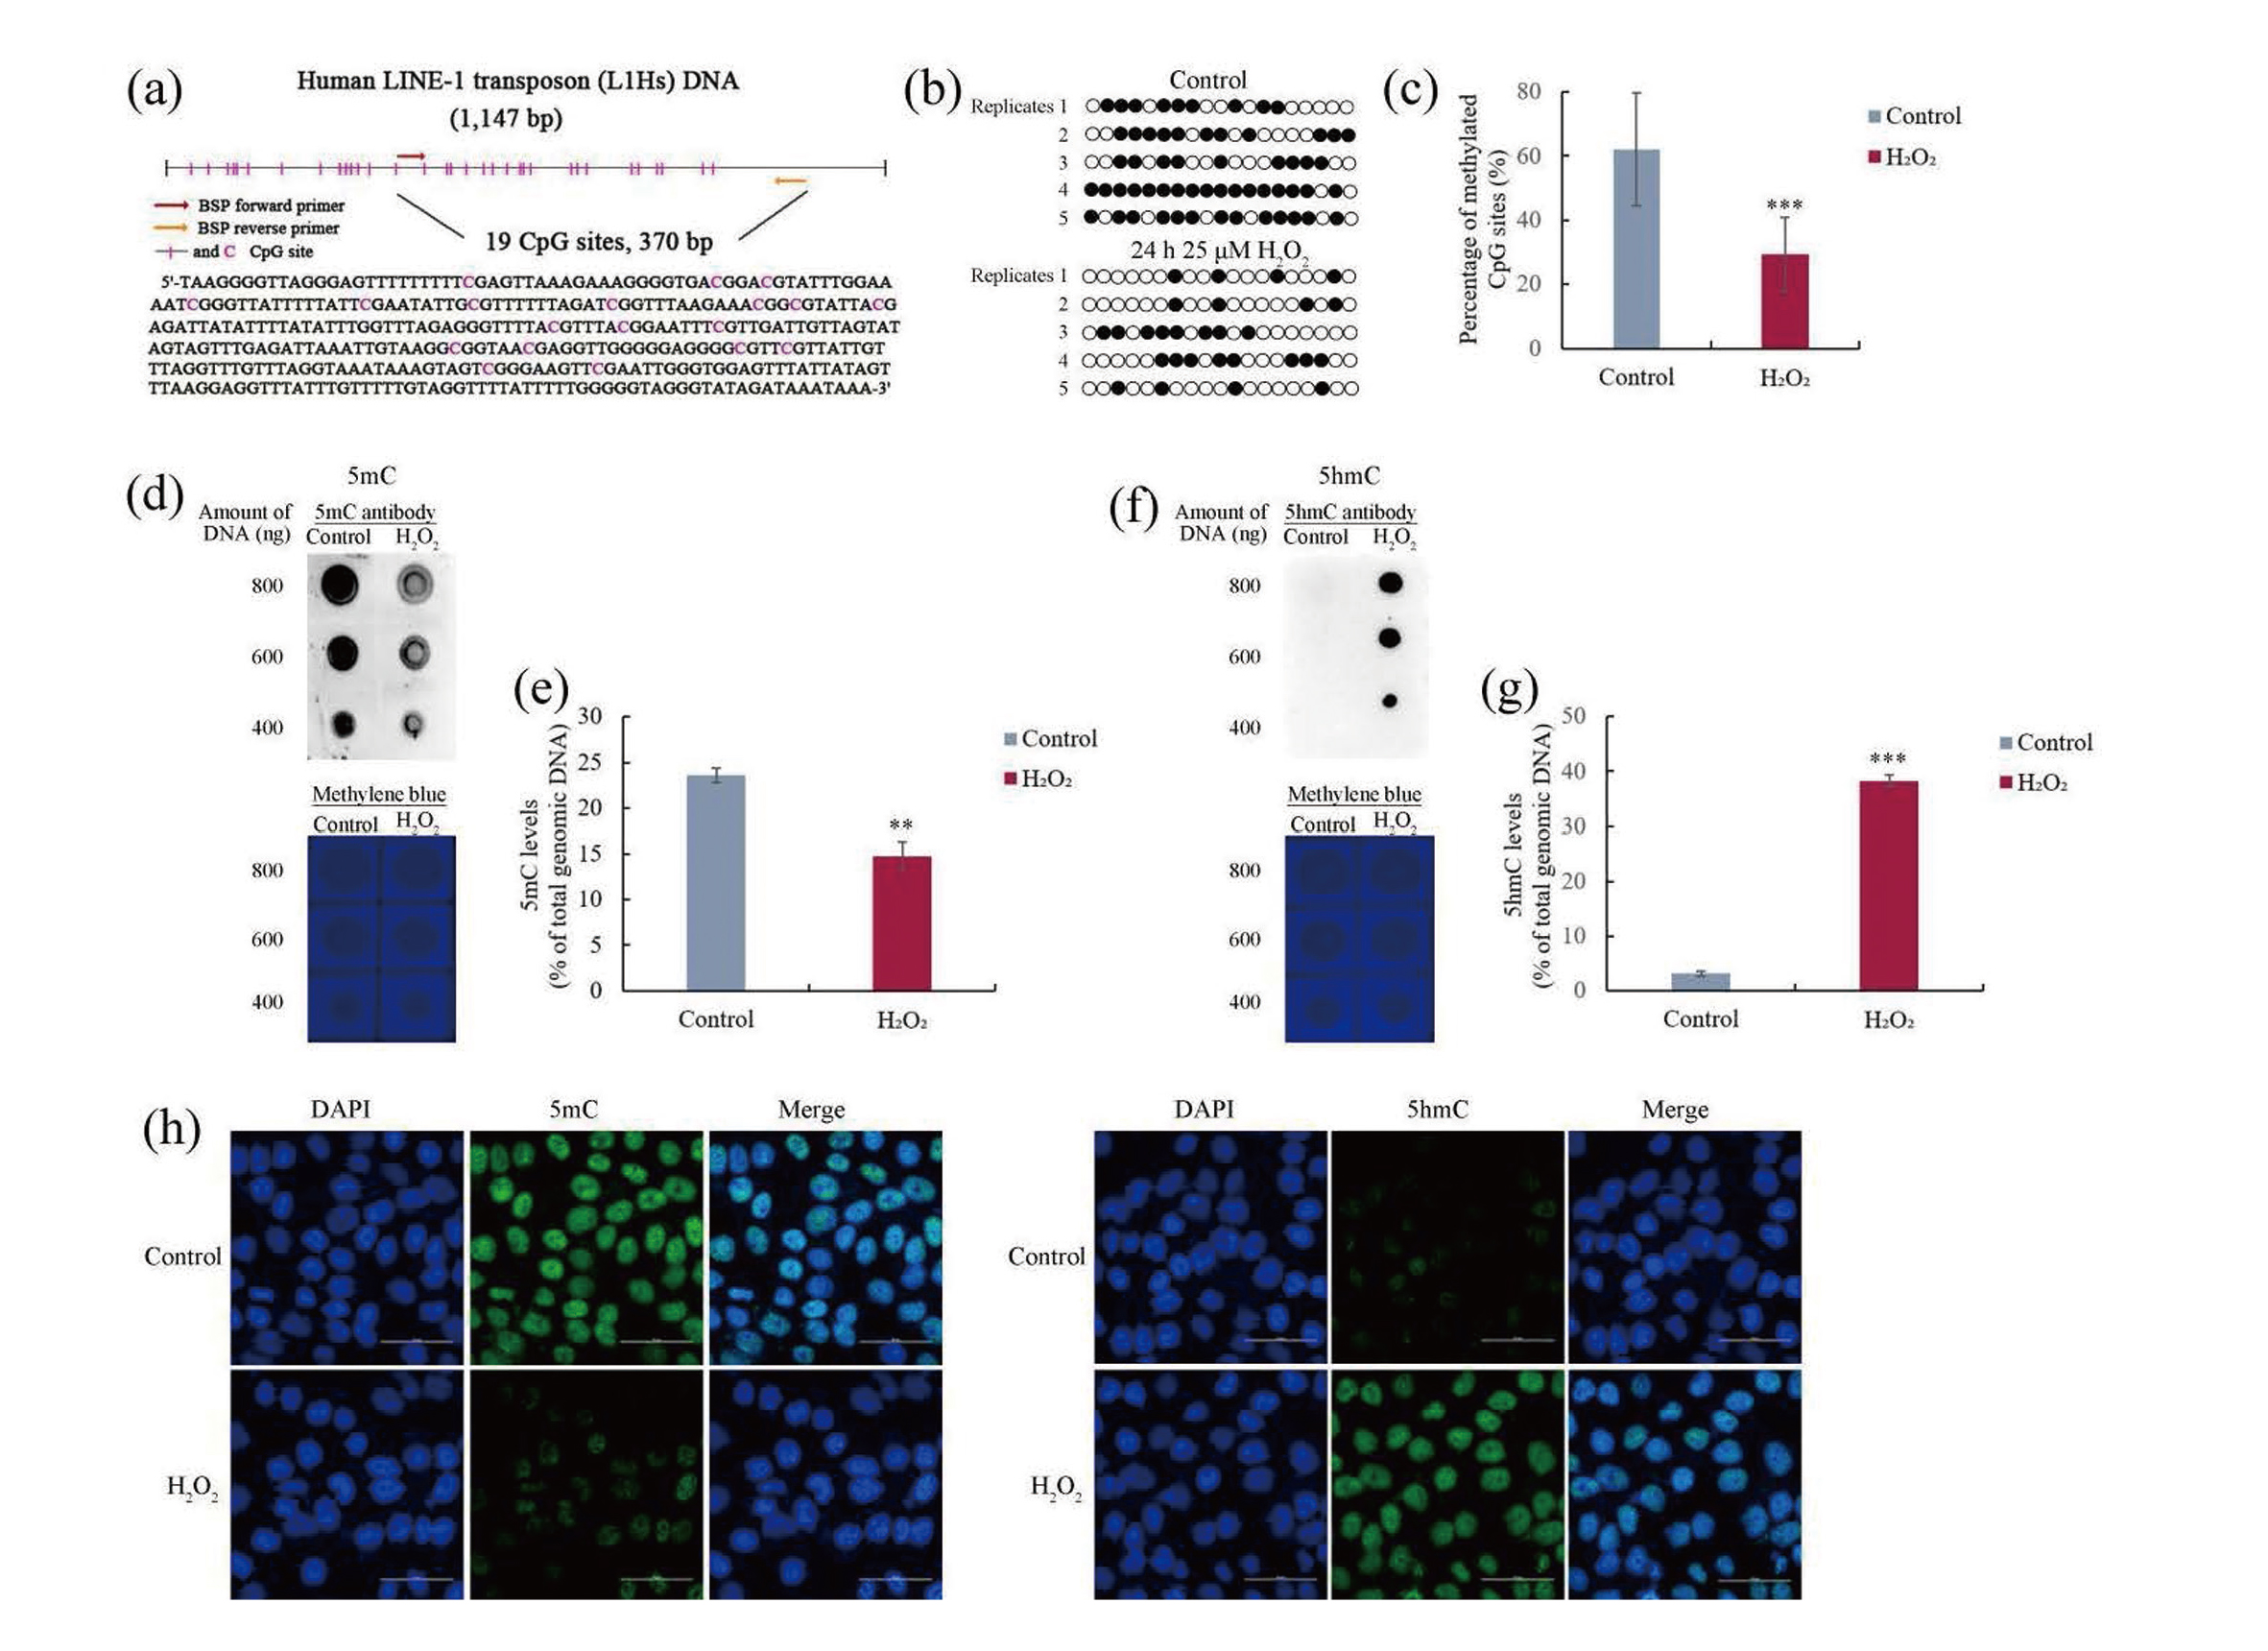
DNA demethylation can be achieved either passively, by simply not methylating the new DNA strand after replication, or actively, by TET-mediated the iterative oxidation of 5mC to 5hmC, 5-formylcytosine, and 5-carboxylcytosine (Sadakierska-Chudy et al., 2015; Li, 2013). In our previous study, oxidative stress caused by high concentration of curcumin treatment could downregulate the expression of DNMT1, subsequently resulted in passive DNA demethylation in hGCCs (Tong et al., 2020). We want to know whether oxidative stress can cause active DNA demethylation in hGECs. The TET-mediated oxidation of 5mC to 5hmC is the first step in active DNA demethylation (Li, 2013). After hGECs were treated with 25 μM H2O2 for 24 hr, the amounts of 5mC and 5hmC were determined by dot blot. Fig 3d-3g clearly shows a significant (p < 0.01) decrease in the amount of 5mC, and a significant (p < 0.001) increase in the amount of 5hmC in the H2O2-treated groups, indicating oxidative stress-induced active DNA demethylation in hGECs.
Immunocytochemistry was used to further confirm the oxidative stress-induced active DNA demethylation in hGECs, after cells were treated with 25 μM H2O2 for 24 hr. As shown in Fig 3f, H2O2 treatment significantly decreased the fluorescence signal of 5mC, while increased the fluorescence signal of 5hmC, implying the oxidation of 5mC to 5hmC, and further confirming the oxidative stress-induced active DNA demethylation in hGECs.
Taken together, these results indicate that treatment with 25 μM H2O2 for 24 hr could cause oxidative stress, and subsequent active DNA demethylation in hGECs.
Oxidative stress-induced TET1 upregulation mediates active DNA demethylation in hGECs
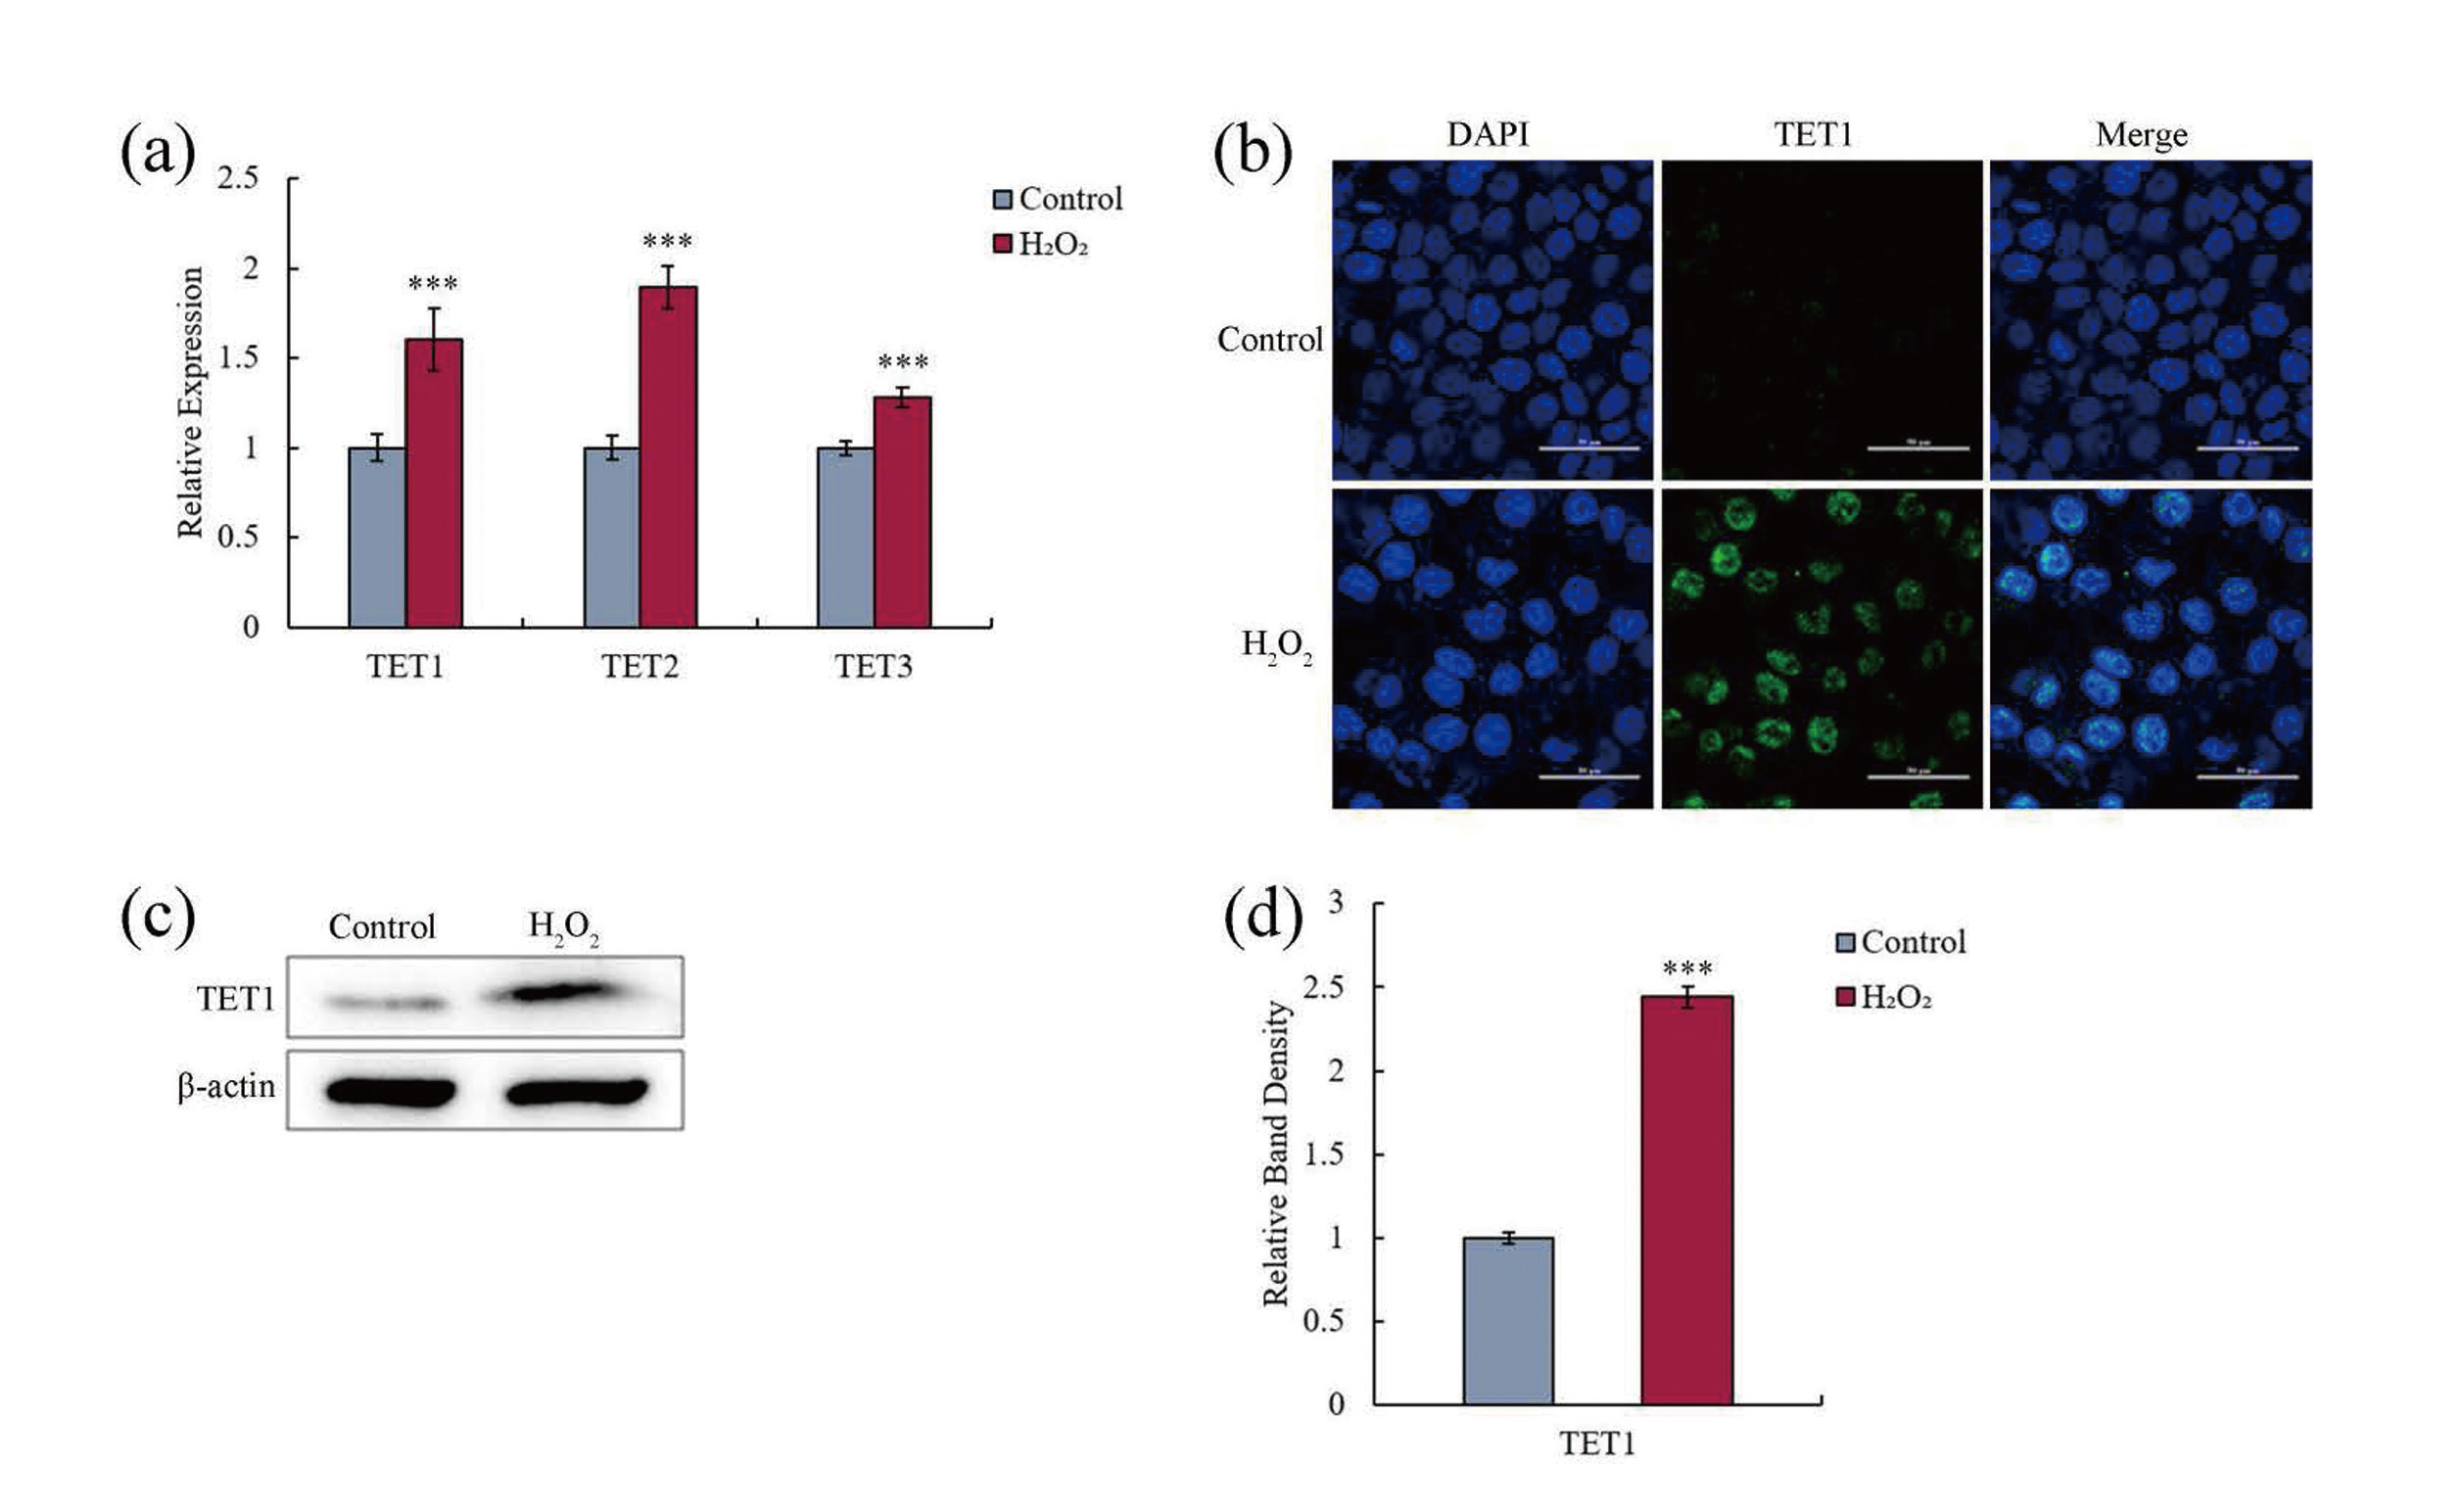
All members of TET proteins, including TET1, TET2, and TET3, possess 5mC to 5hmC oxidizing activity (Li, 2013). It needs to be further confirmed whether oxidative stress-caused active DNA demethylation in hGECs was attributed to the upregulation in the expression of TET genes. After hGECs were treated with 25 μM H2O2 for 24 hr, qRT-PCR was used to assess the expression of TET. Fig. 4a shows that H2O2 treatment could significantly (p < 0.001) upregulate the expression of all TET genes.
After the same treatment, H2O2-induced upregulation in the expression of TET genes was further confirmed by immunocytochemistry. Interestingly, only TET1 could be detected in H2O2-treated groups, TET2 and TET3 could not be observed in neither control groups nor H2O2-treated groups (shown in Fig. 4b). The failure in the detection of TET2 and TET3 may be due to the extreme low expression of these two genes in hGECs. However, this assumption needs to be further confirmed.
After the same treatment, the amounts of TET proteins in hGECs were further determined by western blot. Fig. 4c and 4d also show a significant increase in TET1 protein in H2O2-treated groups, and TET2 and TET3 could not be detected in any groups, again.
All of these results indicate that oxidative stress-induced TET1 upregulation mediated active DNA demethylation in hGECs.
DISCUSSION
Cellular redox homeostasis is an essential and dynamic process that can regulate diverse biological processes, including metabolism, cell death, differentiation and development, immune responses, circadian rhythm, and others (Le Gal et al., 2021). Some endogenous and exogenous factors can result in the excessive production of ROS in cells, disrupting redox homeostasis and causing oxidative stress, oxidative damage of lipids, proteins, and DNA, cell death, and the occurrence of many diseases. The GI tract is prone to ROS attack as it is accessed by the outside environment with resident immune cells and intestinal flora as well as dietary factors, all potential sources of ROS (Bhattacharyya et al., 2014). A wide diversity of GI disorders arises in part from oxidative stress (Bhattacharyya et al., 2014; Pérez et al., 2017). Several underlying mechanisms have been proposed for ROS-induced GI pathological changes, including the damage of mitochondria and DNA, lipid peroxidation, autophagy, the activation of certain signaling pathways, and inflammation and damage of GI mucosa (Packiriswamy et al., 2017; Kruidenier et al., 2003; Song et al., 2007; Sanpinit et al., 2021; Zhang et al., 2018b). The human stomach lumen is lined with a monolayer of epithelial cells, which provide a physical barrier against carcinogens, toxins, or pathogens. It has been confirmed that Helicobacter pylori infection, excessive alcohol consumption, and heavy use of nonsteroidal anti-inflammatory drugs can cause oxidative stress, and subsequent pathological changes, autophagy, and apoptosis of gastric epithelial cells, ultimately resulting in the occurrence of gastritis, gastric ulcers, even gastric cancer (Ding et al., 2007; Pérez et al., 2017; Huang et al., 2021; Li et al., 2021; Xu et al., 2021). However, little is known about the effects of oxidative stress on epigenetic changes in gastric epithelial cells. In fact, epigenetic aberrations contribute to the occurrence and development of various diseases, including cancers, autoimmune/inflammatory diseases, endocrine diseases, respiratory system diseases, dermatologic disorders, and cardiovascular diseases (Ilango et al., 2020; Sato et al., 2017; Surace and Hedrich, 2019; Rosen et al., 2018; Gomez 2019; Dopytalska et al., 2021; Zhang et al., 2018a). The present study demonstrated H2O2-induced DNA demethylation in hGECs via oxidative stress-TET1 upregulation-DNA demethylation pathway, confirming the contribution of environmental factors to the epigenetic modification and subsequent pathological changes of GI cells. Therefore, we propose that TET inhibitors can be used as medicine to restore the epigenetic changes induced by oxidative stress, inhibit possible malignant transformation of GI cells.
In the present study, the results of qRT-PCR showed that all members of TET genes could be expressed in hGECs. However, only TET1 protein could be detected in the results of western blot and immunocytochemistry, although TET antibodies derived from different companies (Abcam and Beyotime Biotechnology) were used in these experiments. This discordance in the results of TET expression may be due to the extreme low levels of TET2 and TET3 in hGECs. After all, qRT-PCR is more sensitive than immunocytochemistry and western blot. In fact, different members of Tet family genes are differentially expressed in different developmental stages of different tissues (Zhong et al., 2017; Liu et al., 2013). However, we cannot exclude the possibility that TET2 and TET3 proteins were actively degraded due to no function in oxidative stress-induced DNA demethylation in hGECs. This assumption needs to be further confirmed.
The molecular mechanism of oxidative stress-induced TET upregulation is still unclear. ROS can mediate various signaling pathways, including NF-κB, MAPK, Keap1-Nrf2-ARE, PI3K-Akt, Ca2+, and others (Zhang et al., 2016). Moreover, cellular metabolism is strongly interconnected with the cellular redox state (Sies and Jones, 2020; Lennicke and Cochemé, 2021). It needs to be further confirmed which signaling/metabolic pathways mediate oxidative stress-induced TET upregulation in hGECs.
In conclusion, H2O2 treatment can cause oxidative stress in hGECs, exhibited by increased levels of ROS, SOD, CAT, and MDA, and decreased level of GSH. Oxidative stress inhibits proliferation, damages nuclear DNA, causes apoptosis, upregulates TET1 gene, and ultimately leads to active DNA demethylation in hGECs.
ACKNOWLEDGMENTS
We would like to thank Dr. Zhiqiang Du for technical assistance.
This work was supported by the National Natural Science Foundation of China [grant number: 31660340]; Natural Science Foundation of Inner Mongolia Autonomous Region of China [grant number: 2022MS03017].
Conflict of interest
The authors declare that there is no conflict of interest.
REFERENCES
- Bhattacharyya, A., Chattopadhyay, R., Mitra, S. and Crowe, S.E. (2014): Oxidative stress: an essential factor in the pathogenesis of gastrointestinal mucosal diseases. Physiol. Rev., 94, 329-354.
- Bjørklund, G., Peana, M., Maes, M., Dadar, M. and Severin, B. (2021): The glutathione system in Parkinson’s disease and its progression. Neurosci. Biobehav. Rev., 120, 470-478.
- Cheleschi, S., De Palma, A., Pascarelli, N.A., Giordano, N., Galeazzi, M., Tenti, S. and Fioravanti, A. (2017): Could Oxidative Stress Regulate the Expression of MicroRNA-146a and MicroRNA-34a in Human Osteoarthritic Chondrocyte Cultures? Int. J. Mol. Sci., 18, 2660.
- Ding, S.Z., Minohara, Y., Fan, X.J., Wang, J., Reyes, V.E., Patel, J., Dirden-Kramer, B., Boldogh, I., Ernst, P.B. and Crowe, S.E. (2007): Helicobacter pylori infection induces oxidative stress and programmed cell death in human gastric epithelial cells. Infect. Immun., 75, 4030-4039.
- Donkena, K.V., Young, C.Y. and Tindall, D.J. (2010): Oxidative stress and DNA methylation in prostate cancer. Obstet. Gynecol. Int., 2010, 302051.
- Dopytalska, K., Ciechanowicz, P., Wiszniewski, K., Szymańska, E. and Walecka, I. (2021): The Role of Epigenetic Factors in Psoriasis. Int. J. Mol. Sci., 22, 9294.
- Franco, R., Schoneveld, O., Georgakilas, A.G. and Panayiotidis, M.I. (2008): Oxidative stress, DNA methylation and carcinogenesis. Cancer Lett., 266, 6-11.
- Gomez, J.L. (2019): Epigenetics in Asthma. Curr. Allergy Asthma Rep., 19, 56.
- He, R., Cui, M., Lin, H., Zhao, L., Wang, J., Chen, S. and Shao, Z. (2018): Melatonin resists oxidative stress-induced apoptosis in nucleus pulposus cells. Life Sci., 199, 122-130.
- Hepburn, P.A., Margison, G.P. and Tisdale, M.J. (1991): Enzymatic methylation of cytosine in DNA is prevented by adjacent O6-methylguanine residues. J. Biol. Chem., 266, 7985-7987.
- Huang, Z., Shi, Y., Wang, H., Chun, C., Chen, L., Wang, K., Lu, Z., Zhao, Y. and Li, X. (2021): Protective Effects of Chitosan-Bilirubin Nanoparticles Against Ethanol-Induced Gastric Ulcers. Int. J. Nanomedicine, 16, 8235-8250.
- Ilango, S., Paital, B., Jayachandran, P., Padma, P.R. and Nirmaladevi, R. (2020): Epigenetic alterations in cancer. Front. Biosci., 25, 1058-1109.
- Kruidenier, L., Kuiper, I., Lamers, C.B. and Verspaget, H.W. (2003): Intestinal oxidative damage in inflammatory bowel disease: semi-quantification, localization, and association with mucosal antioxidants. J. Pathol., 201, 28-36.
- Le Gal, K., Schmidt, E.E. and Sayin, V.I. (2021): Cellular Redox Homeostasis. Antioxidants, 10, 1377.
- Lennicke, C. and Cochemé, H.M. (2021): Redox metabolism: ROS as specific molecular regulators of cell signaling and function. Mol. Cell, 81, 3691-3707.
- Li, B., Rong, Q., Du, Y., Zhang, R., Li, J., Tong, X., Geng, L. and Zhang, Y. (2021): Regulation of β1-integrin in autophagy and apoptosis of gastric epithelial cells infected with Helicobacter pylori. World J. Microbiol. Biotechnol., 38, 12.
- Li, C.J. (2013): DNA demethylation pathways: recent insights. Genet. Epigenet., 5, 43-49.
- Liu, R., Jin, Y., Tang, W.H., Qin, L., Zhang, X., Tellides, G., Hwa, J., Yu, J. and Martin, K.A. (2013): Ten-eleven translocation-2 (TET2) is a master regulator of smooth muscle cell plasticity. Circulation, 128, 2047-2057.
- Maugeri, A., Mazzone, M.G., Giuliano, F., Vinciguerra, M., Basile, G., Barchitta, M. and Agodi, A. (2018): Curcumin Modulates DNA Methyltransferase Functions in a Cellular Model of Diabetic Retinopathy. Oxid. Med. Cell. Longev., 2018, 5407482.
- Packiriswamy, N., Coulson, K.F., Holcombe, S.J. and Sordillo, L.M. (2017): Oxidative stress-induced mitochondrial dysfunction in a normal colon epithelial cell line. World J. Gastroenterol., 23, 3427-3439.
- Pérez, S., Taléns-Visconti, R., Rius-Pérez, S., Finamor, I. and Sastre, J. (2017): Redox signaling in the gastrointestinal tract. Free Radic. Biol. Med., 104, 75-103.
- Rogakou, E.P., Nieves-Neira, W., Boon, C., Pommier, Y. and Bonner, W.M. (2000): Initiation of DNA fragmentation during apoptosis induces phosphorylation of H2AX histone at serine 139. J. Biol. Chem., 275, 9390-9395.
- Rosen, E.D., Kaestner, K.H., Natarajan, R., Patti, M.E., Sallari, R., Sander, M. and Susztak, K. (2018): Epigenetics and Epigenomics: Implications for Diabetes and Obesity. Diabetes, 67, 1923-1931.
- Sadakierska-Chudy, A., Kostrzewa, R.M. and Filip, M. (2015): A comprehensive view of the epigenetic landscape part I: DNA methylation, passive and active DNA demethylation pathways and histone variants. Neurotox. Res., 27, 84-97.
- Samarghandian, S., Azimi-Nezhad, M., Farkhondeh, T. and Samini, F. (2017): Anti-oxidative effects of curcumin on immobilization-induced oxidative stress in rat brain, liver and kidney. Biomed. Pharmacother., 87, 223-229.
- Sanpinit, S., Chonsut, P., Punsawad, C. and Wetchakul, P. (2021): Gastroprotective and Antioxidative Effects of the Traditional Thai Polyherbal Formula Phy-Blica-D against Ethanol-Induced Gastric Ulcers in Rats. Nutrients, 14, 172.
- Sato, T., Issa, J.J. and Kropf, P. (2017): DNA Hypomethylating Drugs in Cancer Therapy. Cold Spring Harb. Perspect. Med., 7, a026948.
- Sies, H. and Jones, D.P. (2020): Reactive oxygen species (ROS) as pleiotropic physiological signalling agents. Nat. Rev. Mol. Cell Biol., 21, 363-383.
- Song, S., Guha, S., Liu, K., Buttar, N.S. and Bresalier, R.S. (2007): COX-2 induction by unconjugated bile acids involves reactive oxygen species-mediated signalling pathways in Barrett’s oesophagus and oesophageal adenocarcinoma. Gut, 56, 1512-1521.
- Surace, A.E. and Hedrich, C.M. (2019): The Role of Epigenetics in Autoimmune/Inflammatory Disease. Front. Immunol., 10, 1525.
- Tong, R., Wu, X., Liu, Y., Liu, Y., Zhou, J., Jiang, X., Zhang, L., He, X. and Ma, L. (2020): Curcumin-Induced DNA Demethylation in Human Gastric Cancer Cells Is Mediated by the DNA-Damage Response Pathway. Oxid. Med. Cell. Longev., 2020, 2543504.
- Wachsman, J.T. (1997): DNA methylation and the association between genetic and epigenetic changes: relation to carcinogenesis. Mutat. Res., 375, 1-8.
- Weitzman, S.A., Turk, P.W., Milkowski, D.H. and Kozlowski, K. (1994): Free radical adducts induce alterations in DNA cytosine methylation. Proc. Natl. Acad. Sci. USA, 91, 1261-1264.
- Wu, Q. and Ni, X. (2015): ROS-mediated DNA methylation pattern alterations in carcinogenesis. Curr. Drug Targets, 16, 13-19.
- Xu, Z., Li, B., Du, Y., Zhang, R., Tong, X., Li, J., Wu, Y., Ji, X. and Zhang, Y. (2021): Helicobacter pylori regulates ILK to influence autophagy through Rac1 and RhoA signaling pathways in gastric epithelial cells. Microb. Pathog., 158, 105054.
- Zhang, C., Ma, T., Luo, T., Li, A., Gao, X., Wang, Z.G. and Li, F. (2018a): Dysregulation of PARP1 is involved in development of Barrett’s esophagus. World J. Gastroenterol., 24, 982-991.
- Zhang, J., Wang, X., Vikash, V., Ye, Q., Wu, D., Liu, Y. and Dong, W. (2016): ROS and ROS-Mediated Cellular Signaling. Oxid. Med. Cell. Longev., 2016, 4350965.
- Zhang, W., Song, M., Qu, J. and Liu, G.H. (2018b): Epigenetic Modifications in Cardiovascular Aging and Diseases. Circ. Res., 123, 773-786.
- Zhong, X., Wang, Q.Q., Li, J.W., Zhang, Y.M., An, X.R. and Hou, J. (2017): Ten-Eleven Translocation-2 (Tet2) Is Involved in Myogenic Differentiation of Skeletal Myoblast Cells in Vitro. Sci. Rep., 7, 43539.